

Abstract
Water scarcity threatens people in various regions, and has predominantly been studied from a water quantity perspective only. Here we show that global water scarcity is driven by both water quantity and water quality issues, and quantify expansions in clean water technologies (i.e. desalination and treated wastewater reuse) to 'reduce the number of people suffering from water scarcity' as urgently required by UN's Sustainable Development Goal 6. Including water quality (i.e. water temperature, salinity, organic pollution and nutrients) contributes to an increase in percentage of world's population currently suffering from severe water scarcity from an annual average of 30% (22%–35% monthly range; water quantity only) to 40% (31%–46%; both water quantity and quality). Water quality impacts are in particular high in severe water scarcity regions, such as in eastern China and India. In these regions, excessive sectoral water withdrawals do not only contribute to water scarcity from a water quantity perspective, but polluted return flows degrade water quality, exacerbating water scarcity. We show that expanding desalination (from 2.9 to 13.6 billion m3 month−1) and treated wastewater uses (from 1.6 to 4.0 billion m3 month−1) can strongly reduce water scarcity levels and the number of people affected, especially in Asia, although the side effects (e.g. brine, energy demand, economic costs) must be considered. The presented results have potential for follow-up integrated analyses accounting for technical and economic constraints of expanding desalination and treated wastewater reuse across the world.
Export citation and abstract BibTeX RIS

Original content from this work may be used under the terms of the Creative Commons Attribution 4.0 license. Any further distribution of this work must maintain attribution to the author(s) and the title of the work, journal citation and DOI.
1. Introduction
A growing worldwide population strongly increases the demands for clean water for different sectoral water uses (e.g. irrigation, domestic, energy, manufacturing uses) (Biswas and Tortajada 2018). Climate change induced increases in the frequency and intensity of hydro-climatic extremes (e.g. droughts, floods) (Dankers et al 2014, Prudhomme et al 2014, Trenberth et al 2014), combined with increasing intensification of agriculture, industrialisation, urbanisation, and water extractions and uses, aggravate water quality deterioration, particularly in developing countries (Macdonald et al 2016, UNEP 2016, Sinha et al 2017). These changes will challenge sustainable management of 'clean accessible water for all', one of the UN Sustainable Development Goals (SDGs) for 2030 (UN 2015).
So far, water scarcity assessments have focussed mainly on water quantity (Schewe et al 2014, Liu et al 2017, Cui et al 2018). A widely used index of water scarcity or water stress considers the proportion of the freshwater use (withdrawal) relative to the available freshwater resources (Liu et al 2017). This indicator has been used for several scientific studies (Kummu et al 2016, Liu et al 2017, Vanham et al 2018) and is also presented as SDG-indicator 6.4.2 for estimating levels of water stress (UN 2015). Previous work by Vanham et al (2018) evaluated the shortcomings of this water scarcity indicator, including the absence of water quality, the lack of consideration of unconventional water resources, and the weak temporal (annual) and spatial (country) resolutions used in most water scarcity assessments (Vanham et al 2018).
It is imperative that we understand regional hotspots of water scarcity in terms of both water quantity and quality, as the usability of water for human purposes and ecosystem health depends on both sufficient water quantity and suitable water quality (van Vliet et al 2017). Earlier studies used the water poverty index combining water quantity and quality data (Sullivan et al 2003) or included water pollution drivers in calculations of threat indices to human water security and biodiversity (Vörösmarty et al 2010). For Chinese cities and river basins (Zhao et al 2016, Liu et al 2017), the ratio of total water demands to freshwater availability has been combined with the grey water footprint (Hoekstra and Mekonnen 2012) (i.e. the amount of water required to dilute pollutants in wastewater to sufficiently meet environmental water quality standards). Following on this concept, an indicator of water scarcity has been developed including water quality requirements for different sectoral water uses (van Vliet et al 2017). However, an assessment of water scarcity accounting for water quality and clean water technologies is still lacking, in particular at the large scale.
Typically, water scarcity solutions focus on decreasing sectoral water uses (e.g. improved water use efficiencies) or by increasing water availability (e.g. increasing reservoir storage capacity). These solution options have been included in earlier water scarcity assessments (e.g. Ward et al 2010, Wada et al 2014a, Jägermeyr et al 2015). Clean water technologies suiting both the water quantity and water quality demands, such as desalinated water use and treated wastewater reuse, are fast-growing (Elimelech and Phillip 2011, Gude 2017, Jones et al 2019). Both options are considered as a key component to reduce water pollution and freshwater scarcity globally (SDG targets 6.3 and 6.4) (UN 2015). While some first steps have been made to implement seawater desalination in water scarcity quantifications (Oki and Kanae 2006, Hanasaki et al 2016), these assessments have ignored desalination of inland (brackish, river) waters and other sources (e.g. wastewater, brine), which together contribute to almost 40% of the desalination water use worldwide (Jones et al 2019). Furthermore, the desalination data used in previous studies did not consider sector-specific uses of desalinated water. Another previous study of Parkinson et al (2019) focused on improved water access, treatment and efficiencies towards the SDG6 targets using an integrated assessment modelling approach, but water quality conditions were disregarded.
Here we fill in the knowledge gap by presenting global hotspots of water scarcity driven by both surface water quantity and water quality issues, and quantify expansions in desalination and treated wastewater reuse to reduce the number of people suffering from water scarcity as required by UN's SDG6.
2. Methods
2.1. Water scarcity indicators and framework
We developed new indicators and a globally applicable model framework of water scarcity including a water demand versus supply dimension from both a surface water quantity and water quality perspective (figure 1). Our framework includes global gridded simulations at 0.5° × 0.5° spatial resolution of surface water availability and sectoral water use (section 2.2), surface water quality and sector water quality requirements (section 2.3) and spatially-explicit data of desalination and treated wastewater reuse capacities (section 2.4). We focus on these two water technologies, because they are fast-growing technologies suiting both water quantity and quality demands (Elimelech and Phillip 2011, Gude 2017) and because they are considered as a key component to reduce freshwater scarcity globally (UN 2015). Next to this, wastewater treatment impacts are also included in the modelling of pollutant loadings and hence in surface water quality concentrations. The focus of this water scarcity assessment is on surface water resources, and with particular focus on impacts of surface water quality, desalination and treated wastewater reuse on water scarcity levels. We do not include groundwater resources in our study, given the current lack of a globally-applicable groundwater model accounting for both water quality and quantity.
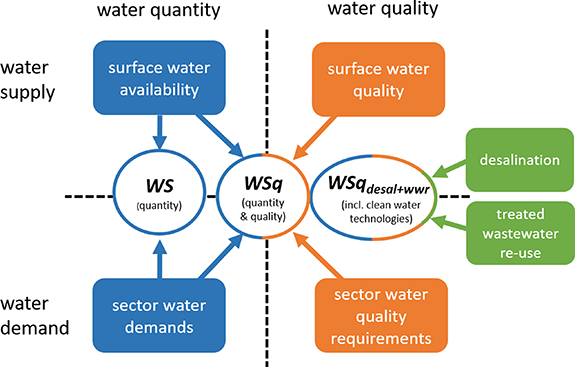
Figure 1. Water scarcity framework and three water scarcity indicators: 1. water scarcity based on only quantity (WS), 2. water scarcity including both water quantity and water quality (WSq); and 3. water scarcity based on both water quantity and quality, and including desalination and treated wastewater reuse (WSq_ desal + wwr).
Download figure:
Standard image High-resolution imageWater scarcity was quantified using three different water scarcity indicators: 1) water scarcity based on only surface water quantity (WS); 2) water scarcity including both surface water quantity and water quality for different sectoral uses (WSq); and 3) water scarcity based on both surface water quantity and quality, and including desalination of various sources (sea water, inland resources) and treated wastewater reuses per sector (WSq_ desal +wwr). These three indicators are briefly discussed below and in more detail (including their equations) in the supplementary section 1 (available online at stacks.iop.org/ERL/16/024020/mmedia).
Water scarcity based only on quantity (WS) is calculated as the ratio of water withdrawals for all sectors to surface water availability ('criticality ratio'), accounting also for environmental flow requirements (EFRs). The 'criticality ratio' is a widely use approach (Alcamo et al 2003b, Raskin et al 1997, Liu et al 2017, Vanham et al 2018), which has also been adopted by the UN SDG-indicator 6.4.2. (for details see supplementary section 1.1 and supplementary equation 1).
Water scarcity including both water quantity and water quality (WSq) is estimated by using the ratio of the sectoral water withdrawals of acceptable quality to the water availability. Under conditions that a water quality constituent i does not meet the sector water quality requirements for sector j (Ci > Cmaxi,j ) we quantify the additional water needed to obtain acceptable water quality by dilution (dqi,j ). For this, we estimate for each water use sector the most critical water quality constituent resulting in the highest dilution water demands (dqmax j ). Here we follow on from the concepts of grey water footprint and previous work (Hoekstra and Mekonnen 2012, van Vliet et al 2017, Ma et al 2020), but focussing on dilution of water withdrawn for specific-sector uses rather than total water availability. For thermoelectric water withdrawals, which largely depend on water temperature as the critical water quality constituent, we used spatially-explicit values of maximum permitted water temperature for cooling water use (see supplementary section 3.5, supplementary table 1). Where the water temperature exceeds permissible levels, we calculate the extra surface water withdrawal needed to dilute thermal effluents from power plants (i.e. dissipate the same waste heat). This is in line with the increase in water demands for power plant cooling under higher water temperatures as quantified in earlier work (Koch and Vögele 2009, van Vliet et al 2012). Additional dilution water demands can also be estimated to obtain acceptable salinity, for instance, for irrigation uses. This dilution water suiting water quality for sectoral use can in principle originate from various sources (e.g. treated (waste) water or groundwater). In our global assessment we do however not specify the origin of these alternative water resource, but we quantify the potential dilution water requirement needed to obtain acceptable quality. This results in a calculated additional 'pressure' on the water system (higher water scarcity levels) in case water quality does not meet certain sectoral water quality requirements. Our water scarcity approach explicitly accounts for different quality requirements by different intended uses (for details see supplementary section 1.2 and supplementary equation 2).
We further developed this water scarcity indicator to account for spatially-explicit desalination uses and treated wastewater reuses. We distinguish between desalinated water from 'new' sources (i.e. beyond what is available from inland waters, e.g. seawater) and 'existing' (inland) sources (brackish water, river waters) per water use sector (see equation 1; for details see supplementary section 1.3). Both desalination and treated wastewater are subtracted from the sectoral water demand and hence also cause a reduction in the volume of water required for dilution of water to obtain an acceptable quality (dq).

Where WSqdesal+wwr= water scarcity including water quality, desalination and treated wastewater reuse [−]; D= water withdrawal for sector j [m3s−1]; Q= water availability [m3s−1]; EFR= environmental flow requirements [m3s−1]; dqi,j = extra water withdrawals for dilution to obtain acceptable quality for sector j and water quality constituent i [m3s−1]; dqmax j= maximum required water withdrawals for dilution to obtain acceptable quality for sector j based on the most critical water quality constituent [m3s−1]; Nj = desalinated water of 'new' sources (e.g. seawater, brine) for sector j [m3s−1]; Ej = desalinated water of 'existing' sources (inland brackish, river water resources) used for sector j [m3s−1]; Wj = treated wastewater reuse for sector j [m3s−1]; Ci = actual water quality level of water quality constituent i [unit depends on water quality constituent considered, e.g. mg l−1 for concentrations, °C for water temperature]; Cmax i,j = maximum water quality threshold for water quality constituent i for water use sector j [e.g. mg l−1,°C].
All water scarcity calculations are at 0.5° × 0.5° spatial resolution globally and with a monthly timestep, focussing on the period of 2000–2010. We identified water scarcity levels higher than 0.4 as 'severe water scarcity' in line with previous work (Liu et al 2017, Hanasaki et al 2018), facilitating comparisons with previous studies. The average population under 'severe' water scarcity was quantified by combing our monthly water scarcity calculations with gridded (0.5°) population data (Goldewijk et al 2005, 2010).
2.2. Global water resources and sectoral water use modelling
For the water quantity component of our water scarcity framework we used global gridded simulations of surface water availability (i.e. discharge), sectoral water use (i.e. withdrawal and consumption) at 0.5° × 0.5° spatial resolution and on a monthly time step for 1979–2010 from four global hydrological models: PCR-GLOBWB (van Beek et al 2011, Wada et al 2011, 2014b, Sutanudjaja et al 2018), H08 (Hanasaki et al 2008), WaterGAP2 (Döll et al 2003, Alcamo et al 2003a, Flörke et al 2013, Müller Schmied et al 2016) and VIC (Liang et al 1994, Lohmann et al 1998, Hamman et al 2018, Droppers et al 2019). We used simulated actual water withdrawal and consumption for the main water use sectors irrigation, domestic, manufacturing and thermoelectric water uses. These global hydrological models were selected because of their ability to simulate both water availability and sectoral water use on a global scale. Multi-model mean results were calculated to account for uncertainties in water availability and sectoral water use (withdrawal and consumption) simulations. EFRs were calculated using the monthly variable flow method (Pastor et al 2014), on the multi-model average discharge. For further details and results on the global water resource and water use modelling we refer to supplementary section 2.
2.3. Global water quality modelling and sector water quality requirements
The water quality component of our water scarcity framework accounts for surface water temperature, salinity (total dissolved solids; TDS), organic pollution (biochemical oxygen demand; BOD) concentrations), total nitrogen (TN) and total phosphorous (TP) concentrations. These water quality constituents are selected because they are key in constraining different sector water uses and ecosystem health (Scheffer et al 2001, von der Ohe and Liess 2004, Dumont et al 2012, Herbert et al 2015). In addition, most of these water quality constituents are also part of SDG indicator 6.3.2 ('Proportion of bodies of water with good ambient water quality').
We developed a process-based global gridded surface water quality model to simulate surface water temperature, salinity (TDS concentrations), and organic pollution (BOD concentrations) using the approaches described in supplementary section 3. This water quality model was applied on 0.5° × 0.5° spatial resolution globally and monthly timestep for the period 1979–2010. Simulated return flows from the global hydrological models per water use sector (supplementary section 2, supplementary figure 3) were calculated and used as input to estimate pollutant loadings for the surface water quality modelling. Thermoelectric return flows were used to simulate impacts of heat effluents from power plants on surface water temperature. For calculating TDS loadings, irrigation and manufacturing return flows, together with population numbers and TDS excretion rates were used. For organic pollution (BOD) loadings, we used manufacturing return flows, population and livestock numbers, and excretion rates per capita and livestock type (cattle, chickens, ducks, goats, pigs and sheep). Next to this, pollutant loadings were calculated including the country-based fractions of wastewater treatment types (primary, secondary, tertiary and advanced treatment) and removal efficiencies per pollutant and treatment level (for details see supplementary section 3). In addition, global grid-based (0.5° × 0.5°) simulations of in-stream concentrations of TN and TP were produced with the IMAGE-GNM model (Beusen et al 2015, 2016) (supplementary section 3).
Model validation against observed surface water quality records show that the observed water quality conditions are represented realistically by the global surface water quality model (supplementary figures 5–10 and supplementary section 3 for more details). However, the station density and number of water quality measurements for model validation is low particularly in the relatively dry regions of the world (e.g. parts of Africa, Australia, Asia and Middle East). This limits analyses of the water quality model performances in those regions. Next to this, the uncertainties in the simulated water availability are also highest in particular in these dry regions (supplementary figure 4), which likely also results in higher uncertainties in simulated in-stream concentrations and water scarcity levels. The results of simulated water availability, water quality and water scarcity are therefore masked in the global maps for the very dry regions of the world (with surface water availability less than 1 m3 s−1). These very dry regions contribute to less than 1.6% of the global population.
Water quality requirements for irrigation, domestic, manufacturing and thermoelectric water uses and for ecosystem health used in our water scarcity framework are derived per sector from international standards (supplementary section 3.5). The exception is water temperature for which standards were considered only for energy (thermoelectric) uses and ecosystem health. An overview of the selected water quality thresholds for all water use sectors and selected water quality constituents, as well as the corresponding sources is presented in supplementary table 1.
2.4. Desalination and treated wastewater reuse globally
Desalination capacity was derived from a global spatially-explicit desalination plant database (GWI 2019a) including results of 15 906 operational desalination plants (supplementary section 4.1). This database accounts for desalinated water use per main water use sector (domestic, manufacturing, energy, irrigation) individually (supplementary figure 12). Our approach thus accounts for sector-specific desalination uses and considering different sources: seawater, inland (brackish, river) sources, brine and wastewater.
A global spatially-explicit dataset of wastewater reuse was developed on 0.5° × 0.5° spatial resolution by downscaling of country data of existing sources (AQUASTAT 2019, GWI 2019b) with total gridded population numbers (Klein Goldewijk 2005, Klein Goldewijk et al 2010) as described in more detail in supplementary section 4.2 (supplementary figure 13).
2.5. Expansion in desalination and treated wastewater reuse towards water scarcity mitigation
We quantify how much expansion in desalination and treated wastewater reuse would potentially be required compared to current capacities to 'substantially reduce the number of people suffering from water scarcity' in line with SDG target 6.4. For this final part of the analyses, we focus on water scarcity levels below 0.2 as target towards water scarcity mitigation, because a water scarcity threshold of 0.2 has typically been set as a limit towards 'moderate water scarcity' in contrast to 0.4 representing 'severe water scarcity' (Liu et al 2017, Hanasaki et al 2018). For the analyses of potential expansion in desalination and treated wastewater reuse towards water scarcity mitigation (in line SDG target 6.4) we therefore consider technological expansions aiming at water scarcity levels below 0.2 as an appropriate target. We calculated the required expansion in desalination capacity of both seawater and inland water resources and treated wastewater reuse volume needed under the present (2000–2010) levels to obtain water scarcity levels below 0.2 (WSq_ desal +wwr≤ 0.2). We consider an increase in desalination capacity (from both sea water and inland surface water resources) required to fulfil sector demands for the domestic, manufacturing and energy sectors, which are the dominant users of desalinated water, accounting for 97% of the world's desalination capacity (Jones et al 2019). Expansion in sea water for desalination are constrained to locations proximate to the coastline (<100 km) where increases in seawater desalination are economically feasible and technically viable (Zhou 2005). In locations without ready access to seawater, expansions in desalination are assumed to be covered by existing inland water resources (e.g. river water, brackish water), and are constrained by available water resources in contrast to desalination expansion of seawater, which was considered as an 'unlimited source'. Expansion in treated wastewater reuse towards water scarcity reduction is used for the irrigation sector only, which is the dominant user in terms of treated wastewater (Qadir et al 2007, WWAP 2017, Zhang and Shen 2017). Expansion in treated wastewater reuse capacity were constrained by the available total wastewater produced per gridcell (for details see supplementary section 4.3, supplementary table 3).
3. Results
3.1. Water scarcity hotspots driven by water quantity and water quality
Our results show that including water quality contributes to an increase in the percentage of the global population currently suffering from severe water scarcity from an annual average of 30% (22%–35% monthly range; only quantity) to 40% (31%–46%; including water quality) for 2000–2010. We focus here on water scarcity levels equal or higher than 0.4, which has typically been set as a limit towards 'severe water scarcity' (Liu et al 2017, Hanasaki et al 2018). Water scarcity levels and hence the number of people affected differ per month, with the largest inter-annual variability in Australia and lowest in North America (figure 2(a)). Water scarcity intensification by accounting for water quality occurs in South America and Africa, but also in particular in the severe water scarcity regions, such as in South and East Asia (India and China), Middle East, Southern Europe and Mexico (figures 2(a) and (b)). In most of these water scarcity hotspots we find that water scarcity is driven by a combination of water quantity and water quality issues (figure 2(c)). Here, excessive sectoral water withdrawals result in high water quantity-driven water scarcity, but polluted return flows degrade water quality, depending also on wastewater treatment efficiencies and capacities.
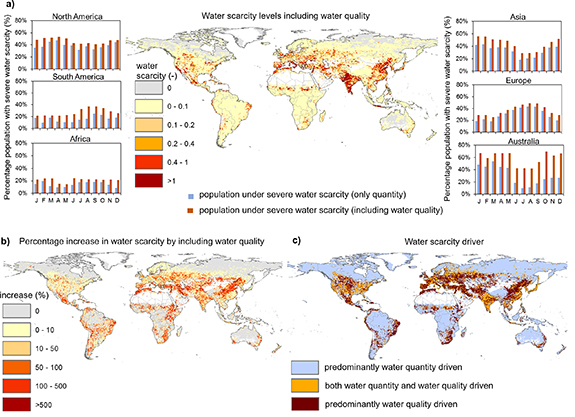
Figure 2. Water scarcity driven by water quantity and water quality issues for 2000–2010. Impacts of water quality on global water scarcity levels including both water quantity and various water quality constituents (water temperature, salinity (TDS), organic pollution (BOD), total nitrogen and total phosphorous concentrations) and bar plots with percentage of population affected by severe water scarcity (a), percentage increase in water scarcity levels by including water quality compared to the approach focussing solely on water quantity (b) and identification of main drivers of water scarcity (water quantity, water quality or combined) (c). Regions with water availability less than 1 m3s−1 are masked (white).
Download figure:
Standard image High-resolution imageWhile different water quality constituents (pollutants) may have different impacts in terms of constraints for sectoral uses, overall consistent water quality hotspots are identified for organic pollution, salinity and nutrients (figure 3). This is due to common pollution sources and contributing sectors, and is in line with previous large-scale water quality assessments covering multiple water quality constituents (Kroeze et al 2016, UNEP 2016, Strokal et al 2019, van Vliet et al 2019). In particular in north-eastern China, but also in other parts of central Asia, and parts of the Mediterranean, western US and Mexico, are identified as water quality hotspots regions in terms of high salinity (TDS), organic pollution (BOD) and nutrients (TN, TP) concentrations.
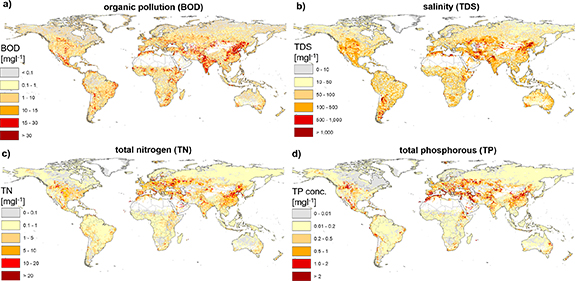
Figure 3. Global surface water quality hotspots. Average simulated in-stream concentrations presented for simulated organic pollution as indicated by biochemical oxygen demand (BOD) (a), salinity as indicated by total dissolved solids (TDS) (b), total nitrogen (TN) (c) and total phosphorous (TP) (d) concentrations. Regions with water availability less than 1 m3s−1 are masked (white). For details of water quality modelling and validation results see supplementary section 3, and supplementary figures 5–10.
Download figure:
Standard image High-resolution imageDegraded water quality may result in unsuitability for sectoral water uses, exacerbating water scarcity levels. For the most severe water scarcity hotspots in the world, including eastern China and parts of central Asia, water scarcity is strongly water quality-driven (figure 2(c)). Here, we see that water scarcity levels increase by an order of magnitude compared to water scarcity based on only water quantity. Exacerbation of water scarcity due to water pollution in China is in line with previous water scarcity studies for this region (Zhao et al 2016, Ma et al 2020). In contrast, in regions with low sectoral water uses and pollution levels and with high water availability (e.g. tropical regions and high latitudes) we find that water scarcity levels, while being low, are mainly water-quantity driven (figure 2(c)).
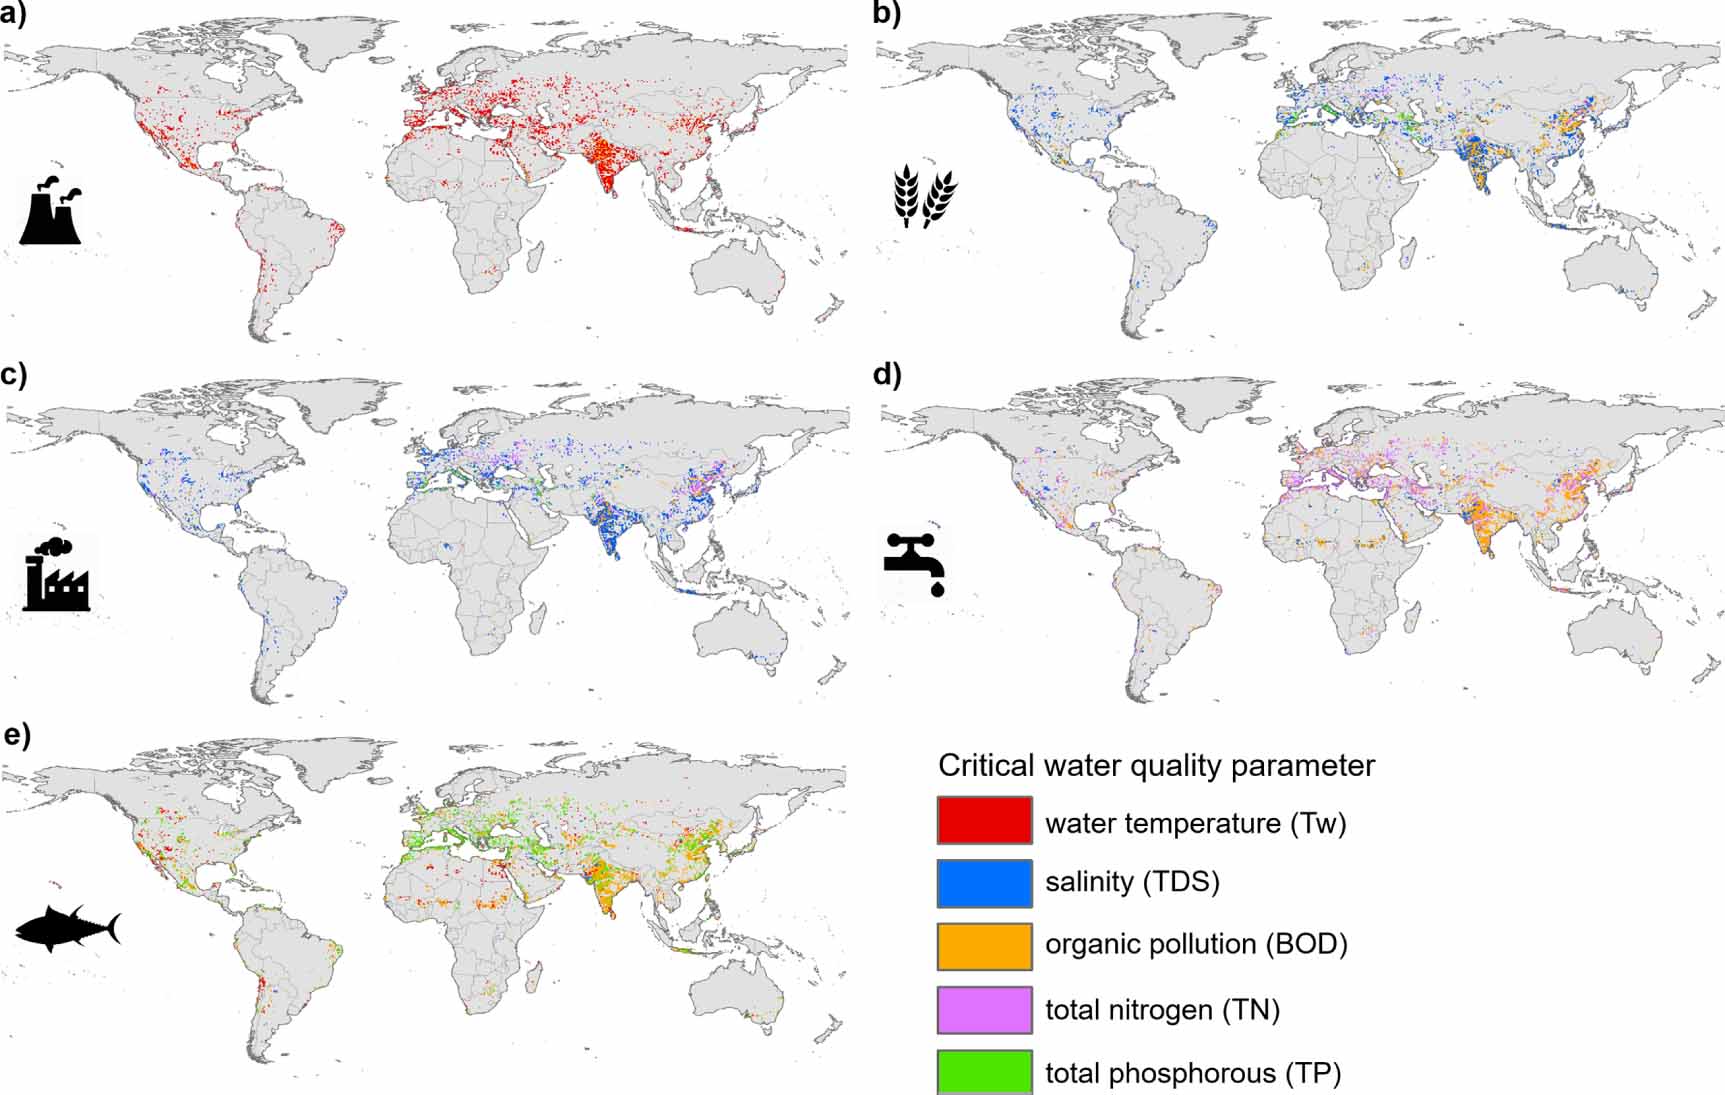
We identify for each water use sector and for freshwater ecosystems the main critical water quality constituent that has the strongest contribution in water scarcity intensification. This shows that increases in water scarcity for the energy (thermoelectric) sector are in particular driven by high water temperatures (figure 4(a)), with higher water scarcity particularly in eastern China, India, US, Europe, and parts of Australia. High salinity (TDS) levels mainly constrain irrigation and manufacturing uses in most regions (figures 4(b) and (c); for 72% and 77% of area for irrigation and manufacturing, respectively). Domestic water scarcity levels increase due to various critical water quality constituents; high organic pollution (BOD concentrations) in particular in eastern Asia, high TN mainly in Europe, and high salinity (TDS) levels mainly in arid regions (e.g. western US) (figure 4(d)). Surface water quality thresholds for ecosystem health are exceeded in particular for BOD (45%) and phosphorous (42%) (figure 4(e)).
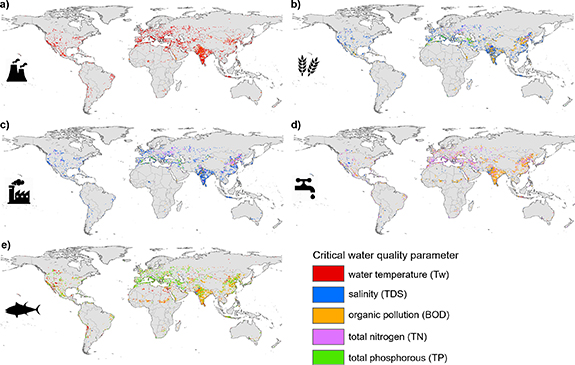
Figure 4. Main critical water quality constituents contributing to water scarcity for human uses and freshwater ecosystems in water scarcity regions. Maps presenting the water quality constituents that contributed strongest to increases in water scarcity for energy (a), irrigation (b), manufacturing (c), domestic uses (d), and freshwater ecosystems (e).
Download figure:
Standard image High-resolution image3.2. Reducing (clean) water scarcity
In a next step, the newly developed water scarcity indicator (WSq_ desal +wwr) was used to calculate the potential expansion in desalination and treated wastewater reuse towards water scarcity alleviation. From a water resource perspective, the population under severe water scarcity (water scarcity levels equal or higher than 0.4) could potentially be reduced from 40% (31%–46%) to 14% (7.0%–16%) under maximum expansions (figure 5(a)). This would require a worldwide increase in desalination capacity from 2.9 to 13.6 billion m3month−1 and an increase in treated wastewater reuse from 1.6 to 4.0 billion m3 month−1. In terms of treated wastewater reuse, the strongest increases are calculated for China and India, which together contribute to 60% of the required expansion in treated wastewater reuse worldwide (figures 5(b) and 6(a), (c)). In these densely populated regions, large amounts of wastewater is produced that could potentially be treated and reused to fulfil the high irrigation water demands in these regions. The highest potential expansion in desalination capacity towards water scarcity mitigation is quantified for the USA, China and India and several European countries contributing to water scarcity reduction for domestic and industrial uses (figures 5(c) and 6(b), (d)). In some regions, such as India, eastern Asia (China), but also parts of the USA, Europe and other regions, these calculated potential expansions in desalination and treated wastewater reuse are still insufficient to meet the sectoral water demands. This is due to limited available wastewater resources that can be treated and reused, a lack of close access to seawater or limited availability of inland surface resources for desalination. While saline or brackish groundwater desalination could potentially be used in some of these regions, it should be noted that this has been disregarded in our analyses.

Figure 5. Impacts of expanding desalination and treated wastewater reuse and required capacity increase towards water scarcity mitigation. Reduction in population under severe water scarcity (a) and required mean expansion in treated wastewater reuse capacity (b) and desalination (c) towards water scarcity mitigation. Circular barplots (b), (c) show results for a selection of 30 countries with highest increase in required total expansion of desalination and treated wastewater capacity towards water scarcity mitigation (in million m3 month−1) and situated in different world regions (NA = North America, SA = South America, EU = Europe, AF = Africa, AS = Asia and Russia, AU = Australia and Oceania).
Download figure:
Standard image High-resolution image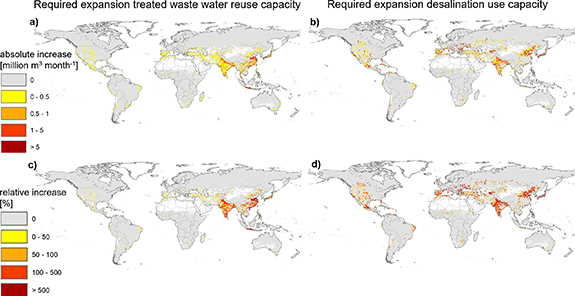
Figure 6. Required potential expansion (absolute and relative increase) in treated wastewater reuse (a), (c) and desalination (b), (d) towards water scarcity mitigation.
Download figure:
Standard image High-resolution image
4. Discussion and conclusions
We developed a new global water scarcity framework including a water quality dimension and the use of fast-growing clean water technologies suiting both water quantity and quality aspects (i.e. desalination and treated wastewater re-use). Our global study shows that water scarcity levels and percentage of people affected by severe water scarcity are substantially higher when we account also for water quality (on average 40%) rather than solely water quantity (30%). Moreover, we show that water scarcity in most hotspots regions (India, China, Middle East, Mediterranean and Mexico) is driven by a combination of water quantity and water quality issues (figure 2). We show that desalinated water use and treated wastewater reuse can potentially strongly reduce the number of people affected by water scarcity (SDG target 6.4), especially in Asia (figures 5 and 6). These results are relevant in terms of defining water investment strategies and water resources exploitation potentials on a longer term (Cobbing and Hiller 2019, Damania et al 2019). For instance, in regions where water scarcity is also strongly driven by water quality, investments in clean water technologies or pollution prevention measures (Damania et al 2019) would be recommended in addition to traditional measures focusing on water supply management (e.g. reservoir construction).
While our global assessment has been limited to a selection of water quality constituents (i.e. water temperature, salinity, organic pollution, total nitrogen and total phosphorous) relevant for various sectoral uses and ecosystem health, our water scarcity framework could potentially be used to add also other water quality constituents (e.g. pathogens, heavy metals, pesticides, pharmaceuticals and other emerging pollutants). This would require to expand the modelling of pollutant loadings and in-stream concentrations as well as the determination of suitable sectoral water quality standards for additional water quality constituents. The presented estimates of water quality impacts on water scarcity levels and number of people under severe water scarcity could then potentially increase, depending on whether sectoral water quality standards for those water quality constituents are exceeded.
It is important to note that our current water scarcity assessment is limited by the lack of global data for groundwater resources availability and water quality. Previous studies have highlighted a major role of groundwater resources availability and changes on water scarcity levels (Döll 2009, Foster and Macdonald 2014, Richey et al 2015, Damkjaer and Taylor 2017). While the focus of our water scarcity assessment is on surface waters and the impacts of surface water quality and water technologies, the water scarcity concept developed in our study has the potential to include groundwater resources. This will provide a more comprehensive understanding of water scarcity, accounting for both surface and groundwater resources from both a water quantity and water quality perspective across different scales. Inclusion of groundwater resources would in particular be important in regions with a relative high contribution of water withdrawals from groundwater resources, such as India (Döll et al 2012, Wada et al 2014b), regions where the quality of groundwater resources is deteriorating (Macdonald et al 2016, Burri et al 2019, Gleeson et al 2020) or where there is a potential for increased sustainable groundwater exploitation, such as in Sub-Saharan Africa (Cobbing and Hiller 2019).
Our estimates of expansion in desalination potential towards water scarcity alleviation should be considered as lower bound estimates, as these do not consider potential increases in desalination from brackish groundwater resources. Our study thus identifies the physical boundaries towards water scarcity mitigation from a surface water resources perspective. Next to this, the technical, socio-economic and environmental constraints (Kümmerer et al 2018) and side-effects of these technologies must also be considered. Desalination and wastewater treatment are both energy intensive technologies, aggravating greenhouse gas emissions if provisioned from fossil fuels (Martin-Gorriz et al 2014), and associated with high economic costs (Parkinson et al 2019). The production of by-products also poses problems. For example, the 15 906 desalination plants considered in our study produce at present 4.3 billion m3month−1 of brine (i.e. hypersaline concentrate), in addition to the 2.9 billion m3 month−1 of freshwater for water scarcity alleviation (Jones et al 2019). Few economically feasible and environmentally sound management strategies exist for the safe disposal of brine. When disposed back to the source (e.g. seawater), increased salinity and toxicity levels in the receiving body can pose major risks to aquatic ecosystems (Gacia et al 2007, Palomar and Losada 2011). Disposal of brine to inland water resources can also paradoxically increase local water scarcity driven by salinity issues, constraining other sectoral water uses and aquatic ecosystems (Meneses et al 2010). Brine production is mainly driven by desalination technology and salinity of feedwater type used, and volumetrically is typically smaller for inland water resources than for desalination of seawater (Jones et al 2019). However, suitable and economically viable brine disposal management options are highly important for expanding desalination of inland water resources (Morillo et al 2014). For wastewater re-use, health concerns and public perceptions are also potential constraints, particularly for the domestic and irrigation sectors (WWAP 2017). Improvements in treatment technologies, coupling with renewable energy sources and resource recovery of 'waste' products provide opportunities for reducing the costs and environmental concerns associated with these technologies.
Achieving 'clean water for all' and 'reducing the number of people suffering from water scarcity', as advocated by SDG6, requires that we expand our focus from solely water quantity solutions (e.g. increasing water use efficiencies and reservoir storage), to measures that contribute to both water quantity and water quality improvements. Moreover, water quality improvements and water scarcity reduction should be sustainable without compromising environmental objectives. In addition to the 'hard infrastructure' clean water technologies, a strong focus on reducing the pollutant emissions (Kümmerer et al 2018) is also paramount in meeting the sustainable management of clean and sufficient water for all.
Acknowledgments
Dr Michelle van Vliet was financially supported by a VENI-grant (project no. 863.14.008) of NWO. The Global Environment Monitoring System is kindly acknowledged for supplying observed water quality data worldwide for global water quality model validation purpose. Dr Arthur Beusen is kindly acknowledged for sharing source code for the IMAGE-GNM global nutrient model.
Data availability statement
The data that support the findings of this study are available upon reasonable request from the authors.
Author contributions
MTHvV developed the study, performed the analyses and drafted the manuscript. EJ contributed to the implementation of desalination and wastewater reuse in the water scarcity assessment. WF, MF, NH, YW produced the global hydrological model results. WF and JRY contributed to the global water quality model development. All authors contributed to the manuscript.