

Abstract
When urban areas expand without concomitant increases in wastewater treatment capacity, vast quantities of wastewater are released to surface waters with little or no treatment. Downstream of many urban areas are large areas of irrigated croplands reliant on these same surface water sources. Case studies document the widespread use of untreated wastewater in irrigated agriculture, but due to the practical and political challenges of conducting a true census of this practice, its global extent is not well known except where reuse has been planned. This study used GIS-based modeling methods to develop the first spatially-explicit estimate of the global extent of irrigated croplands influenced by urban wastewater flows, including indirect wastewater use. These croplands were further classified by their likelihood of using poor quality water based on the spatial proximity of croplands to urban areas, urban wastewater return flow ratios, and proportion of wastewater treated. This study found that 65% (35.9 Mha) of downstream irrigated croplands were located in catchments with high levels of dependence on urban wastewater flows. These same catchments were home to 1.37 billion urban residents. Of these croplands, 29.3 Mha were located in countries with low levels of wastewater treatment and home to 885 million urban residents. These figures provide insight into the key role that water reuse plays in meeting the water and food needs of people around the world, and the need to invest in wastewater treatment to protect public health.
Export citation and abstract BibTeX RIS

Original content from this work may be used under the terms of the Creative Commons Attribution 3.0 licence.
Any further distribution of this work must maintain attribution to the author(s) and the title of the work, journal citation and DOI.
1. Introduction
Despite significant investments in wastewater treatment infrastructure, levels of treatment in rapidly urbanizing, low-income urban areas are not keeping pace with population growth [1, 2]. Globally, less than 10% of collected wastewater receives any form of treatment [3, 4]. Concomitantly, agriculture is the largest water user in most countries, representing 70% of total global water withdrawals [5]. The reuse of untreated wastewater return flows in irrigated agriculture is commonplace downstream of urban areas [6]. As upstream regions have urbanized, surface water sources have become effluent dominated, resulting in widespread indirect or de facto water reuse [7]. In other instances, farmers deliberately extract water from drains or sewage pipes [8]. In these cases, regional water scarcity and/or readily available access to wastewater are primary motivations. Wastewater provides a consistent, reliable source of water where other sources do not exist [9].
The use of wastewater (both treated and untreated) in irrigated agriculture has been documented in more than sixty countries, though the true scale of the practice is likely underestimated [10, 11]. Using government reported statistics and case studies, Jiménez and Asano estimated that, globally, upwards of 4.5 Mha of croplands were irrigated with wastewater [12]. Their estimate does not capture the reuse of diluted, untreated wastewater downstream of urban areas [11]. A global projection by Scott et al estimated that 20 Mha of croplands were irrigated with raw, diluted, or partially treated wastewater. This widely cited number is an estimate based on expert opinion rather than on a spatially-explicit analysis [10]. Although numerous case studies indicate that irrigation with raw, diluted, or partially treated wastewater is widespread, the true extent of irrigation with untreated wastewater remains a knowledge gap.
Van der Hoek identified a key challenge in quantifying the extent of agricultural water reuse: the ambiguity of the term wastewater irrigation [10]. Most of what is documented is the direct reuse of wastewater, defined as the practice of using wastewater from sewers or wastewater treatment plants to irrigate crops without intermediate discharge to a receiving waterbody [12]. However, the majority of agricultural water reuse globally is the indirect or de facto reuse that occurs when wastewater is a dominant component of available surface water flows. Effluent from wastewater treatment plants can constitute a major portion of available surface water downstream of urban areas [13]. Consequently, alternate water reuse strategies such as industrial or domestic reuse or spatial redistribution of wastewater return flows, can have significant impacts on downstream farmers reliant on these urban wastewater return flows [14].
The use of wastewater in irrigated agriculture is often economically motivated. The reliability of wastewater flows can allow farmers to cultivate higher value, more water intensive vegetable crops than they could in the absence of the wastewater source [15–17]. Ensink et al documented that farmers in Pakistan were willing to pay more for wastewater than canal water because the nutrients in wastewater allowed them to reduce expenditures on fertilizers [18]. Similarly, farmers in Mexico protested the construction of a wastewater treatment plant, fearing that the facility would reduce concentrations of nutrients relative to the existing untreated wastewater [19]. Despite these benefits, the use of untreated wastewater can pose substantial health risks to those cultivating, selling, and consuming these agricultural products [20, 21].
Anecdotal evidence and case studies suggest that where treatment is lacking or insufficient, irrigation with untreated wastewater is a long-standing and widespread practice. However, its true extent, and therefore the magnitude of its risks, costs, and benefits remain largely unknown [6, 8]. Understanding the scale of wastewater reuse in irrigated agriculture is essential for garnering the attention of policy makers and sanitation practitioners such that infrastructure is selected in a manner sensitive to downstream water quality and quantity, public health, and the livelihoods of farmers reliant on wastewater for irrigation.
The objective of this study was to develop a globally consistent, spatially-explicit estimate of the global extent and distribution of the indirect reuse of wastewater in irrigated agriculture. In particular, we sought to identify irrigated croplands where wastewater constitutes a large proportion of available surface water and the subset of croplands likely to be irrigated with water with high levels of fecal contamination. A land use focused methodology was developed to understand the spatial relationships between upstream wastewater discharges (both treated and untreated) and downstream agricultural water users.
2. Methods
2.1. Classification overview and major data sources
A GIS-based algorithm was developed to classify irrigated croplands as a function of hydrologic connectivity between irrigated croplands and nearby urban extents, wastewater return flows, and regional levels of wastewater treatment. These methods were developed to quantify indirect reuse, but areas of direct reuse were also quantified when intersecting a stream channel. The two main outcomes were identifying: (1) the global extent of wastewater dependent irrigated croplands and (2) the subset of those croplands with a high likelihood of irrigation with untreated wastewater.
Wastewater dependent croplands were defined as irrigated croplands located within 40 km downstream of an urban area with a population exceeding 50 000 and in a catchment where wastewater constituted at least 20% of available blue water. This second variable (wastewater as a percent of available blue water) is analogous to urban wastewater return flows (i.e. the volume of water returned to surface water bodies following use, divided by available blue water in the catchment). This usage is distinct from other common return flow ratio metrics focused on agricultural drainage or similar [14]. Irrigated croplands with a high likelihood of untreated reuse were defined as the subset of wastewater-dependent croplands located in countries where less than 75% of wastewater received some form of treatment (figures 1 and S1 stacks.iop.org/ERL/12/074008/mmedia). Data sources are described in table S1.
2.2. Classification methods
2.2.1. Data pre-processing and identification of downstream irrigated croplands
The focus of this analysis (parts 1 and 2 in figure 1 and S1) was to reduce the MIRCA2000 irrigated croplands data [22] to only include peri-urban irrigated croplands located downstream of urban areas [23]. The maximum monthly irrigated croplands data from MIRCA2000 were limited to those within 40 km of an urban area with a population exceeding 50 000. These data were then overlaid with the stream channel network from the global drainage basin database [24] and all irrigated cropland gridcells not intersecting a stream channel were removed from consideration. On-stream irrigated cropland gridcells were then joined to urban areas and compared on the basis of their relative flow accumulation and position in the stream network (see online supplementary information). The product of this analysis will be referred to as downstream irrigated croplands (DSIC) for the remainder of this paper.
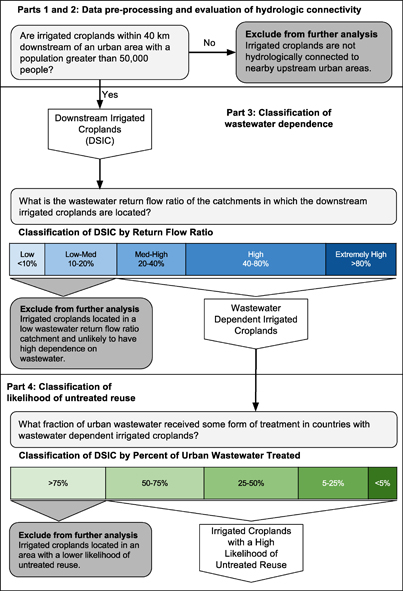
Figure 1 Overview of irrigated croplands classification logic.
Download figure:
Standard image High-resolution imageTwo primary rationales were used in selecting a population threshold of 50 000. Review of the International Utility Benchmarking Network (IBNET) data [25] showed that sewerage and wastewater treatment were uncommon in low and middle income cities of less than 50 000 people. We previously found that a population threshold of 50 000 reached a reasonable balance between overestimating croplands occurring around small towns and omitting larger towns with urban croplands [26]. A maximum distance threshold of 40 km from urban areas was selected based on the review of water quality data downstream of urban areas with low levels of wastewater treatment [27–30], with the intent to select a distance likely to be sufficient to reduce fecal contamination to the low levels required to reduce health risks to farmers and consumers of raw produce to acceptable levels [31, 32]. Additional analyses using thresholds of 10 and 20 km were also conducted to test the sensitivity of the results to this assumption.
2.2.2. Classification of DSIC by wastewater return flow ratio
The DSIC identified in the previous step were classified using catchment wastewater return flow ratio (RFR) to develop a measure of the relative dependence of DSIC on upstream wastewater flows (figure 1, part 3). The RFR of a catchment measures upstream urban wastewater discharges as a fraction of available blue water. RFR was used in this analysis as an indicator of the contribution of urban wastewater flows to downstream water availability. We used the catchment-scale RFR developed through the AQUEDUCT database, which was developed based on FAO's AQUASTAT database and global hydrologic modeling efforts [33, 34].
2.2.3. Classification of DSIC by percent of urban wastewater treated
DSIC in high RFR catchments were further classified to estimate their likelihood of using untreated or partially treated wastewater for irrigated agriculture (figure 1, part 4). The best data currently available on urban wastewater collection and treatment are the compilations by Baum et al [35], the Environmental Performance Index (EPI) [36], and Sato et al [37]. All three rely heavily on the FAO AQUASTAT database and/or Joint Monitoring Program Country reports [34]. IBNET data record information on sewerage and wastewater treatment reported by municipal utilities around the world, but only include a small subset of cities within participating countries [25]. After reviewing these datasets, we decided to integrate the three national level datasets to minimize data gaps (figure S2, methods in the online supplementary information). Given that this study is not modeling concentrations of pathogens or health risk, but the likelihood of untreated reuse, the broader availability of national level data motivated their use. The outcome of this step was the classification of DSIC by their relative likelihood of untreated wastewater reuse.
2.3. Additional data analysis
2.3.1. Downstream irrigated croplands by geographic region and distance downstream of urban areas
For each country, the sum of the DSIC area was divided by the total area of irrigated croplands to estimate the fraction of irrigated croplands located downstream of large urban areas. The area of DSIC was also summed by catchment then divided by total catchment area to assess the fraction of the catchment land area allocated to DSIC. The methods described in sections 2.2–3 were repeated using 10 and 20 km buffers around urban areas to quantify the variation in the extent and distribution of DSIC 10, 20, and 40 km downstream of urban areas.
2.3.2. Urban population living in wastewater dependent catchments and catchments with a high likelihood of untreated agricultural water reuse
GRUMP urban area boundaries [23] with populations exceeding 50 000 people were intersected with GDBD catchment boundaries. The urban population densities associated with these urban areas [38] were then used to estimate the urban population within each catchment with DSIC. These values were then cross-tabulated against each of the different wastewater dependence and treatment classes.
2.3.3. Comparison of catchment area, DSIC, and population across wastewater treatment classes
The total catchment area (global non-polar land surface area), area of catchments containing DSIC, DSIC area, and population living in catchments with DSIC were summed for each wastewater dependence and treatment class for between class comparisons.
2.4. Validation
Estimates of overall accuracy and Kappa coefficients were used to validate the classification methods used to identify downstream irrigated croplands (2.2.1.) and irrigated croplands with a high likelihood of untreated wastewater reuse (2.2–3). An assessment of the available blue water and consumptive use data used to calculate return flow ratio in the AQUEDUCT database is included in Gassert et al [33]. See SI for additional details and confusion matrices.
To validate the DSIC classification algorithm, 400 irrigated cropland gridcells were randomly selected. Of these, 50% had been classified as DSIC and 50% had not. The validation gridcells were compared to the DEM, hydrography, and urban area GIS layers to evaluate whether the automated classification algorithm correctly differentiated downstream irrigated cropland pixels.
The UNGEMS water quality data on riverine fecal coliform concentrations [39] were used to validate the sub-classification of wastewater dependent irrigated croplands into those with a high or low likelihood of untreated reuse. Since the objective of this task was validation of the classification of the untreated reuse likelihood of DSIC, the UNGEMS data were pared down to only include monitoring stations that intersected DSIC and had multiple measures of fecal coliform from the year 2001 onwards (n = 63 stations). These stations covered eleven countries and more than 8858 fecal coliform measurements. DSIC classified as having a 'high likelihood of untreated reuse' and for which the mean observed fecal coliform concentrations exceeded 1000 CFU/100 ml were considered to be in agreement. Likewise, DSIC where observed fecal coliform concentrations were less than 1000 CFU/100 ml and classified as 'not having a high likelihood of untreated reuse' were also considered to be in agreement. A fecal coliform concentration of 1000 CFU/100 ml was selected based on its common usage as a threshold for irrigation water quality [20, 40, 41].
3. Results
3.1. Extent of peri-urban croplands downstream of urban areas
55.1 Mha of irrigated croplands were located within 40 km downstream of or within an urban area. This area of DSIC constitutes approximately 26% of the global irrigated croplands identified by Portmann et al [42]. The mean percentage of DSIC across all countries was 23% (figure 2). Countries with high percentages of DSIC covered diverse hydrologic and socioeconomic conditions, including small island states/territories (mostly urban irrigated croplands), some European countries, and low to middle income countries with large urban areas (figure 2).
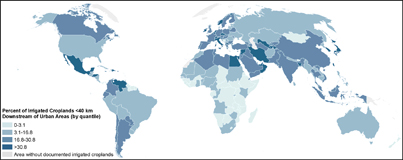
Figure 2 Irrigated croplands located within 40 km downstream of an urban area as a percent of all irrigated croplands in each country.
Download figure:
Standard image High-resolution image3.2. Wastewater dependence of downstream irrigated croplands as a function of urban wastewater return flow ratio
65% of DSIC (35.9 Mha) were located in catchments where the RFR exceeded 20% (figures 3 and 4). 22.4 Mha (41%) of DSIC were located in catchments where wastewater return flows constituted the majority of available blue water (>50%), while 15.7 Mha (28%) were located in catchments where the RFR exceeded 80%—indicating that wastewater constituted an extremely high proportion of available surface water. Catchments with high values for these indicators were clustered around northern India, northern China, and Pakistan.

Figure 3 Catchments classified by RFR and fraction of catchment area that was DSIC. Catchments with moderate to high RFR (20%–80%) are indicated with blue (20–<50%) or yellow (50%–80%) hatching, while red hatching indicates a RFR exceeding 80%. Darker gray shading indicates catchments where DSIC constituted more than 25% of the catchment land area. DSIC in dark gray catchments with high RFR (hatched) are likely to have a very high dependence on wastewater for irrigation.
Download figure:
Standard image High-resolution image
Figure 4 (a) Distribution of downstream irrigated cropland area (55.1 Mha) by RFR and wastewater treatment classes. (b) Area of irrigated croplands by class. Globally, there are approximately 214.2 Mha of irrigated croplands [42].
Download figure:
Standard image High-resolution imageIn many of these catchments, particularly those with monsoonal climates, surface runoff varies considerably between seasons, creating substantial seasonal variability in water availability. During low-flow periods, the RFR of catchments may be considerably higher than indicated here. 26.2 Mha (48%) of DSIC were located in a catchment with high seasonal variability in available water. Figure S3 shows catchments classified by both RFR and seasonal variability.
The distribution of DSIC across RFR classes was markedly different than the distribution of the land area of all catchments or catchments containing DSIC (figure S4). DSIC were disproportionately located in catchments with a RFR exceeding 20% (65% of DSIC) as compared to both the distribution of the land area of all catchments (14%) and the area of catchments with DSIC (30%). Urban populations residing in catchments with DSIC followed a similar distribution. 1.37 billion urban residents lived in catchments containing DSIC and a RFR exceeding 20% while 488 million people resided in catchments with extremely high wastewater dependence (RFR≥80%).
3.3. Distribution of wastewater dependent downstream irrigated croplands by level of urban wastewater treatment
In regions with low levels of wastewater treatment, DSIC were disproportionately located in catchments with high, and in many cases, extremely high levels of wastewater dependence (figure 4). 45.1 Mha (82%) of DSIC were located in a country where less than 75% of wastewater received some form of treatment (figure 4). Of these croplands, 29.3 Mha (65%) were located in a wastewater dependent catchment (RFR ≥ 20%). This subset of wastewater dependent croplands (29.3 Mha) will be referred to as irrigated croplands with a high likelihood of untreated wastewater reuse. 885 million urban residents lived in catchments with a high likelihood of untreated wastewater reuse in irrigated agriculture. 14.7 million urban residents and 2.9 Mha of DSIC were present in catchments where the RFR exceeded 80% and less than 5% of wastewater was treated Including total catchment populations, not just urban populations, would further increase the potentially affected populations.
3.4. Regional distribution of downstream irrigated croplands between wastewater dependent catchments and those with a high likelihood of untreated reuse
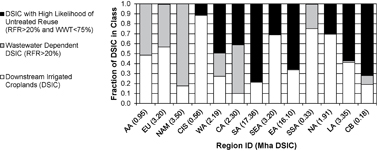
There was considerable variation in the spatial distribution of irrigated croplands with a high likelihood of untreated reuse across different countries and regions (figures 5 and S5–7; table S3). Five countries, China, India, Mexico, Pakistan, and Iran, accounted for 25.1 Mha (85.7%) of DSIC with a high likelihood of untreated reuse (table S2). 42% of wastewater dependent irrigated croplands were located in countries where less than 25% of wastewater was treated. The mean level of wastewater treatment across all countries/territories was 23.8% with a median of 18.6%. The United States contained large areas of wastewater dependent DSIC (2.8 Mha), but, because most wastewater was treated, these DSIC were unlikely to have a high likelihood of untreated reuse.
Figure 5 Regional distribution of downstream irrigated croplands by wastewater dependence and untreated reuse classification. Regional groupings and abbreviations are: Commonwealth of Independent States (CIS), Caribbean (CB), Latin America (LA), Oceania (OC), East Asia (EA), Southeast Asia (SEA), South Asia (SA), West Asia (WA), Central Asia (CA), North Africa (NA), Sub-Saharan Africa (SSA), and high income countries—Asia/Australia (AA), Europe (EU), and North America (NAM).
Download figure:
Standard image High-resolution image
3.5. Distribution of wastewater dependent downstream irrigated croplands by distance downstream
The analyses presented above (40 km limit) were repeated for downstream distances of 10 and 20 km (figure S8). 26.8 Mha of DSIC were within 10 km, 5.7 Mha were within 10 to 20 km, and 3.4 Mha were within 20 to 40 km of urban areas. Wastewater dependent DSIC within most regions followed a similar pattern. In Southeast Asia, North Africa, and Sub-Saharan Africa 92%, 98%, and 99% of DSIC, respectively, were located within 10 km of urban areas. South Asia was a notable exception, with the majority (56%) of DSIC located 10 to 40 km downstream of urban areas.
3.6. Validation of classification methods
When data were available to do so, classification methods were independently validated for classification accuracy and inter-rater agreement (Cohen's kappa) (tables 1, S4, and S5). Some initial assumptions were made following a critical review of the literature and/or available data. In those instances, the impact of different threshold values on study results was examined (figures 4 and S8). Further details on the validation methods, confusion matrices, and critical reviews are included in the online supplementary information (tables S4–S5).
Table 1. Summary of assumptions, and methods used for review and validation.
| Analysis or assumption | Validation method/metric | Validation data/review | Results | Interpretation |
|---|---|---|---|---|
| Identification of downstream irrigated croplands | Assessment of classification accuracy (overall accuracy +kappa) | Manual review of hydrography, urban land cover data, flow accumulation and flow direction rasters relative to irrigated cropland location | Overall accuracy: 0.96 Kappa: 0.92 | DSIC classification algorithm is effectively classifying DSIC. |
| Irrigated croplands within 40 km downstream of an urban area have a higher likelihood of using surface water sources whose quantity and/or quality has been influenced by municipal wastewater discharges | Sensitivity analysis + critical review | DSIC and 'high likelihood of untreated reuse' DSIC within 10, 20, and 40 km of urban areas | Wastewater dependent DSIC within 10 km or urban area: 26.8 Mha (74.6%) High likelihood DSIC within 10 km of urban areas: 21.3 Mha (72.7%) | While a threshold of 40 km downstream was used, most wastewater dependent irrigated croplands were located within 10 km of urban areas |
| National level data on wastewater treatment as a proxy for high/low level of wastewater treatment | Critical review | Review of utility level data from IBNET relative to national data on wastewater data | Treatment of the full effluent volume and/or treatment to at least a secondary level was uncommon in low and middle income countries. | National statistics generally overestimate the true level of treatment from a water quality perspective. |
| Catchment return flow ratio |
Assessment of classification accuracy (overall accuracy + Kappa) | Comparison of untreated reuse classification algorithm results to WHO fecal coliform threshold for the use of wastewater in irrigated agriculture (1000 CFU/100 ml) (data from UNGEMS) | Overall accuracy: 0.86 Kappa: 0.69 | Classification algorithm is effectively differentiating irrigated croplands with a high vs. low likelihood of dependence on untreated wastewater |
aAssessment of input data used to estimate RFR (available blue water and consumptive use) was included in [33].
4. Discussion
4.1. Interpretation of findings
Lack of a comprehensive, spatially-explicit global estimate of wastewater reuse in irrigated agriculture was a primary motivation for this study. Quantifying indirect reuse has proven particularly challenging for previous studies as it often occurs as an unplanned or de facto practice downstream of urban areas with wastewater discharges. In this assessment, our methods primarily captured indirect reuse and instances of direct reuse occurring in close proximity to stream channels.
We used a spatially based decision tree approach to integrate disparate datasets on irrigated croplands, hydrography, water use, wastewater collection and treatment. Starting with a base of all irrigated croplands (identified via MIRCA2000), we identified 35.9 Mha of DSIC in wastewater dependent catchments, of which 29.3 Mha were located in countries with low levels of wastewater treatment (figure 4). Reuse of untreated wastewater appears to be the most common form of agricultural water reuse, but it is generally poorly accounted for under traditional water accounting and management approaches.
A major challenge in both this analysis and global monitoring efforts more broadly is the lack of municipal level data on the level of wastewater treatment and proportion of flows treated. However, even when data are available, they often do not reflect the true operational status of wastewater treatment plants that may be present [43]. This paucity of data motivated our use of national level data on urban wastewater treatment. Even at the national scale, previous researchers have identified major data gaps in the quantification of the proportion and quantity of wastewater receiving some form of treatment [35–37]. While comprehensive higher resolution data would obviously provide more accurate local estimates, we believe that the uncertainty introduced by using national level data resulted in conservative national and global estimates. Municipal-level estimates of wastewater treatment in the IBNET data tended to be lower than national estimates across all city size classes suggesting that our values present a conservative estimate of the fraction of untreated wastewater entering surface water irrigation sources. Where data on wastewater treatment were present in the IBNET data, secondary treatment was uncommon, further supporting the assumption that the national values are quite conservative and likely overestimate the true level of wastewater treatment.
The reuse of wastewater in agriculture can present health risks when upstream wastewater flows are inadequately treated. The use of poor quality water in irrigated agriculture has the potential to impact farmers, laborers, market vendors, and consumers across the produce supply chain. However, the level to which these risks are realized depends upon irrigation and cultivation practices, crop type, post-harvest handling, food safety and preparation practices (e.g. raw versus cooked) [20, 44, 45]. While our study does not address the crop types being grown in downstream irrigated croplands, past studies suggest that, particularly in low and middle income countries, vegetable crops are grown more often in these regions than in rural areas [46].
Even when wastewater flows are treated, upstream wastewater return flows are generally not subject to traditional water rights apportionments, potentially leaving farmers vulnerable to municipal reallocation of wastewater flows for other types of water reuse (e.g. industrial, indirect potable, etc), alteration of flow timing, and overall reductions in flows resulting from water conservation efforts [14, 47, 48]. We found that 65% of DSIC were located in a catchment with high levels of dependence on urban wastewater flows. These same catchments were home to 1.37 billion urban residents of whom 885 million lived in areas where less than 75% of wastewater is treated. These figures highlight the role of indirect wastewater reuse in meeting the water and food needs of people around the world.
4.2. Comparison to previous assessments of water reuse in irrigated agriculture
The top five country level estimates of wastewater dependent irrigated croplands likely to be practicing untreated reuse identified in this study were compared in table 2 to the national areas of wastewater reuse identified in Annex 2 of Jiménez and Asano [12], which is the most comprehensive estimate of agricultural reuse area prior to our study. While the overall trends in both studies were similar, the areas of irrigated croplands (likely to be practicing untreated reuse) identified by our study were much larger than those enumerated by Jiménez and Asano. Both studies were in agreement that China was the nation with the largest area of wastewater irrigation (table 2). However, we found an irrigated area eight times greater than those captured through the surveys and government statistics used by Jiménez and Asano.
Table 2. Comparison of areas of agricultural water reuse identified in this study as compared to the areas included in the inventory compiled by Jiménez and Asano [12]. Countries included are those with the five largest areas of likely untreated reuse.
| From this study | From Jiménez and Asano [12] | ∑ WW dependent irrigated croplands (this study) | |||||
|---|---|---|---|---|---|---|---|
| Country | Urban WW treatment (%) | ∑ DSIC with a high likelihood of untreated reuse (RFR >20% and WWT ≤75%) (ha) | Irrigated with WW (ha) | Irrigated with treated WW (ha) | Type of wastewater irrigation described in Jiménez and Asano | Original sources | ∑ Area irrigated with WW (untreated + treated) (Jiménez and Asano) |
| China | 71.2 | 10.4 × 10⁶ | 1.3 × 10⁶ |
0+ | Unclear (discussion focused on direct, municipal reuse, but text indicates indirect reuse common) | WRIS | 8.0 |
| India | 22.0 | 8.9 × 10⁶ | 73 000 | ND | Direct, untreated (data from 1985 inventory of 200 sewage farms) | WRIS; AAST, 2004; EPA, 2004 | 122 |
| Pakistan | 1.2 | 2.9 × 10⁶ | 32 500 | ND | Direct, treated (partially) | WRIS; EPA, 2004 | 88 |
| Mexico | 53.9 | 1.5 × 10⁶ | 190 000 | 70 000 | Direct and some indirect, treated and untreated | Jimenez, 2006; WRIS | 5.6 |
| Iran | 4.2 | 1.4 × 10⁶ | + |
+ |
Unclear | WRIS; AAST, 2004; EPA, 2004; Jimenez, 2006 | ND |
aJiménez and Asano indicate 'Data are confusing'. bJiménez and Asano indicate 'No data are available, although the practice is reported'
Two reasons the reuse of untreated wastewater has been so difficult to account for are that unplanned practices are difficult to quantify via census based methods and the obfuscation of accurate data about this practice for political or economic reasons [12]. These factors, plus our focus on indirect reuse, were the likely reasons we identified larger areas.
4.3. Limitations
The spatial resolution of the irrigated croplands data (9.2 km) is a central consideration when interpreting results. The irrigated croplands captured in the source data (MIRCA2000) tend to be large, contiguous areas [49]. Small, disconnected urban and peri-urban plots would generally not be captured, though these plots can be using the poorest quality water (e.g. irrigating directly from sewers) [8, 50, 51] and can make substantial contributions to the production of food calories [52].
This study focused primarily on catchments where the wastewater RFR exceeded 20%. However, in catchments with high seasonal variability in water availability, wastewater return flows may constitute a significantly larger or smaller proportion of available water at different times of year. When considering health risks associated with the use of untreated wastewater or poor quality water for irrigation, even a wastewater RFR of a few percent could be enough to cause concentrations of waterborne pathogens in surface water sources to exceed WHO thresholds for acceptable risk [40]. The RFR and urban area population thresholds adopted here were purposely conservative. These results likely represent lower limits of both the area of wastewater dependent irrigated croplands and irrigated croplands with a high likelihood of untreated reuse.
In-stream concentrations of waterborne pathogens will vary spatially and temporally with a wide range of variables, including levels of exposure to solar radiation, flow velocities, association with settleable materials, and influent pathogen concentrations [53]. Given the range of factors potentially confounding predictions of waterborne pathogens downstream of urban areas, we instead opted for a land-use centric approach, focused on irrigated croplands and classification of watershed characteristics indicative of dependence on urban wastewater flows and untreated wastewater. In this analysis, we utilized downstream distance thresholds of 10, 20, and 40 km. Previous research has shown a strong association between watershed land use composition and waterborne pathogen concentrations across diverse contexts [54–57]. Large strides have been made recently in global water quality models, but their resolution is still coarse (0.5 degrees) [58–60] or their coverage not global [61]. They are thus limited in their applicability to the typologies of agricultural water reuse investigated here.
Given these limitations, our results are most appropriately interpreted at the national to regional scales to identify areas with a high likelihood of wastewater dependence or untreated reuse. More detailed studies accounting for wastewater treatment infrastructure, flows, and water allocation at the basin scale are needed to better understand the extent of health risks and vulnerability posed by indirect water reuse at finer spatial resolutions and for specific stakeholder groups. For studies focused on specific catchments or agricultural activities downstream of urban areas, watershed scale models and assessments are more appropriate tools for evaluating the risks experienced by farmers and consumers.
5. Conclusion
Our analysis provides the first spatially-explicit global estimates of the extent to which irrigated croplands are influenced by wastewater, both treated and untreated, finding 35.9 Mha of irrigated croplands located in wastewater dependent catchments (RFR ≥ 20%), of which 82% (29.3 Mha) are located in countries where less than 75% of wastewater is treated. 86% of these irrigated croplands were located in five countries: China, India, Pakistan, Mexico, and Iran.
Our work found that the scale of the practice of wastewater irrigation is at least 50% larger than previous, highly uncertain estimates (4.5 to 20 Mha) extrapolated from case studies and government statistics. This study is also the first to develop methods explicitly including indirect reuse in its estimates of agricultural water reuse. Urban wastewater return flows and other non-consumptive uses are often poorly accounted for in large-scale water resources models, but clearly make major contributions to farmers dependent on surface water for irrigation.
Considerable strides have been made in increasing access to improved sanitation in urban areas, but for achieving the Sustainable Development Goal (SDG) 6, further significant investments in wastewater treatment are needed. Even when untreated wastewater constitutes a small percentage of flow, concentrations of pathogens in irrigation source water can far exceed those recommended in WHO guidelines. This study sheds further light on the often complicated ways in which urban areas impact agricultural water quality in downstream peri-urban and rural environments. Further work is needed to ensure that urban sanitation policies not only address the protection of surface water quality for ecological reasons, but also recognize the water quantity and quality needs of downstream farmers.
Acknowledgments
Research support was provided through grants from the USAID Collaborative Research-CGIAR Linkage Fund (Award no. 4500012834), Stanford UPS Endowment (Grant no. 1139780), CGIAR Research Program on Water, Land and Ecosystems (WLE), and STAR Fellowship Assistance Agreement no. 91750501-0 awarded by the US Environmental Protection Agency (EPA). The authors thank J. Mateo-Sagasta (IWMI) for his constructive comments on an earlier version of this manuscript. It has not been formally reviewed by EPA. The views expressed in this publication are solely those of the authors, and EPA does not endorse any products or commercial services mentioned in this publication.