

Abstract
Long-term exposure to ambient particulate matter (PM2.5, mass of particles with an aerodynamic dry diameter of < 2.5 μm) is a major risk factor to the global burden of disease. Previous studies have focussed on present day or future health burdens attributed to ambient PM2.5. Few studies have estimated changes in PM2.5 and attributable health burdens over the last few decades, a period where air quality has changed rapidly. Here we used the HadGEM3-UKCA coupled chemistry-climate model, integrated exposure-response relationships, demographic and background disease data to provide the first estimate of the changes in global and regional ambient PM2.5 concentrations and attributable health burdens over the period 1960 to 2009. Over this period, global mean population-weighted PM2.5 concentrations increased by 38%, dominated by increases in China and India. Global attributable deaths increased by 89% to 124% over the period 1960 to 2009, dominated by large increases in China and India. Population growth and ageing contributed mostly to the increases in attributable deaths in China and India, highlighting the importance of demographic trends. In contrast, decreasing PM2.5 concentrations and background disease dominated the reduction in attributable health burden in Europe and the United States. Our results shed light on how future projected trends in demographics and uncertainty in the exposure–response relationship may provide challenges for future air quality policy in Asia.
Export citation and abstract BibTeX RIS

Original content from this work may be used under the terms of the Creative Commons Attribution 3.0 licence.
Any further distribution of this work must maintain attribution to the author(s) and the title of the work, journal citation and DOI.
1. Introduction
Long-term exposure to ambient concentration of particles with an aerodynamic dry diameter of < 2.5 μm (PM2.5) is associated with mortality and morbidity and shortens life expectancy (Dockery et al 1993, Pope and Dockery 2006, Pope et al 1995). It is estimated that ~87% of the global population live in areas exceeding the World Health Organisation's (WHO) air quality guidelines for annual mean ambient PM2.5 (10 μg m−3) (Apte et al 2015). Recent assessments of the Global Burden of Disease (GBD) estimate that exposure to ambient PM2.5 is a major contributing risk factor to regional and global burden of disease (Forouzanfar et al 2016, Forouzanfar et al 2015, Lim et al 2013).
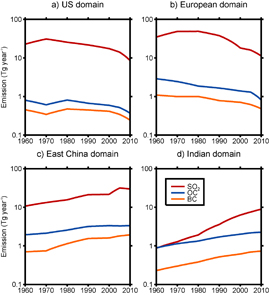
Figure 1. Annual emissions (Tg yr−1) of sulfur dioxide (SO2), organic carbon (OC) and black carbon (BC) from the MACCity emission inventory for the period 1960 to 2010. Regional domains (identified in figure S1) for (a) US (United States), (b) Europe, (c) East China and (d) India.
Download figure:
Standard image High-resolution imagePrevious studies have reported present day and future (Lelieveld et al 2015, Silva et al 2016b) attributable health burdens assessments. Few studies have estimated changes in PM2.5 attributable health burdens over the last few decades (e.g. Wang et al 2017), a period where widespread implementation of air quality regulation and emission controls in North America and Europe coincided with extensive economic growth and limited emission controls across Asia. Over Europe and the United States, emissions of sulphur dioxide (SO2) have decreased by more than 70% over the last few decades (Leibensperger et al 2012, Vestreng et al 2007), resulting in substantial reductions in PM2.5 concentrations (Leibensperger et al 2012, Tørseth et al 2012, Turnock et al 2015). In contrast, SO2 emissions over Asia have increased by a factor of 7 between 1960 and 2005 (Smith et al 2011), resulting in increased PM2.5 concentrations (Brauer et al 2015). Understanding these historical changes in PM2.5 concentrations and attributable burdens across these regions is vital to inform future air quality policy design.
Estimating the health burden attributable to long-term exposure to PM2.5 requires an understanding of the exposure-response relationship, an accurate representation of PM2.5 concentrations and demographic and background disease trends. PM2.5 concentrations can be simulated using global chemical transport models (Anenberg et al 2010, Lelieveld et al 2013, Silva et al 2016a), or through a combination of modelling, satellite remote sensing data, ground-based observations, and land-use regression (Brauer et al 2012, Brauer et al 2015, Jerrett et al 2016, van Donkelaar et al 2010). Global health assessments (Forouzanfar et al 2016, Forouzanfar et al 2015, Lim et al 2013, Wang et al 2017) are restricted to the last few decades (1990 onwards), when satellite and ground-based observations are typically available. For this reason, little is known about how PM2.5 attributable burden changed prior to 1990. Here we combine a global climate model, with exposure-response relationships, demographic and background disease data to provide the first estimate of the changes in global and regional PM2.5 attributable health burdens over the period 1960 to 2009.
2. Methods
2.1. PM2.5 concentrations
We used the coupled chemistry–climate model HadGEM-3-UKCA, known hereafter as 'UKCA', to simulate PM2.5 concentrations for the period 1960 to 2009. We use the same model setup described in detail in Turnock et al (2015) with a horizontal resolution of 1.875° × 1.25° (approximately 140 km at mid latitudes). Meteorological fields were nudged at 6 h intervals to the European Centre for Medium-Range Weather Forecasts Reanalysis (ERA-40) (Uppala et al 2005) for the years 1960 to 2000 and ERA-Interim (Dee et al 2011) for 2001 to 2009.
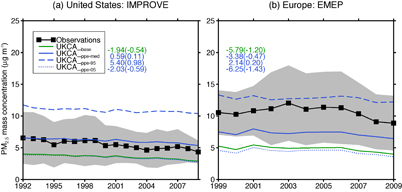
Figure 2. Average annual mean PM2.5 concentrations at (a) IMPROVE sites in the United States and (b) EMEP sites in Europe. Measured concentrations (black line with filled squares, shading represents standard deviation of annual mean concentrations across all sites) are compared to simulated concentrations from the baseline of UKCA (green lines) and UKCA-PPE estimates (blue lines). The mean bias (µg m−3) and normalised mean bias factor (in brackets) for each UKCA simulation is shown on each panel in legend order.
Download figure:
Standard image High-resolution imageUKCA simulates sulfate (SO4), black carbon (BC), organic carbon (OC) and sea salt aerosol in five lognormal modes (four soluble modes and one insoluble Aitken mode) (Mann et al 2010) (see supplementary information (SI) 1.1 available at stacks.iop.org/ERL/12/104017/mmedia). Monthly mean anthropogenic emissions of CO, SO2, NOx, OC and BC from 1960 to 2009 are taken from the MACCity emission inventory (Granier et al 2011). Figure 1 shows the 1960 to 2010 trends in SO2, BC and OC. Emissions in Europe and the United States (US) have declined from a maximum in the 1970s due to the implementation of air quality regulation and emission controls, while emissions have increased substantially in China and India. SO2 emissions in the region of East China in the 2000s were a similar magnitude to US emissions in the 1970s, but less than European emissions during the same period. Other emission sources are described in detail in Turnock et al (2015). Mineral dust concentrations are taken from a 10 year GLOMAP-mode climatology taken from Reddington et al (2015). We therefore assume no interannual variability or trends in dust over the study period. There is no representation of ammonium nitrate in this version of the model.
To account for uncertainty in PM2.5 estimated by UKCA we used a perturbed parameter ensemble (PPE) of 235 UKCA simulations for the year 2008 where 26 aerosol related parameters were perturbed simultaneously. The PPE represents the aerosol parametric uncertainty in the model (see SI 1.3 and figure S2). We use the median value of PM2.5 simulated across the PPE as our best estimate of PM2.5 and the 5th and 95th percentile values as an indication of uncertainty in our estimate. We increment the baseline model (UKCA_base) by the absolute difference in the year 2008 between the baseline and the median (UKCA_ppe-med), 5th (UKCA_ppe-05) and 95th (UKCA_ppe-95) percentile of the PPE (see SI 1.3 and figure S3). We assume that the same increment across the entire 1960 to 2009 simulation period.
We also used satellite-derived PM2.5 estimates (Brauer et al 2015) known hereafter as 'GBD-PM'. This dataset provides annual mean PM2.5 concentrations at 0.1° × 0.1° horizontal resolution for the period 1990 to 2010 at five year intervals. In this dataset, PM2.5 is estimated through a PM2.5 to aerosol optical depth (AOD) relationship using the GEOS-Chem model and satellite remote sensing products calibrated to ground-based measurements (Brauer et al 2015). This dataset was used in the GBD2013 (Forouzanfar et al 2015) and we use it compare with UKCA.
Figure 2 compares simulated PM2.5 against measurements at surface sites in the US and Europe (see figure S1). In the US we use observations from the Interagency Monitoring of Protected Visual Environments (IMPROVE) and in Europe we use observations from the European Monitoring and Evaluation Programme (EMEP) network (see SI 1.2). There are few long-term observations of PM2.5 outside of Europe and the US with which to evaluate UKCA. The baseline UKCA model (UKCA_base) underestimates observed concentrations in both Europe (normalised mean bias factor (NMBF) = −1.2) and the US (NMBF = −0.54). Similarly, Turnock et al (2015) found UKCA underestimated total suspended particles and PM10 observed over Europe using the same model setup. We find that UKCA_ppe-med better matches observations in both Europe (NMBF = −0.47) and the US (NMBF = 0.11), The 5th to 95th percentile of the PPE brackets surface observations in both Europe and the US. We therefore report the results from these three simulations for the rest of the paper.
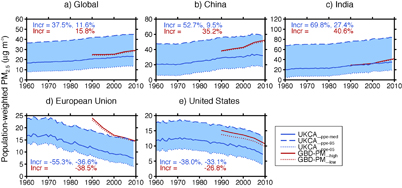
Figure 3. Annual mean population-weighted PM2.5 concentrations for (a) global, (b) China, (c) India, (d) European Union and (e) United States. Regional values are reported for the shaded regions identified in figure S1. Percentage changes are shown for UKCA_ppe-med (Incr = (2009−1960)/1960, (2009−1990)/1990 in blue) and GBD-PM_high (Incr = (2009−1990)/1990 in red).
Download figure:
Standard image High-resolution image2.2. Background disease and demographic data
We used national level population and age group distribution data from the United Nations (UN) Population Division (UN 2015), which are available for the period 1960 to 2010 (see figure S3). We used gridded population from the Gridded Population of the World v3 (GPWv3) (CIESIN 2015), at a resolution of 2.5 arc-minutes for the period 1990 to 2010. We extrapolated the GPWv3 to 1960 applying the rate of change observed in the UN national level data (see SI 1.4).
We used age and cause-specific background disease data for the period 1980 to 2010 from the Institute for Health Metrics and Evaluation (IHME 2014). This dataset provides national level background disease endpoint data for cardiovascular ischemic heart disease (IHD) and stroke (cerebrovascular disease), lung cancer (LungC), chronic obstructive pulmonary disease (COPD) and lower respiratory infections (LRI). Disease data is not available prior to 1980, so we take a conservative assumption and assume that background disease rates remain constant at 1980 levels. In a sensitivity study, we assume that background disease rates between 1960 and 1980 follow the same trend as that between the period 1980 to 1990 (see SI 1.4).
2.3. Attributable health burden calculation
We calculate relative risk (RR) due to long-term exposure to PM2.5 using the integrated exposure-response (IER) relationship (Burnett et al 2014), which compiles epidemiological evidence across a wide range of PM2.5 exposures from different combustion sources. The IER allows for age-dependent (i.e. ≥ 25 years of age at five year intervals to age 80+) calculation of RR for IHD and stroke, adult (≥ 25 years of age) for LC and COPD, and all ages for lower respiratory infections (LRI). We develop a lookup table compatible with the IER used in GBD2013 (Forouzanfar et al 2015) (see SI 1.5). This lookup table is provided in SI data 1. IER relationships are non-linear with respect to PM2.5 exposure (figure S4), with reduced sensitivity of RR to PM2.5 at higher concentrations (Pope et al 2009a, Pope et al 2011), particularly for IHD, stroke and LRI.
We use IER derived RRs to estimate attributable deaths at the grid cell level using attributable fraction type relationship described in Apte et al (2015) (see SI 1.5). Years of lost life (YLLs) are calculated by summing attributable deaths in each age group and multiplying by the associated expected life expectancy taken from the standard life table provide by Murray et al (2013). We estimate attributable deaths using PM2.5 concentrations from UKCA for the period 1960 to 2009 and from GBD-PM for the period 1990 to 2010. We calculated attributable deaths at original resolution of the GBD-PM data (0.1° × 0.1°) (GBD-PM_high) and at the same resolution of UKCA (1.875° × 1.25°) (GBD-PM_low). We find that attributable deaths estimated using GBD-PM closely match GBD2013, within 3%–4% globally, with similar regional mortalities (Forouzanfar et al 2015). We also explored the relative contribution of estimated attributable deaths over the period 1980 to 2009 to changing PM2.5 concentrations, population demographics and background disease (see SI 1.6).

Figure 4. Annual total attributable deaths for (a) global, (b) China, (c) India, (d) European Union and (e) United States. Shaded areas represent upper and lower range of UKCA-PPE estimates (light blue) and GBD-PM (orange). Regional values are reported for the shaded regions identified in figure S1 and use a fixed background disease rate (year 1980) for years prior to 1980. Percentage changes as for figure 3.
Download figure:
Standard image High-resolution image3. Results and discussion
Figure 3 shows annual mean population-weighted PM2.5 concentrations over the period 1960 to 2009. Population-weighted PM2.5 concentrations simulated by the median PPE (UKCA_ppe-med) closely match those from GBD-PM over India but are lower in other regions. We explored whether the coarser spatial resolution of UKCA (1.875° × 1.25°) compared to GBD-PM_high (0.1° × 0.1°) is responsible for this difference. When GBD-PM_high (Brauer et al 2015) is averaged to the same spatial resolution as UKCA (GBD-PM_low), mean population-weighted PM2.5 typically decreased by less than ~4% (~1 µg m−3), showing that lower PM2.5 concentrations simulated by UKCA_ppe-med is not entirely due to the coarse resolution of UKCA. The upper (UKCA_ppe95) and lower (UKCA_ppe05) range of UKCA bracket values from GBD-PM, except over Europe.
During the period 1990 to 2009, global population-weighted PM2.5 concentrations simulated by UKCA_ppe-med increased by 11.6%, smaller than the 15.8% increase estimated by GBD-PM. At the regional scale, UKCA_ppe-med simulated broadly similar fractional changes to GBD-PM in the EU and US, but smaller changes in China and India. During the period 1960 to 2009, global population-weighted PM2.5 simulated by UKCA increased by 37.5%, dominated by large increases in China and India of 52.7% and 69.8%, respectively. In contrast, population-weighted PM2.5 reduced in the EU and US by −55.3% and −38%, respectively. Because of the positive correlation between the spatial distribution of PM2.5 concentrations and population, population-weighted PM2.5 concentrations are higher than the regional average (see figure S8). We find that the ratio of population-weighted to regional average PM2.5 in the EU and US has decreased over the period 1960 to 2009 (1.3 to 1.0 and 2.0 to 1.6, respectively), whereas the ratio has increased in both China and India (1.4 to 1.6 and 1.1 to 1.3, respectively). These changes match those reported previously (Wang et al 2017) and are driven by anthropogenic emission changes (figure 1) and changes in population (figure S5).
Figure 4 shows the estimated attributable deaths over the period 1960 to 2009 (see SI data 2 for all data values). Using PM2.5 concentrations from GBD-PM_high, we estimate 2.6 million global attributable deaths in the year 2009, with a lower and upper uncertainty interval of 1.87 to 3.57 million. Estimated attributable deaths from UKCA_ppe-med are 22.5% lower at 2.0 (1.4 to 2.9) million for the same year, due to lower estimated PM2.5 concentrations. When GBD-PM_high is averaged to the same resolution as UKCA (GBD-PM_low), global attributable deaths are reduced by less than 3%, again demonstrating that the coarse resolution of UKCA is not the dominant reason for the lower global mortality estimate in UKCA_ppe-med. Larger regional differences occur in regions with low PM2.5 concentrations such as the US where estimated attributable deaths from GBD-PM_low are ~10% lower than GBD-PM_high. This greater sensitivity occurs because the IER relationship is non-linear and particularly sensitive to changes in PM2.5 just above the theoretical minimum risk exposure level (TMREL) (~6 µg m−3). This sensitivity also explains the large difference in deaths estimated in UKCA_ppe-med compared to GBD-PM in the EU and US. Estimated attributable deaths from UKCA and GBP-PM are in better agreement over China and India, where higher PM2.5 concentrations are associated with reduced sensitivity in the IER. Attributable deaths estimated using the upper and lower bound of the PPE bracket GBD-PM, showing the contribution of uncertainty in model processes to estimated mortality.
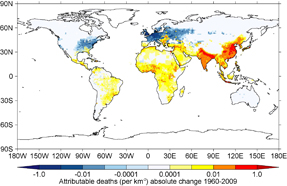
Figure 5. Absolute change in attributable deaths (km−2 yr−1) between 1960 and 2009. Results are shown for UKCA_ppe-med using a fixed background disease rate (year 1980) for years prior to 1980.
Download figure:
Standard image High-resolution image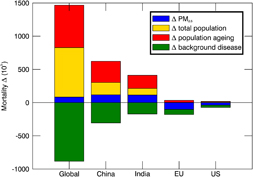
Figure 6. Relative contribution of changes in PM2.5, population growth, population ageing, and background disease endpoint rates to changes in total attributable deaths between 1980 and 2009. Results are shown for UKCA_ppe-med.
Download figure:
Standard image High-resolution imageDuring the period 1990 to 2009, UKCA_ppe-med estimated global deaths increased by 15.6%, similar to the 22% change in GBD-PM. At the regional scale, UKCA_ppe-med simulates broadly similar fractional changes to GBD-PM in both China and India, but only simulates half the fractional change in the EU and US. During the period 1960 to 2009, global attributable deaths increased by an average of 124.4%. If we assume background disease rates prior to 1980 vary, this increase is reduced to 88.5% (see figure S9) because background diseases are comparatively higher in 1960. The percentage increase in attributable deaths is substantially greater than increases in population-weighted PM2.5 concentrations over the same period, owing to the non-linear IER and to increases in population. Our results imply that global attributable deaths are now larger in the present day than at any other point since 1960.
Global increases in attributable deaths were dominated by large increases in China (238%) and India (194%). China and India accounted for 39% of global deaths attributable to PM2.5 in 1960 growing to 55% in 2009. In contrast, attributable deaths reduced in the EU (−65.7%) and US (−47.9%) over this period. The US and EU accounted for 27% of global attributable deaths in 1960 falling to ~1% in 2009. If we assume that background disease rates prior to 1980 vary, attributable deaths in the EU and US peak in early-1970s following that of population-weighted PM2.5 concentrations rather than peaking in early-1980s (see figure S9).
Figure 5 shows the spatial pattern of change in attributable deaths between 1960 and 2009. Large increases in deaths attributable to PM2.5 are simulated in China and India as well as parts of Africa, the Middle East, and Central and South America. In contrast, reductions are simulated across much of Western Europe and North America.
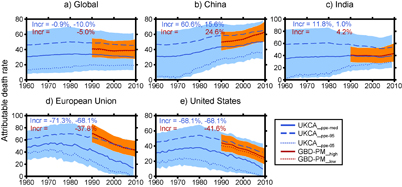
Figure 7. Attributable deaths rate per 100 000 persons for (a) global, (b) China, (c) India, (d) European Union and (e) United States. Shaded areas represent upper and lower range of UKCA-PPE estimates (light blue) and GBD-PM (orange). Regional values are reported for the shaded regions identified in figure S1 and use a fixed background disease rate (year 1980) for years prior to 1980. Percentage changes as for figure 3.
Download figure:
Standard image High-resolution image
Attributable deaths from cardiovascular disease contribute most to total global and regional attributable deaths (see figure S10). Figure 6 explores the relative contribution to changes in attributable deaths for the period 1980 to 2009 (see SI 1.6). Population growth and ageing act to increase attributable deaths, whereas declining background disease acts to reduce attributable deaths. In China and India, population growth and ageing and to a lesser extent increasing PM2.5 concentrations act to increase mortality offset by reductions in background disease rates. In contrast, in the US and EU, reductions in background cardiovascular disease and PM2.5 concentrations offset the contribution from population growth and ageing. Our results imply that air quality regulation and emission controls in Europe and North America are acting to reduce attributable burdens as observed in the US (Correia et al 2013, Pope et al 2009b).
Since the end of our simulation period (year 2009) regional changes in PM2.5 concentrations and population demographics may have occurred. For example in China, population-weighted PM2.5 concentrations stabilised between 2010 and 2015 (Brauer et al 2015, Cohen et al 2017), but attributable deaths continued to increase (Cohen et al 2017, Forouzanfar et al 2016). Our findings suggest that while primary and precursor emissions in China (and other parts of Asia) are likely to decrease over the next few decades (Zhao et al 2013, Zhao et al 2014), attributable deaths are likely to increase in the near future because of projected population growth and ageing (UN 2015). This highlights the need of strict control of PM2.5 in the face of changing demographics.
Figure 7 shows the attributable death rate per 105 of population for the period 1960 to 2009, which removes the influence of population growth. China had the highest attributable death rate in 2009, comparable to the EU in 1960. In contrast to the growth in total global attributable deaths, global attributable death rates reduced (−0.9%) over the period 1960 to 2009, a result of overall decreasing background disease rates and health benefits of cleaner air quality in North America and Western Europe. Decreasing background disease rates played an important role in influencing changes in attributable years of life lost (YLLs). For example, YLLs in India were markedly reduced between 1990 and 2010 (see figure S11) because of declines in infant (<5 yr) attributable mortality from LRI (see figure S10), a result of reduced disease rates (see figure S7), in part due to improved vaccination efforts, poverty alleviation and access to health care (Naghavi et al 2015).
Calculating the uncertainty in our attributable burdens is challenging because there are multiple sources of uncertainty. We have quantified uncertainty using the lower and upper uncertainty bounds in the IER and background disease rates. Applying an exposure-response relationship (IER) based on epidemiological data from North America and Europe to the rest of the world, where lifestyles, age-structures, healthcare systems and PM2.5 composition differ, is a critical source of uncertainty.
The IER neglects PM2.5 particle composition and toxicity, which may be important (Lelieveld et al 2015, Thurston et al 2016, Tuomisto et al 2008). Further research is needed to establish the health implications of particle toxicity and source which may differ for each region.
The shape of the IER remains uncertain, particularly in very clean and polluted regions. We follow the GBD2013 and use a TMREL (~6 µg m−3) below which we assume zero risk. However, there is limited evidence for such a threshold. Additional research to constrain relative risks in very clean regions (Crouse et al 2012, Shi et al 2016, Tomczak et al 2016), where there is a lack of epidemiological data, is needed. Similarly, because of a lack of data, relative risks in polluted regions are based extrapolations from active and passive smoking cohort studies (Pope et al 2009a, Pope et al 2011), leading to uncertainty in the IER at high exposure levels. This is important as the predicted shape of the IER is highly non-linear in polluted settings (figure S4). This implies that polluted regions will display the smallest reductions in relative risk from incremental pollution reduction. Our results suggest that current PM2.5 concentrations in China and India are higher than those experienced in the EU and US during the 1960s and 1970s (figure 3). This suggests that stringent emission controls will be required to reduce population-weighted PM2.5 concentrations and attributable health burdens.
Simulated PM2.5 concentrations are uncertain due to uncertainties in emissions, meteorological input and model processes. We have evaluated our estimated PM2.5 concentrations using available long-term observations in North America and Europe. In regions where long-term observations are not available, we compare against satellite derived PM2.5 data. There is an urgent need for more PM2.5 observations, particularly in polluted and data sparse regions. We used the range of PM2.5 concentrations from the PPE as an indication of the contribution of uncertain model processes, which indicated large uncertainties associated with dry deposition of accumulation mode particles in all regions, and mass flux of small scale residential combustion carbonaceous emissions in Asia (see SI 1.3 and figure S2). This analysis confirms a large contribution of residential emissions to PM2.5 over Asia that has been shown previously (Butt et al 2016, Lelieveld et al 2015). Future research should prioritise constraining these large model uncertainties. UKCA does not include nitrate or anthropogenic secondary organic aerosol formation which may contribute to the underestimation of PM2.5 concentrations. Multi-decadal global simulations of PM2.5 are currently restricted to relatively coarse resolution, as used here. Differences in model spatial resolutions have been found to affect estimated attributable burdens (Ford and Heald 2015, Punger and West 2013, Thompson et al 2014). Although we find small differences between estimates at 0.1° × 0.1° versus the resolution of UKCA (1.875° × 1.25°), further research using higher resolution estimates below 0.1° × 0.1° like those used in Jerrett et al (2016) may provide more realistic personal exposures and thus attributable burdens.
Our estimates are subject to increased uncertainty prior to 1980 where we do not have data on background diseases. We find that varying assumptions about trends in background disease prior to 1980 increases global attributable deaths in 1960 by 16%. Information on historical background diseases trends would improve our attributable burden estimates prior to 1980. Background disease data is also provided at the national level, which does not account for any subnational variability, which may be important (Apte et al 2015, Chowdhury and Dey 2016, Cossman et al 2010). Similarly, we use national level data for different age groups, which is also unrealistic. Future research using subnational background disease and age group distribution data would improve future attributable burden estimates.
4. Conclusions
We used the HadGEM3-UKCA global coupled chemistry–climate model to investigate changes in ambient PM2.5 concentrations and attributable burdens over the period 1960 to 2009. We found that the uncertainty in the model, estimated using a perturbed parameter ensemble of 235 simulations across 26 aerosol parameters, brackets long-term PM2.5 measurements and satellite derived PM2.5 concentrations used in the Global Burden of Disease (GBD) 2013.
We estimate that global population-weighted PM2.5 concentrations increased by 37.5% over the period 1960 to 2009, dominated by increases in China and India, a result of economic expansion and growth in emissions. In contrast, air quality regulation and emission controls in the European Union (EU) and United States (US) has reduced population-weighted PM2.5 concentrations over the same period.
We found that global attributable deaths increased by 89% to 124% over the period 1960 to 2009, much larger than the changes in PM2.5 over the same period. Global changes were dominated by large increases China and India. In contrast, attributable deaths decreased in the EU and US.
Increases in attributable deaths in China and India were dominated by population growth and ageing, and to a lesser extent increasing PM2.5 concentrations. Reduced attributable deaths in the EU and US were driven by reductions in background disease rate and PM2.5 concentrations. Our results suggest that projected changes in demography in China and India will pose challenges as policy makers attempt to reduce attributable deaths in the near future. Our results provide the first estimate of how PM2.5 concentrations and associated health burden has changed over the 1960 to 2009 period. Understanding the reasons for these changes is required to help policy makers craft sound policies to reduce future health impacts.
Acknowledgments
E W Butt would like to thank the United Bank of Carbon and University of Leeds for providing the funding for his PhD studentship. We acknowledge funding from Natural Environment Research Council (NERC) under grants AEROS, ACID-PRUF, GASSP and SAMBBA (NE/G006172/1, NE/I020059/1, NE/J024252/1 and NE/J009822/1). This work used the ARCHER UK National Supercomputing Service (www.archer.ac.uk). ARCHER project allocation n02-FREEPPE and the Leadership Project allocation n02-CCPPE were used to create the PPE. S T Turnock was supported by funding for his PhD studentship from NERC and the UK Met Office Hadley Centre. He also acknowledges use of the MONSooN system, a collaborative facility supplied under the Joint Weather and Climate Research Programme, a strategic partnership between the UK Met Office Hadley Centre and the NERC. L Regayre was funded by a NERC Doctoral Training Grant and a CASE studentship with the UK Met Office Hadley Centre. J S Johnson was funded by the UK-China Research & Innovation Partnership Fund through the Met Office Climate Science for Service Partnership (CSSP) China as part of the Newton Fund. G W Mann was funded by the National Centre for Atmospheric Science.