

Abstract
Global economic development and urbanization during the past two decades have driven the increases in demand of personal and commercial vehicle fleets, especially in developing countries, which has likely resulted in changes in year-to-year vehicle tailpipe emissions associated with aerosols and trace gases. However, long-term trends of impacts of global gasoline and diesel emissions on air quality and human health are not clear. In this study, we employ the Community Earth System Model in conjunction with the newly developed Community Emissions Data System as anthropogenic emission inventory to quantify the long-term trends of impacts of global gasoline and diesel emissions on ambient air quality and human health for the period of 2000–2015. Global gasoline and diesel emissions contributed to regional increases in annual mean surface PM2.5 (particulate matter with aerodynamic diameters ⩽2.5 μm) concentrations by up to 17.5 and 13.7 µg m−3, and surface ozone (O3) concentrations by up to 7.1 and 7.2 ppbv, respectively, for 2000–2015. However, we also found substantial declines of surface PM2.5 and O3 concentrations over Europe, the US, Canada, and China for the same period, which suggested the co-benefits of air quality and human health from improving gasoline and diesel fuel quality and tightening vehicle emissions standards. Globally, we estimate the mean annual total PM2.5- and O3-induced premature deaths are 139 700–170 700 for gasoline and 205 200–309 300 for diesel, with the corresponding years of life lost of 2.74–3.47 and 4.56–6.52 million years, respectively. Diesel and gasoline emissions create health-effect disparities between the developed and developing countries, which are likely to aggravate afterwards.
Export citation and abstract BibTeX RIS
1. Introduction
Global anthropogenic emissions play an essential role in atmospheric chemistry [1, 2], air quality [3–6], climate change [7–9], and human health [10–13]. The gasoline and diesel sectors are of particular interest to the scientific community and local authorities, given the substantial increases in global demand of personal and commercial vehicle fleets (increased by 43.8%) and worldwide petroleum fuels consumption (by 30.1%) during the past two decades [14, 15]. Large consumption of gasoline and diesel fuels leads to significant releases of primary pollutants in the environment, including non-methane volatile organic compounds (NMVOCs), carbon monoxide (CO), black carbon (BC), nitrogen oxides (NOx ), primary organic matter, sulfur dioxide (SO2), and ammonia (NH3) [16, 17]. For instance, on-road gasoline and diesel vehicles emitted 37% of total NOx , 11% of CO, 5% of NH3, and 2% of PM2.5 (particulate matter with aerodynamic diameters ⩽2.5 μm) in California in 2017 [18]. From a global perspective, on-road diesel and gasoline vehicles produced nearly 20% of global anthropogenic emissions of NOx and NMVOCs, respectively [7, 19], which are key ozone (O3) and PM2.5 precursors [20–23]. Diesel vehicles even emit 4–7 times more NOx under real-world operating conditions than during laboratory approval testing [19]. These excess NOx emissions are a factor of 10–40 above the United States (US) Environmental Protection Agency (EPA) standard [17], leading to great concerns for air pollution and human health outcomes.
Gasoline and diesel emissions from the transportation (e.g. on-road light- and heavy-duty vehicles, commercial buses, mopeds and motorcycles, rail and other surface transport), shipping, energy, residential, commercial, and industrial sectors (defined in supplementary table S1) are important sources of global health burden through their contribution to elevated PM2.5, O3, NOx , and NMVOCs concentrations [7, 19, 24, 25]. Epidemiological studies have revealed that long-term exposures to ambient O3 exacerbated respiratory illness, increased hospital admissions, and even caused premature deaths [10, 26]. Apart from posing direct threat to public health, O3 also triggered adverse health outcomes via the heterogeneous oxidation of gaseous precursors of SO2 and NOx , which resulted in a rapid formation of secondary PM (e.g. (NH4)2SO4 and NH4NO3) and the growth of PM2.5 in the air [27]. Globally, several studies have assessed the health burdens attributable to surface transportation sector. For instance, Silva et al [28] reported land transportation sector respectively caused 212 000 (95% confidence interval (95 CI): 114 000–292 000) and 80 900 (95 CI: 17 400–180 000) premature deaths attributable to PM2.5 and O3 exposure in 2005. Lelieveld et al [29] estimated that outdoor air pollution from land traffic emissions was responsible for approximately 165 000 (95 CI: 80 500–240 500) premature deaths in 2010, accounting for 5% of global total mortality. Huang et al [7] determined global annual total PM2.5- and O3-induced premature deaths associated with gasoline and diesel fuel vehicle fleets was 237 100 (95 CI: 147 500–311 100) in 2015. However, global economic development and urbanization during the past two decades have driven increases in personal and commercial vehicle fleets, upgrades in fuel quality, and introduction of emission controls on vehicles and engines in response to fighting air pollution [30], which has likely resulted in changes in year-to-year health burdens associated with gasoline and diesel emissions. Moreover, previous estimates of the health burden from gasoline and diesel emissions do not reflect recent advancements in global emission inventories and in air pollution epidemiology [11]. Thus, updated estimates of global health burdens due to long-term exposure to gasoline and diesel emissions under a consistent model framework is urgently needed. To address this gap, we integrate the newly developed Community Emissions Data System (CEDS) inventory [31, 32], NCAR Community Earth System Model (CESM version 2.2.0) Community Atmosphere Model with chemistry, version 6 (CAM6-Chem), and disease-specific concentration–response functions (CRFs) derived from the Global Burden of Disease 2019 (hereafter referred to GBD 2019) study, to provide a comprehensive estimate of premature deaths due to long-term exposure to ambient PM2.5 and O3 from gasoline and diesel emission sectors for 2000–2015.
2. Methodologies
2.1. CAM6-Chem model simulation
In this study, CAM6-Chem was run at a horizontal resolution of 0.95° latitude by 1.25° longitude, with model nudged to the Modern-Era Retrospective analysis for Research and Applications, Version 2. Spatially distributed anthropogenic emission inventory with monthly time resolution is from the CEDS release v2021_04_21 [32]. CEDS provides anthropogenic emissions of chemically reactive gases, carbonaceous aerosols, and fossil carbon dioxide (CO2) on a sectoral basis from 1750 to 2019 at a resolution of 0.5° latitude by 0.5° longitude. For this project CEDS emissions were re-processed to produce separate emission grids for emissions from diesel and gasoline fuel combustion (detailed source categories are provided in table S1). To be consistent with CAM6-Chem model resolution, we re-gridded CEDS anthropogenic emissions inventory from 0.5° × 0.5° longitude–latitude grid onto a 0.9° × 1.25° grid. Further details on CAM6-Chem model configuration can be found in supplemental text S1.
We run CAM6-Chem with three model simulations: a control ('CTRL') simulation with emissions from all sectors (including gasoline and diesel sectors), and two sensitivity simulations, otherwise-identical simulations to the 'CTRL' but turned off emissions from gasoline ('GSLOFF') and diesel ('DSOFF') sectors, respectively. All three simulations were run at 5 year intervals from 2000 to 2015, with the first year discarded as spin-up and the remaining year kept for post-analysis. Comparisons of these pairs (CTRL and GSLOFF, CTRL and DSOFF) of simulations allow us to isolate the impacts of gasoline and diesel emissions on air quality, which is subsequently quantified by taking the difference between the control and corresponding sensitivity simulation. Additionally, to validate model performance in simulating surface PM2.5 and O3, we evaluated the modeled PM2.5 and O3 in control simulation against a suite of ground observations globally (supplemental text S3).
2.2. PM2.5- and O3-induced premature deaths calculation
Our methodology to estimate PM2.5- and O3-induced premature deaths from gasoline and diesel sectors is identical to the methods used in Huang et al [26], who used the newly developed Global Exposure Mortality Model (GEMM) [11] to estimate excess deaths from exposure to ambient PM2.5 and O3. In GEMM, the premature deaths are calculated as a function of the gridded population density, the age-specific baseline mortality rate (BMR), and the hazard ratio (HR) associated with PM2.5 and O3 exposure [11]. A detailed description of PM2.5- and O3-induced premature deaths calculation can be found in supplemental text S2.
To estimate the number of PM2.5-induced mortality owing to gasoline and diesel sectors' emissions, we employed attribution method that scales total PM2.5 mortality in control simulation by the fractions of PM2.5 exposure from the gasoline and diesel sectors, given the strong nonlinearity of the CRFs associated with PM2.5 exposure [33]. This mortality calculation is represented by equation (1):

where MDS and MGSL represent PM2.5-induced premature deaths due to diesel and gasoline emissions, respectively; and MCTRL is the PM2.5-induced premature mortalities from all sectors in control simulation, which is calculated in equation (S3). PM2.5, CTRL, PM2.5, DSOFF, and PM2.5, GSLOFF denote model simulated surface PM2.5 concentrations in control, without diesel, and without gasoline simulations, respectively. For O3-induced mortalities associated with gasoline and diesel emissions, we subtracted the total mortalities in two sensitivity simulations (DSOFF and GSLOFF) from the total mortalities in the control (CTRL) simulation (subtraction method), which is identical to that we used for quantifying the impacts of gasoline and diesel emissions on air quality (section 2.1).
To compare premature deaths associated with exposure to different levels of PM2.5 and O3 across the world, we followed our previous studies [26] to divide the geography of the world into 11 regions, including China, India, the US, Canada, Western Europe (WEurope), Eastern and Central Europe (ECEurope), Latin America (LATIN), Sub-Saharan Africa (SSA), Northern Africa and the Middle East (NAME), rest of Asia (ROA), and rest of the world (ROW). Among them, the US, Canada, WEurope, and ROW are further classified as the developed countries, while China, India, ECEruope, LATIN, SSA, ROA, and NAME are the developing countries, as classified by the International Monetary Fund [34]. We sum the PM2.5- and O3-induced premature deaths from each grid cells and each 5 year interval age groups to determine regional and global health burdens associated with exposure to these air pollutants.
3. Results
3.1. Air quality impacts of global gasoline and diesel emissions
In general, gasoline and diesel emissions in the developed countries differ significantly from those in the developing countries during 2000–2015 (text S4). The transportation sector in CEDS contributed the most to global gasoline (57.7%–98.7%) and diesel (39.4%–84.5%) emissions, followed by residential, commercial, and other, industry, energy, and shipping sectors. Interestingly, we found that the emission changes in CEDS transportation sector were likely driven by the gasoline and diesel emissions, while other CEDS sectors were less impacted by the changes of these two categories (text S5). A detailed discussion of long-term trends of regional and global emissions for gasoline and diesel sectors are presented in texts S4–S5.
Spatiotemporal distributions of annual mean surface PM2.5 concentrations from the global gasoline and diesel emissions for the years 2000, 2005, 2010, and 2015 is shown in figure 1. In general, the global annual mean surface PM2.5 concentrations from the diesel sector are 2.1–3.4 times higher than that from the gasoline sector, which can be explained by high emissions of reactive gases and carbonaceous aerosols in the diesel sector (text S4). Gasoline and diesel emissions lead to increases in annual mean surface PM2.5 concentrations by up to 17.5 and 13.7 µg m−3, respectively. For the diesel sector, large PM2.5 burdens simulated by CAM6-Chem were found over China, India, ROA, WEurope, and NAME. By contrast, Australia, China, eastern Europe, and the Middle East were source regions associated with increases in surface PM2.5 concentrations attributable to the gasoline sector. Meanwhile, we found distinct temporal variabilities in surface PM2.5 concentrations over the study period. For instance, diesel emissions in China contributed 0.29, 0.51, 0.65, and 0.54 µg m−3 enhancements to the annual mean surface PM2.5 concentrations in 2000, 2005, 2010, and 2015, respectively. A similar trend was also observed for gasoline emissions in China, where annual mean surface PM2.5 concentrations simulated by CAM6-Chem increased from 0.39 µg m−3 to 0.43 µg m−3 during 2000–2010 but decreased to 0.27 µg m−3 in 2015. China implemented fuel (both gasoline and diesel) standard upgrades and tightened vehicle emissions standards to control the air pollutant emissions from gasoline and diesel-powered vehicles. The China 4 emission standards for new light-duty gasoline vehicles and light-duty diesel vehicles had been phased in since July 2011 and 2013, respectively [35]. The China 4 standard for heavy-duty diesel vehicles was implemented in January 2015, which reduced the emission limits of PM and NOx by 88% and 30%, respectively [36]. Additionally, improvement in fuel quality such as lowering maximum sulfur content in on-road diesel fuel from 350 ppm to 50 ppm had been achieved by the end of 2014 in China [36]. All 'yellow labeled' gasoline and diesel vehicles that respectively failed to meet China 1 and China 3 standards were eliminated by the end of 2017 [36]. Implementation of new emission standards for new vehicles, retiring old cars, and upgrading fuel quality together explained the decreasing annual mean PM2.5 concentrations in China during 2010–2015 for both gasoline and diesel sectors. Similarly, European countries (both WEurope and ECEurope) showed substantial (∼50%) reduction in surface PM2.5 concentrations, resulting from the continuously improved fuel properties specified in European standards (https://dieselnet.com/standards/eu/ld.php) coupled with tightened vehicle emissions standards. Thus, mandating more stringent fuel and vehicle emissions standards is critical for controlling PM2.5 emissions from the gasoline and diesel sectors.
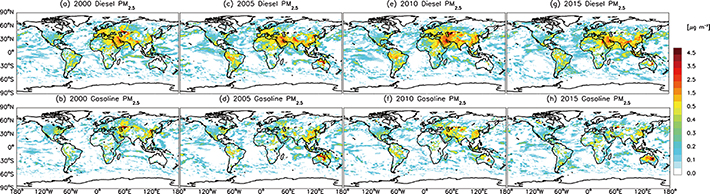
Figure 1. Global annual mean surface PM2.5 concentrations for diesel (upper panel) and gasoline (lower panel) emission sectors for the years of 2000 (a), (b), 2005 (c), (d), 2010 (e), (f), and 2015 (g), (h). Note that the maximum contribution from the gasoline sector was 17.5 µg m−3 in Australia (d). However, the legend bar was confined to 5 µg m−3 for a better contrast considering relatively small contributions from other regions. A full scaled plot was provided in the supplementary figure S9 as well.
Download figure:
Standard image High-resolution imageFigure 2 shows the global spatial and temporal variations of annual mean surface O3 attributable to the gasoline and diesel emissions during 2000–2015. The emission hot spots of surface O3 from the diesel sector simulated by CAM6-Chem were confined to NAME, India, ROA, and China, where diesel emissions contributed annual mean surface O3 concentrations up to 7.2, 7.2, 6.9, and 6.1 ppbv, respectively. NAME, ROA, LATIN, and China were the primary source regions of surface O3 for the gasoline sector, with the largest contributions of 7.1, 6.7, 6.6, and 5.2 ppbv, respectively. Significant temporal variabilities in surface O3 concentrations were also found during the period of 2000–2015, with decreasing contributions (1.13–0.72 ppbv) from the gasoline sector while increasing contributions (1.12–1.51 ppbv) from the diesel sector. This opposite trend was primarily related to the emissions of O3 precursors from each sector (text S4). It is interesting to note that diesel sector emissions led to decreases in O3 concentrations over China, the US, and WEurope. This finding is consistent with Huang et al [7] who revealed that diesel vehicle fleet caused up to 2.5 ppbv decreases in surface O3 over North China Plain in 2015, likely resulting from the VOC-limited regime associated with non-linear O3 production for these particular regions.
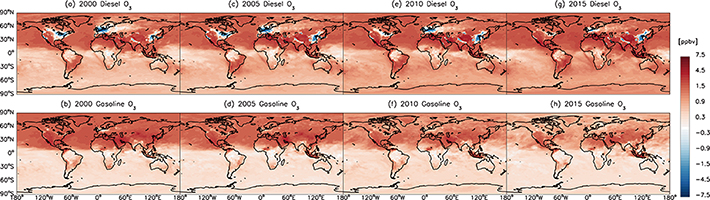
Figure 2. Global annual mean surface O3 concentrations for diesel (upper panel) and gasoline (lower panel) emission sectors for the years of 2000 (a), (b), 2005 (c), (d), 2010 (e), (f), and 2015 (g), (h).
Download figure:
Standard image High-resolution image3.2. Impacts of global diesel and gasoline emissions on human health
The global annual total premature deaths (APDs) associated with exposure to ambient PM2.5 and O3 from the gasoline and diesel sectors are listed in table 1. Globally, we estimate PM2.5- and O3-induced APDs attributable to all anthropogenic emission sectors are 5.12 (95 CI: 4.49–5.73), 5.57 (95 CI: 4.90–6.21), 6.02 (95 CI: 5.31–6.71), and 6.81 (95 CI: 6.00–7.59) million for the years of 2000, 2005, 2010, and 2015, respectively. Gasoline and diesel sectors together lead to 363 730, 412 087, 417 037, and 448 985 premature deaths associated with PM2.5 and O3 exposure for the same period (figure 3).
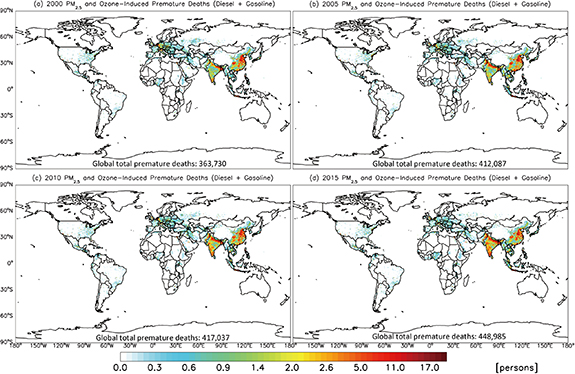
Figure 3. Global annual premature deaths associated with PM2.5 and O3 exposure attributable to the diesel and gasoline emission sectors for the years of (a) 2000, (b) 2005, (c) 2010, and (d) 2015, respectively.
Download figure:
Standard image High-resolution imageTable 1. Global PM2.5- and O3-induced premature deaths and years of life lost (YLL) during the study period of 2000–2015.
| Cases | Species | 2000 | 2005 | 2010 | 2015 | 2000 | 2005 | 2010 | 2015 |
|---|---|---|---|---|---|---|---|---|---|
| Premature deaths (×1000 persons) | YLL (×106 year) | ||||||||
| Control | PM2.5 | 4439.6 (4061.6, 4810.6) | 4894.3 (4478.9, 5301.9) | 5327.8 (4876.5, 5770.2) | 5986.2 (5480.0, 6482.4) | 105.4 (96.5, 114.1) | 113.7 (104.2, 121.9) | 121.9 (111.7, 131.9) | 133.6 (122.4, 144.5) |
| O3 | 678.7 (426.1, 921.6) | 671.0 (420.6, 912.9) | 692.2 (435.1, 939.3) | 824.5 (522.2, 1109.7) | 12.3 (7.7, 16.7) | 11.9 (7.4, 16.1) | 12.0 (7.5, 16.3) | 13.9 (8.8, 18.8) | |
| PM2.5 + O3 | 5118.2 (4487.7, 5732.2) | 5565.4 (4899.5, 6214.8) | 6020.1 (5311.6, 6709.6) | 6810.7 (6002.3, 7592.1) | 117.7 (104.2, 130.8) | 125.6 (111.6, 133.9) | 133.9 (119.2, 148.2) | 147.5 (131.2, 163.3) | |
| Gasoline | PM2.5 | 81.4 (74.5, 88.3) | 97.9 (89.6, 106.1) | 99.2 (90.8, 107.5) | 84.2 (77.0, 91.2) | 1.86 (1.70, 2.02) | 2.21 (2.03, 2.40) | 2.21 (2.02, 2.39) | 1.81 (1.66, 1.96) |
| O3 | 77.1 (51.3, 98.3) | 72.7 (48.0, 93.3) | 57.1 (37.8, 73.1) | 55.5 (37.5, 69.6) | 1.37 (0.91, 1.74) | 1.25 (0.83, 1.61) | 0.97 (0.64, 1.24) | 0.93 (0.63, 1.17) | |
| PM2.5 + O3 | 158.6 (125.7, 186.6) | 170.7 (137.6, 199.5) | 156.3 (128.6, 180.6) | 139.7 (114.5, 160.8) | 3.23 (2.61, 3.76) | 3.47 (2.85, 4.00) | 3.18 (2.66, 3.63) | 2.74 (2.29, 3.12) | |
| Diesel | PM2.5 | 163.6 (149.5, 177.4) | 202.2 (184.9, 219.2) | 214.1 (195.9, 232.0) | 238.1 (217.9, 257.8) | 3.77 (3.45, 4.08) | 4.60 (4.21, 4.98) | 4.79 (4.39, 5.19) | 5.26 (4.82, 5.69) |
| O3 | 41.6 (27.3, 53.8) | 39.3 (25.8, 50.7) | 46.5 (30.7, 59.8) | 71.3 (47.4, 90.9) | 0.80 (0.52, 1.03) | 0.74 (0.49, 0.96) | 0.87 (0.58, 1.12) | 1.26 (0.84, 1.61) | |
| PM2.5 + O3 | 205.2 (176.8, 231.2) | 241.4 (210.7, 269.8) | 260.7 (226.7, 291.9) | 309.3 (265.3, 348.7) | 4.56 (3.97, 5.11) | 5.34 (4.70, 5.94) | 5.67 (4.96, 6.31) | 6.52 (5.66, 7.30) | |
Note: Parenthesis shows the uncertainty and 95% confidence intervals, which are calculated based on the standard error of HR function in GEMM.
Specifically, we attribute gasoline (diesel)-emitted PM2.5 and O3 to 0.16 (0.21), 0.17 (0.24), 0.16 (0.26), 0.14 (0.31) million APDs globally for the years of 2000, 2005, 2010, and 2015, respectively, which account for 3.1% (4.0%), 3.1% (4.3%), 2.6% (4.3%), and 2.1% (4.5%) of the total baseline mortality, respectively (table 1). The fractional contribution of PM2.5- and O3-induced APDs from the gasoline and diesel sectors (6.9%, in 2010) relative to all sectors is slightly higher than reported contribution of 5% for the transportation sector by Lelieveld et al [29]. PM2.5-induced premature deaths dominate global annual total PM2.5 and O3-induced mortalities for both gasoline and diesel sectors, as its shares in the totals range from 51.5% to 63.5% (gasoline) and 77.0%–83.7% (diesel) during 2000–2015. Globally, the diesel sector leads to 2.0–2.8 times higher PM2.5-induced mortalities than gasoline over the study period, while the larger burdens of O3-induced mortalities (by a factor of 1.2–1.9) are observed in the gasoline sector compared with the diesel except for the year 2015. Lower O3-induced mortalities from the diesel sector is expected given its negative impact on surface O3 concentrations over China, the US, and WEurope (figure 2); while higher PM2.5-induced mortalities from the diesel sector can be attributed to the significantly higher emissions of BC and NOx (a factor of 21 and 3, respectively) that result in 2.1–3.4 times higher concentrations of surface PM2.5 than those from the gasoline sector. In terms of years of life lost (YLL), annual total YLL associated with PM2.5- and O3-induced premature deaths ranges from 2.74 million (95 CI: 2.29–3.12 million) to 3.23 million (95 CI: 2.61–3.76 million) years for gasoline and 4.56 million (95 CI: 3.97–5.11 million) to 6.52 million (95 CI: 5.66–7.30 million) years for diesel, respectively accounting for about 1.9%–2.8% and 3.9%–4.4% of the baseline YLL during 2000–2015 (table 1).
While global APDs provide a snapshot of important trends of gasoline and diesel sectors' impacts on human health, regional and country-level contributions provide information more relevant to local impacts of ambient PM2.5 and O3. Therefore, figure 4 additionally shows PM2.5- and O3-induced APDs attributable to the diesel and gasoline emission sectors for 11 regions. At the country level, the estimated APDs associated with long-term PM2.5 and O3 exposure from the gasoline and diesel sectors vary by several orders of magnitude across regions. For instance, nearly 32 000–73 000 and 6800–7100 premature deaths could be respectively avoided in China and the US by eliminating PM2.5 emissions from the diesel sector during 2000–2015. Apart from local impacts of PM2.5 pollution, large variations in total number and density of the exposed population, and differences in BMRs should be considered when comparing total mortalities across the countries [37]. Specifically, the PM2.5-induced mortality from the diesel sector is estimated at 2.57–5.29 deaths per 100 000 population in China during 2000–2015, which is on average 1.02–2.36 times greater than that in the US (2.24–2.73 deaths per capita). The BMRs due to noncommunicable diseases (NCDs) and lower respiratory infections (LRIs) associated with PM2.5 exposure was also 1.26–1.45 times larger in China than that in the US. In combination with much higher (1.76–3.75 fold) PM2.5 concentrations over China, it is not surprising to observe up to an order of magnitude higher diesel-related premature deaths in China than the US.

Figure 4. PM2.5- and O3-induced APD attributable to the diesel (a), (c) and gasoline (b), (d) emission sectors in each region for the years of 2000, 2005, 2010, and 2015, respectively. Percentages in the bar plots are the absolute change rates of APDs, which are calculated as percentages of the difference between 2015 and 2000 APDs divided by 2000 APDs. Error bars represent 95% confidence intervals.
Download figure:
Standard image High-resolution imageAt the regional scale, the countries with the largest PM2.5 mortalities due to gasoline and diesel emissions are China, India, and ROA, collectively representing 63.6%–70.3% and 52.5%–70% of the global total premature mortality for the gasoline and diesel sectors, respectively. The largest PM2.5-induced premature deaths associated with gasoline emissions are found in China, with 37 000–47 000 APDs during 2000–2015, accounting for 42.9%–49.3% of the global total mortality for gasoline (figure 4(b)). China, India, and ROA are also the countries with the highest O3-induced mortalities, together accounting for 76.4%–80.5% and 70.1%–84.3% of the global mortality for the gasoline and diesel sectors, respectively (figures 4(d) and (c)). Interestingly, the shares of O3-induced mortality attributable to gasoline (diesel) emissions have shrunk significantly in China, from 61% (26%) in 2000 to 36.5% (4%) in 2015. The declining share of O3-induced mortality in China contrasts to the growing shares in India, which increased by 100% and 55% during 2000–2015 for the diesel and gasoline sectors, respectively.
To investigate the effect of economic disparities on PM2.5- and O3-induced mortalities, we compare total mortalities per capita (×105) in the developed countries with those in the developing countries. We found health effect disparities in both PM2.5- and O3-induced mortality between the developed and developing countries. On average, the PM2.5-induced moralities are estimated at 3.8, 4.6, 4.7, and 4.6 per 100 000 population in the developing countries (table 2), and 7.0, 6.4, 5.0, and 3.9 in the developed countries for the years of 2000, 2005, 2010, and 2015, respectively. The developed countries have relatively higher PM2.5 mortalities per capita associated with diesel and gasoline emissions than the developing countries during 2000–2010. However, this trend is reversed in 2015, as the total mortality in the developed countries decreased by 38% while the total population expanded by 11.1% from 2000 to 2015, resulting in a higher PM2.5-induced mortalities per capita in the developing countries than developed countries in 2015. For O3-induced mortality per capita, we found an opposite health burden disparity, with the developing countries having slightly higher mortality per capita (1.6–2.2) than the developed countries (1.1–1.4) for 2000–2010 but reversing in 2015 (table 2). Taken together, diesel and gasoline emissions create health-effect disparities between the developed and developing countries, which are likely to aggravate afterwards (figure S10).
Table 2. Comparisons of PM2.5- and O3-induced APD rates (per 100 000 population) associated with the gasoline and diesel emission sectors between the developed and developing countries during 2000–2015.
| Species | Cases | Countries | 2000 APD rate | 2005 APD rate | 2010 APD rate | 2015 APD rate |
|---|---|---|---|---|---|---|
| PM2.5 | Gasoline | Developed | 1.90 (1.73–2.07) | 1.56 (1.42–1.69) | 1.17 (1.07–1.27) | 1.10 (1.00–1.20) |
| Developing | 1.32 (1.21–1.43) | 1.58 (1.45–1.72) | 1.54 (1.41–1.67) | 1.19 (1.09–1.29) | ||
| Diesel | Developed | 5.11 (4.66–5.57) | 4.82 (4.39–5.25) | 3.84 (3.50–4.18) | 2.82 (2.57–3.07) | |
| Developing | 2.49 (2.27–2.69) | 3.06 (2.80–3.32) | 3.16 (2.90–3.42) | 3.41 (3.12–3.69) | ||
| Gasoline + diesel | Developed | 7.02 (6.39–7.64) | 6.37 (5.80–6.94) | 5.01 (4.56–5.46) | 3.92 (3.57–4.27) | |
| Developing | 3.81 (3.49–4.13) | 4.56 (4.25–5.03) | 4.71 (4.31–5.09) | 4.61 (4.22–4.99) | ||
| O3 | Gasoline | Developed | 1.10 (0.72–1.45) | 0.94 (0.61–1.23) | 0.77 (0.50–1.01) | 0.75 (0.49–0.98) |
| Developing | 1.35 (0.90–1.71) | 1.21 (0.80–1.54) | 0.88 (0.58–1.12) | 0.78 (0.53–0.98) | ||
| Diesel | Developed | 0.02 (−0.01–0.03) | 0.21 (0.15–0.25) | 0.64 (0.43–0.81) | 1.12 (0.73–1.46) | |
| Developing | 0.80 (0.53–1.04) | 0.69 (0.45–0.89) | 0.71 (0.47–0.92) | 0.99 (0.66–1.26) | ||
| Gasoline + diesel | Developed | 1.12 (0.74–1.44) | 1.15 (0.76–1.49) | 1.41 (0.93–1.82) | 1.87 (1.21–2.44) | |
| Developing | 2.15 (1.42–2.76) | 1.89 (1.25–2.43) | 1.59 (1.05–2.04) | 1.77 (1.19–2.23) | ||
| PM2.5 + O3 | Gasoline + diesel | Developed | 8.11 (7.13–9.08) | 7.53 (6.56–8.43) | 6.43 (5.49–7.28) | 5.79 (4.78–6.71) |
| Developing | 5.96 (4.91–6.89) | 6.54 (5.50–7.47) | 6.29 (5.36–7.13) | 6.38 (5.41–7.22) |
Note: Parenthesis shows the uncertainty and 95% confidence intervals. Developed countries include the US, Canada, WEurope, and ROW; while developing countries refer to China, India, ROA, SSA, ECEurope, NAME, and LATIN.
4. Discussion
Our estimates of global APDs associated with ambient PM2.5 and O3 exposure are generally higher than those reported in previous studies (figure 5) [7, 19, 28, 29, 38]. Several factors contribute to these differences, including different model configurations (i.e. chemical transport models (CTMs) and emission inventories) and health burden calculations (e.g. the GEMM vs. integrated exposure–response (IER) model). For instance, global annual total PM2.5- and O3-induced premature deaths were estimated at 4.42 million (95 CI: 3.14–5.70 million) for the year 2000 [38] and 2.72 million (95 CI: 1.16–4.32 million) for the year 2005 [28], which was 13.7% and 51.2% lower than our estimates, respectively. Our study used BMR data derived from the latest GBD 2019 study [39], which are much higher than those used by Anenberg et al [38] from World Health Organization (WHO) database [40] and Silva et al [28] from GBD 2010 study [41]. In terms of CTMs, we employed CESM CAM6-Chem model to simulate surface PM2.5 and O3 concentrations, whereas both other studies used MOZART (versions 2 and 4). Besides, PM2.5-induced premature deaths were calculated solely based on two diseases, i.e. cardiopulmonary and lung cancer (LC) by Anenberg et al [38] and four diseases (ischemic heart disease (IHD), chronic obstructive pulmonary disease (COPD), LC, and stroke) by Silva et al [28], whereas we estimated adult premature deaths from LRI and NCDs that include but not limited to COPD, IHD, LC, stroke, and diabetes, partially explaining our higher estimates than theirs. Moreover, we also acknowledge that significant higher mortality HRs used in the GEMM than IER model [19, 28, 29] may also contribute to our higher estimated premature deaths globally. A similar finding has been reported by Chowdhury et al [37], who revealed that global PM2.5-induced premature deaths estimated with GEMM for 2015 (8.9 million) are significantly higher than those estimated with the IER model. Interestingly, there are two higher estimates of premature mortalities estimated with GEMM by Huang et al [26] for 2010 (9.29 million, 95 CI: 8.31–10.22 million) and by Burnett et al [11] for 2015 (8.9 million, 95 CI: 7.5–10.3 million), which are a factor of 1.54 and 1.49 times higher than our estimates for the years 2010 and 2015, respectively. Relatively lower PM2.5-induced premature deaths estimated with GEMM in this study can be attributable to underestimates of surface PM2.5 mass concentrations from the CAM6-Chem modeling (text S3), even after downscaling using satellite data, resulting in lower PM2.5-related health burden globally.

Figure 5. Comparisons of global APDs associated with (a) all emission sources, (b) surface transportation sources, and (c) gasoline and diesel sources between previous studies and our study for the period of 2000–2015. PM2.5-induced and O3-induced premature deaths are shown in blue and green bars, respectively. Total APD in purple bar refers to the sum of PM2.5- and O3-releated premature deaths, which are not calculated separately in the corresponding literatures. Error bars also respectively show 95% confidence intervals of estimated premature deaths resulted from PM2.5 and O3 exposures. The labels of 2 M and 100 k in y axis represent 2 million and 100 000 premature deaths, respectively. Gasoline and diesel sources (panel c) include emissions from transportation (on-road light- and heavy-duty vehicles, commercial buses, mopeds and motorcycles, rail and other surface transport), shipping, energy, residential, commercial, and industrial sectors (table S1).
Download figure:
Standard image High-resolution image
Our estimates of global total PM2.5- and O3-induced premature deaths associated with gasoline and diesel emission sectors are still higher than previous studies [7, 19, 28, 29]. The total premature deaths reported in previous studies are estimated solely based on land transportation sector. For instance, Lelieveld et al [29] reported global land traffic emissions are responsible for about 164 850 (95 CI: 80 500–240 500) mortality for the year 2010 (figure 5(b)), and they acknowledged that this estimate is likely a lower bound. In this study, our gasoline and diesel emission sectors are not restricted to the land transportation sector but also include shipping, energy, residential, commercial, and industrial sectors, making the total impact larger than transportation-sector only estimates. However, it is noteworthy that the land transportation sector still dominated our gasoline- and diesel-related air pollutants' emissions (with annual contributions of 57.7%–98.7% and 39.4%–84.5%, respectively, figures S5 and S6) when compared to the remaining sectors. We acknowledge that other factors such as different health burden methodologies (GEMM vs. IER), CTMs, GBD data, and emission inventories may also contribute to these differences, as discussed earlier.
There are several limitations and assumptions in this study. First, our estimates of PM2.5- and O3-induced premature deaths from the gasoline and diesel emission sectors are likely a lower bound due to the underestimates of surface PM2.5 mass concentrations simulated in the CAM6-Chem model. Relative to the localized Multi-resolution Emission Inventory for China inventory, the CEDS slightly underestimated BC by 6.1% while overestimated organic carbon (OC) by 6.0% in China (text S6), which potentially hindered model prediction of surface PM2.5 concentration and its changes in this area [42, 43]. The 0.9° × 1.25° horizontal resolution may also not be sufficient to capture the varied landscape and high PM2.5 gradients, especially over the source regions of China [44] and India. Meanwhile, CAM6-Chem model does not explicitly account for nitrate aerosol formation, which might, to some extent, result in lower estimates of PM2.5 concentrations [7]. Despite scaling model simulated PM2.5 concentrations using a newly available satellite derived PM2.5 product [45], the negative biases between modeled and observed PM2.5 concentrations over China, India, and Europe still exists, although reduced (figure S2). Second, we assume equal toxicity of PM2.5 mass and its sources (e.g. diesel and gasoline). This assumption is necessary for use with the GBD 2019 and GEMM [24]. It is also similar to the assumptions made in the US EPA [46] and WHO [47] assessment reports. Nevertheless, some toxicological and epidemiological evidence suggest that the toxicity of PM2.5 is impacted by its composition and source category [48, 49]. Carbonaceous components (BC and OC) were found to be significantly more toxic than other components in PM2.5 [50, 51]. Vehicular emissions and residual oil combustion were the sources mostly associated with PM2.5's in vitro toxicity [52]. Thus, the compositional impacts of PM2.5 could have potential influence on health relevant PM2.5 exposure, which may result in an underestimate of health risk of PM2.5 in this study. Third, BMRs used in this work are reported at the national or regional level, which may under- or over-estimate the PM2.5 and O3 burdens from the gasoline and diesel sectors, given the demographics vary significantly at sub-national, national, and regional scales. Lastly, the uncertainties listed here are in addition to the uncertainties involved in the emissions and model processes. We acknowledge that our results of surface PM2.5 and O3 concentrations simulated by CAM6-Chem and estimates of global annual total PM2.5- and O3-induced premature deaths are likely sensitive to the choice of chemical-transport models, emission inventories, and health burden data (i.e. GBD study). In future studies, localized emission inventories are recommended to use for a better representation of the aerosol species, if they are available.
5. Conclusion
We estimate that global annual total PM2.5- and O3-induced premature deaths are 139 700–170 700 for gasoline and 205 200–309 300 for diesel sector during 2000–2015, with the corresponding YLL of 2.74–3.47 and 4.56–6.52 million years, respectively. Our results suggest that health disparities associated with PM2.5 and O3 air pollution exposure are likely to aggravate between the developed and developing countries afterwards. This study is one of the first studies to quantify the long-term health disparities attributable to PM2.5 and O3 exposure from the fueled-based gasoline and diesel sectors between the developed and developing countries. Findings from this study also have important implications for decision makers on how to effectively mitigate air pollution associated with gasoline and diesel sectors on regional and global scales.
Acknowledgments
This work was funded by the U.S. National Science Foundation (AGS-2111428) and the Office of Vice President for Research at Wayne State University. We would like to acknowledge high-performance computing support from Cheyenne (doi: 10.5065/D6RX99HX) provided by NCAR's Computational and Information Systems Laboratory, sponsored by the NSF. We also greatly thank the Grid High Performance Computing (HPC) support from Wayne State University for providing the computational resources used in this work.
Data availability statement
The data that support the findings of this study are available upon reasonable request from the authors.