

Abstract
In the last decade, the transition away from coal and to fossil gas and biomass in the U.S. has had a major influence on greenhouse gas emissions, especially from electricity generation. However, the effect of this transition on the public health burden of air pollution is not well understood. We use three reduced complexity models (RCMs) and emissions inventory data to reconstruct the changes in health impacts due to PM2.5 exposure from stationary fuel combustion sources in the U.S., from 2008 to 2017. In 2008, the health impacts of air pollution from stationary sources was largely driven by coal combustion. By 2017, the contribution of coal has dropped precipitously, and the health burden of stationary air pollution sources is shared among a mixture of source types and fuels—largely gas and biomass in buildings and industry, and the remaining coal-fired electricity generation. Nationwide, in 2017, health impacts of biomass and wood combustion are higher than combustion of coal and gas individually. Industrial boilers had the highest emissions and health impacts, followed by residential buildings, electricity, and then commercial buildings. All three RCMs indicate that biomass and wood are the leading sources of stationary source air pollution health impacts in 24 states, and that the total health impacts of gas surpass that of coal in 19 states and the District of Columbia. We develop a projection method using state-level energy consumption data for 2018 and show that these trends likely continued. The RCMs had high agreement for 2008 emissions, when sulfur dioxide emissions from coal-fired power plants were the predominant air pollution source. However there was substantial disagreement between the three RCMs on the 2017 health burden, likely due to pollutants less well-characterized by the RCMs having a higher proportionate share of total impacts.
Export citation and abstract BibTeX RIS

Original content from this work may be used under the terms of the Creative Commons Attribution 4.0 license. Any further distribution of this work must maintain attribution to the author(s) and the title of the work, journal citation and DOI.
1. Introduction
The U.S. has undergone a major energy transition in the last decade. This has been largely driven by the boom in unconventional natural gas production, resulting in an increase in gas consumption in many sectors of the economy [1]. Total coal and gas consumption in the U.S. both increased from 1990 to 2007. In 2007, consumption of gas reached 23.7 quadrillion Btu (quads) consumed, surpassing coal, with 22.7 quads consumed [1]. After 2007, gas consumption continued to exceed that of coal and coal consumption decreased, mainly due to gas replacing coal in electricity generation and industry [1, 2]. This made gas the predominant fuel in sectors with stationary sources (all sectors except transportation) [1, 2]. Gas consumption continued to increase in all stationary sectors, with gas generating basically as much electricity as coal in 2015, and total gas consumption reaching a point roughly double that of coal in 2016. The transition from coal to gas, combined with increased share of renewable energy generation and decrease in petroleum consumption in stationary sectors, have resulted in a 12% reduction in energy-related CO2 emissions from 2007 to 2018, reaching 5281 million metric tons in 2018 [1]. The public health implications of this energy transition in the last decade are far less well-understood.
Combustion of fuels for energy also contributes to the major air pollutants, PM2.5 (particles with aerodynamic diameter below 2.5 µm) and ozone, which have a substantial burden on public health [3–5]. Exposure to PM2.5 and ozone has been found to lead to a variety of health impacts, such as cardiovascular and respiratory disease, stroke, asthma, autism spectrum disorder, and premature mortality [3, 4, 6–8]. These pollutants come from a number of sources, including combustion of fossil fuels, which emits PM2.5, along with PM2.5 precursors including sulfur dioxide (SO2), nitrogen oxides (NOx ), and volatile organic compounds (VOCs) [5]. Many studies have evaluated the burden of different sources of air pollution in the U.S., including a recent study finding approximately 100 000 premature deaths due to PM2.5 exposure, with a mixture of sources contributing [9]. However, these studies have not examined the effect of changes in the energy sector in the last decade.
Here, we evaluate the changes in the health impacts of exposure to PM2.5 from stationary emissions sources from 2008 to 2017, using emissions data from the U.S. Environmental Protection Agency (U.S. EPA) [10] and three reduced complexity models (RCMs)—EASIUR, InMAP, and AP2—which provide estimates of health-related social costs of air pollutants emissions in the U.S [9, 11–13]. These RCMs are designed for policy evaluation and research contexts where employing full chemical transport models is prohibitively resource intensive, and perform fairly well compared to the state-of-the-science modeling platform using the Community Multiscale Air Quality Model (CMAQ) in conjunction with the geospatial health benefits modeling platform BenMAP [14]. We focus on changes in the health burden of combustion emissions from stationary sources burning coal, gas, and other fuels along with other industrial sources from 2008 to 2017, and the contribution of different emissions sources in 2017. We also use this as an opportunity to cross-compare the results from the RCMs and evaluate agreement between the three RCMs. Additionally, we develop and test a projection method to estimate the emissions and their health impacts using energy consumption data.
2. Methods
We built a model framework using emissions estimates of the National Emissions Inventory (NEI) from the U.S. EPA, from 2008 to 2017, at county level and broken into Emissions Inventory System (EIS) sectors, as our primary source of emissions estimates [10]. We also use the Clean Air Markets Data (CAMD) from the U.S. EPA, as a secondary source for electricity sector emissions [15]. We then used the county Federal Information Processing Standard (FIPS) codes to join the county-level emissions data from the NEI to county-level health impact estimates data, for primary PM2.5 emissions and all PM2.5 precursor pollutants, as provided by three RCMs—EASIUR, AP2, and InMAP—to produce health impact estimates for the emissions sources in the NEI [8, 10–12]. Similarly, we separately joined the CAMD emissions data to the RCMs by county to produce a separate set of health impact estimates based on CAMD. When presenting results, we present results from all three RCMs to provide a range of estimates to evaluate model agreement. We also track which RCMs tend to produce estimates that are higher or lower than the others, along with evaluating trends in agreement over time.
After constructing the inventory of emissions and impacts, we categorized each emission source into source categories and by primary fuel type for sectors that have fuel type listed in the EIS (table S1 (available online at stacks.iop.org/ERL/16/054030/mmedia)). We then developed, tested, and applied a method derived from our impact results from the NEI, to project impacts of energy consuming sectors as reported in the State Energy Data System (SEDS), a database from the U.S. Energy Information Administration which provides state-level historical energy use data [2]. The NEI has fuel types listed for residential, commercial/institutional buildings, electricity, and industrial boilers, but not for many other sources (e.g. industrial processes, waste disposal). Below, we refer to residential, commercial/institutional buildings, electricity, and industrial boilers as 'major fuel consuming stationary sources' and the other sources as 'other stationary sources'. Each model component is described in detail below.
2.1. Emissions
As the NEI is the most complete inventory of emissions in the U.S., it serves as the basis of our main analysis. The NEI is a bottom-up inventory of air pollutant emissions within the U.S. published by the U.S. EPA every 3 years [10]. The U.S. EPA constructs the NEI using emissions estimates provided by states, which are constructed using a mix of economic activity estimates, source data, energy consumption data, and monitoring data for larger sources (including CAMD data for electric generators ⩾ 25 MW) [10]. For this analysis, we used county-level data for fuel combusting sectors listed as non-mobile by the EIS, stationary sources related to the fuel supply chain, and other stationary industrial processes for the years 2008, 2011, 2014, and 2017. We then grouped each EIS sector into source categories with known fuel use (electricity, commercial buildings, residential buildings, and industrial boilers) as 'major fuel consuming stationary sources', and without fuel use or with unknown fuel type used (commercial cooking, waste disposal, supply chain, and other industry), as 'other stationary sources'. Major fuel consuming stationary sources were grouped by NEI fuel type (coal, gas, oil, wood, biomass, and other) (table S1). We combined wood and biomass into one category. We also use emissions data from CAMD, which provides SO2 and NOx emissions for some electricity generation, from 2008 to 2019 for electricity generation [15].
2.2. Reduced complexity models
The RCMs (EASIUR, AP2, and InMAP) provide estimates of the total mortality impacts of PM2.5 exposure per ton of each precursor pollutant—SO2, NOx , VOCs (except EASIUR), ammonia (NH3), and primary PM2.5—for each source county, from low and high stack heights [8, 10–12, 16]. We used the annual average values and assigned low, high, or the average stack heights to each source based on sector (table S1). We used a concentration response function (CRF) of a 1.4% increase in mortality risk per 1 µg m−3 change in the annual average PM2.5 exposure [17]. This is a standard value from the RCMs, based on a CRF from a large cohort study in the epidemiological literature, which falls within the confidence intervals of a recent meta-analysis [3]. We used a value of statistical life (VSL) of $11.2 million (2017 USD) [18, 19]. We estimated the impact per ton of sources listed as 'portable facilities' in the NEI using the state's average for each RCM. To estimate the impact of sources on land currently controlled by Indigenous Americans, we assigned each source impact per ton values corresponding to the county or the average of all the counties in which land controlled by Indigenous Americans was located (table S2).
2.3. Linkage to SEDS
For each of the major fuel consuming stationary sources in the EIS—industrial boilers, commercial and residential buildings, and electricity generation—in each state, we developed state-level mortality impact factors (HIFs), providing mortality impacts per unit of energy consumption. To calculate the HIFs, we matched the mortality impacts for each state, year, source, and fuel type to energy consumption data in the corresponding state, year, source, and fuel type from SEDS and then calculate the HIFs using equation (2).

where,  is the health impacts of emissions from
  combusted by
  (major fuel consuming stationary sources of electricity, commercial buildings, residential buildings, and industrial boilers) in
  , in
, in  ;
;  is the health impacts of emissions from
  combusted by
  (major fuel consuming stationary sources) in
  , in
, in  ; and there are k = 1, ..., n counties in
  ;
;  is the energy consumption, with unit of quad (1 quad equals 1 quadrillion, 1015, Btu), in
  by
by  in
in  in
in  .
.
We then project health impacts from energy use reported by SEDS, using HIFs calculated from the most recent prior year available (i.e. impacts estimated using the 2014 NEI were divided by 2014 energy use from SEDS to produce state level estimates of emissions factor (tons per unit of energy) and HIFs for 2014; the 2014 emissions factors and HIFs were then used to estimate impacts for 2015 and 2016 using SEDS data from the corresponding years).
where  is the health impacts projected in
  ; Primary
  is the energy consumption in
  ; and m (1, 2, and 3) represents the years in which the health impacts are projected based on the most recent HIF calculated using the most recent available historical emissions data from
  and the corresponding energy use data in
  .
.
We then compared the results of this projection method against the next available estimates derived from the NEI (i.e. we estimated 2017 impacts using 2017 SEDS data and a 2014 state-level HIFs, and then compared it to estimates using the 2017 NEI emissions data), using percent difference between the NEI-based historical estimate and the corresponding projected impact.
where  is the percent difference between
  (the projected health impacts in
  using HIF calculated from emission and energy data in
  ) and
) and  (the historical health impacts in
  using historical emission data in
  ).
).
Positive and negative Health Impact Projection Error values represent overestimation and underestimation of the estimated health impacts using the state-level projection method, compared to estimates derived from the county-level historical data from the NEI. For this comparison, we are treating the health impacts estimated from historical NEI data as the more accurate model for the basis of comparison.
3. Results
3.1. Trends in health impacts from major fuel combusting stationary sources
The mortality impacts of PM2.5 from major fuel combusting stationary sources have changed substantially in the last decade. The trend was consistent across RCMs, but with some disagreements in magnitude. All ranges provide the range of estimates from the three RCMs with our chosen CRF and VSL. Impacts of electricity had the greatest reduction, from 59 000–66 000 deaths ($660—$740 billion) in 2008 to 10 000–12 000 deaths ($110—$140 billion) in 2017 (figure 1, table 1), largely driven by reduced emissions from coal (figures 2 and S1(a)). Sources categorized as 'Other Industry' had the second largest reduction, from 41 000–49 000 attributable deaths ($460—$550 billion) in 2008 to 27 000–32 000 attributable deaths ($300—$350 billion) in 2017 (figure 3, table 1), largely driven by reductions in impacts from SO2 and PM2.5 emissions (figures 4 and S2(b)).
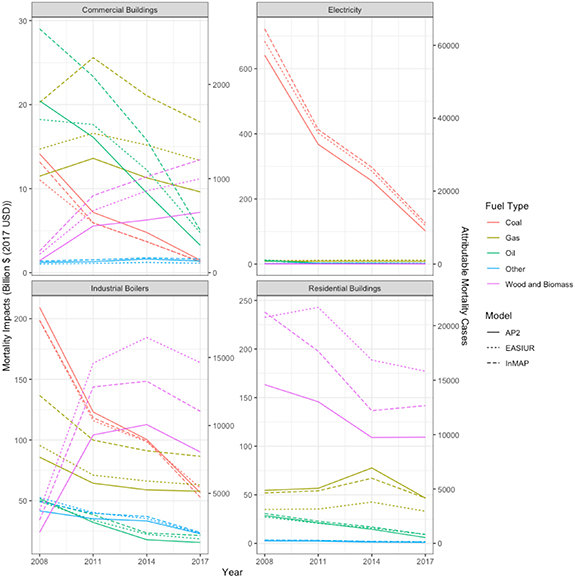
Figure 1. Trends in the U.S. mortality impacts from PM2.5 exposure from 2008 to 2017 for stationary source categories with a specific fuel type listed, by fuel type and sector.
Download figure:
Standard image High-resolution image
Figure 2. Trends in the U.S. mortality impacts from PM2.5 exposure from 2008 to 2017 for stationary source categories with a specific fuel type listed, by fuel type, sector, model, and emitted precursor pollutant.
Download figure:
Standard image High-resolution image
Figure 3. Trends in the U.S. mortality impacts from PM2.5 exposure from 2008 to 2017 for stationary source categories without a specific fuel type listed, by fuel type, sector, and emitted precursor pollutant.
Download figure:
Standard image High-resolution image
Figure 4. Trends in the U.S. mortality impacts from PM2.5 exposure from 2008 to 2017 for stationary source categories without a specific fuel combustion type listed, by sector, model, and emitted precursor pollutant.
Download figure:
Standard image High-resolution imageTable 1. Range of mortality burden estimates from PM2.5 by source sector, RCM, and year.
| 2008 | 2017 | |||||||||||||
|---|---|---|---|---|---|---|---|---|---|---|---|---|---|---|
| Source type | RCM with highest health burden estimate | Highest mortality burden estimate (billion $ 2017 USD) | Highest mortality estimate | RCM with lowest health burden estimate | Lowest mortality burden estimate (billion $ 2017 USD) | Lowest mortality estimate | % Difference ((highest − lowest) /highest) | RCM with highest health burden estimate | Highest mortality burden estimate (billion $ 2017 USD) | Highest mortality estimate | RCM with lowest health burden estimate | Lowest mortality burden estimate (billion $ 2017 USD) | Lowest mortality estimate | % Difference ((highest − lowest) /highest) |
| Commercial buildings | InMAP | 66 | 5900 | EASIUR | 47 | 4200 | 29% | InMAP | 39 | 3500 | AP2 | 23 | 2000 | 42% |
| Commercial cooking | InMAP | 92 | 8200 | AP2 | 53 | 4800 | 42% | InMAP | 150 | 13000 | AP2 | 80 | 7100 | 45% |
| Electricity | InMAP | 740 | 66000 | AP2 | 660 | 59000 | 11% | InMAP | 140 | 12000 | AP2 | 110 | 10000 | 18% |
| Industrial boilers | InMAP | 470 | 42000 | AP2 | 410 | 37000 | 12% | EASIUR | 330 | 29000 | AP2 | 240 | 22000 | 26% |
| Other industry | InMAP | 550 | 49000 | AP2 | 460 | 41000 | 17% | InMAP | 350 | 32000 | AP2 | 300 | 27000 | 14% |
| Residential buildings | InMAP | 320 | 29000 | AP2 | 250 | 22000 | 23% | EASIUR | 220 | 20000 | AP2 | 160 | 15000 | 26% |
| Supply chain | InMAP | 130 | 11000 | EASIUR | 64 | 5700 | 49% | InMAP | 100 | 9000 | EASIUR | 43 | 3900 | 57% |
| Waste | AP2 | 120 | 11000 | EASIUR | 110 | 10000 | 6% | EASIUR | 110 | 10000 | AP2 | 77 | 6900 | 32% |
Industrial boilers and commercial buildings had substantial decreases in coal and oil impacts, mostly from SO2, but these were essentially replaced by increases in biomass combustion impacts, mainly PM2.5 emissions (figures 2 and S1(a)). Impacts from commercial building gas use peaked in 2011, and then decreased from 2011 to 2017; industrial boiler gas use impacts consistently decreased from 2008 to 2017 (figures 2 and S1(a)). Biomass and wood combustion was the largest contributor to health impacts from residential buildings, largely driven by primary PM2.5 emissions (figures 1 and 2), but impact from this source decreased from 2008 to 2017. Gas use was the second-largest contributor to health impacts from residential buildings, largely driven by NH3 emissions (figures 1 and 2). The two main contributing emitted pollutants were NOx , which had peak impact in 2011, and PM2.5, which had peak impact in 2014 (figures 1 and 2).
3.2. Health impacts of other stationary sources
Other stationary sources generally had decreasing impact over time, roughly paralleling decreasing emissions (figures 3 and S1(b)). All industrial processes except for oil and gas production had decreasing impact over time, largely driven by reductions in SO2 and PM2.5 emissions (figures 3, 4 and S1(b)). The highest of these sectors—industrial processes not elsewhere classified—had a health burden of 16 000–20 000 excess mortality cases ($180—$230 billion) in 2008, which decreased to 12 000–14 000 mortality cases ($130—$150 billion) in 2017 (figures 5, 6 and table 3). Waste disposal impacts varied substantially year to year but stayed between 6900 and 11 000 mortality cases, mostly from changes in emissions of PM2.5 and NH3 (figures 3, 4 and table 3). Commercial cooking impacts consistently increased from 2008 to 2017, with 4800–8200 mortality cases ($53—$92 billion) in 2008, increasing to 7100–13 000 mortality cases ($80—$150 billion) in 2017 (figures 5, 6, S1(b) and table 3).
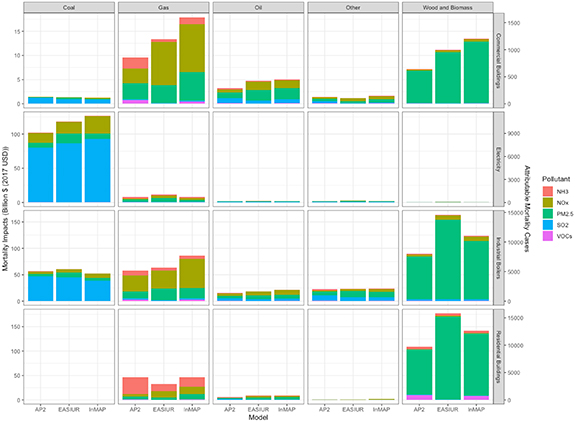
Figure 5. Mortality impacts of major fuel-combusting stationary source types, by model, emitted precursor pollutant, and fuel type, for 2017.
Download figure:
Standard image High-resolution image
Figure 6. Mortality impacts of major stationary source types with no fuel combustion listed, by model, emitted precursor pollutant, and fuel type, for 2017.
Download figure:
Standard image High-resolution image3.3. Trends over time
Agreement between RCMs tended to be the highest for major fuel combusting stationary sources, especially coal, and was higher in 2008 compared to 2017. From 2008 to 2017, disagreement between RCMs increased for all sources except Other Industry (table 1). InMAP tended to give the highest estimates—7 of 8 in 2008, and 5 of 8 in 2017; AP2 tended to give the lowest, providing the lowest values for 5 of the 8 sectors in 2008, and 7 of 8 in 2017 (table 1). The agreement between RCMs decreased from 2008 to 2017 for 14 of the 17 sector and fuel type combinations (table 2). For sectors that had coal as a fuel type, the percent difference between RCMs was between 13% and 19% (table 2). The percent difference between RCMs for gas, oil, biomass, and all other fuel types ranged between 29% and 46%, 23% and 35%, 45% and 55%, and 4.8% and 41%, respectively (table 2). There was lower agreement between the RCMs for the non-combustion sources, and less of a consistent pattern between models (table 3). AP2 or EASIUR tended to provide the lowest value, while the highest values were more evenly shared between RCMs. The percent differences also had a much wider range for these sources, especially for sources dominated by VOC emissions, since EASIUR does not provide estimates for VOCs (table 3) [11, 12].
Table 2. Range of mortality burden estimates from PM2.5 by source sector, RCM, pollutant, and year, for fuel combustion sources.
| 2008 | 2017 | ||||||||||||||
|---|---|---|---|---|---|---|---|---|---|---|---|---|---|---|---|
| Sector | RCM with highest health burden estimate | Highest mortality burden estimate (billion $ 2017 USD) | Highest mortality estimate | RCM with lowest health burden estimate | Lowest mortality burden estimate (billion $ 2017 USD) | Lowest mortality estimate | % Difference ((highest − lowest) /highest) | RCM with highest health burden estimate | Highest mortality burden estimate (billion $ 2017 USD) | Highest mortality estimate | RCM with lowest health burden estimate | Lowest mortality burden estimate (billion $ 2017 USD) | Lowest mortality estimate | % Difference ((highest − lowest) /highest) | |
| Biomass | Commercial buildings | InMAP | 2.6 | 230 | AP2 | 1.4 | 130 | 45 | InMAP | 13 | 1200 | AP2 | 7.2 | 640 | 47 |
| Coal | Commercial buildings | AP2 | 14 | 1300 | EASIUR | 11 | 990 | 22 | AP2 | 1.5 | 130 | InMAP | 1.3 | 110 | 14 |
| Gas | Commercial buildings | InMAP | 20 | 1800 | AP2 | 11 | 1000 | 43 | InMAP | 18 | 1600 | AP2 | 9.6 | 860 | 46 |
| Oil | Commercial buildings | InMAP | 29 | 2600 | EASIUR | 18 | 1600 | 37 | InMAP | 5 | 450 | AP2 | 3.2 | 290 | 35 |
| Other | Commercial buildings | InMAP | 1.4 | 120 | EASIUR | 1 | 92 | 26 | InMAP | 1.6 | 150 | EASIUR | 1.1 | 100 | 31 |
| Biomass | Electricity | EASIUR | 0.78 | 70 | AP2 | 0.38 | 34 | 52 | EASIUR | 0.72 | 64 | AP2 | 0.33 | 29 | 55 |
| Coal | Electricity | InMAP | 720 | 64000 | AP2 | 640 | 57000 | 11 | InMAP | 130 | 11000 | AP2 | 100 | 9100 | 19 |
| Gas | Electricity | EASIUR | 11 | 970 | AP2 | 8.5 | 750 | 22 | EASIUR | 12 | 1100 | InMAP | 8.1 | 730 | 31 |
| Oil | Electricity | EASIUR | 13 | 1100 | InMAP | 10 | 910 | 19 | EASIUR | 2.1 | 180 | AP2 | 1.6 | 140 | 23 |
| Other | Electricity | EASIUR | 2.3 | 210 | AP2 | 1.7 | 150 | 28 | EASIUR | 2.6 | 240 | AP2 | 1.8 | 160 | 31 |
| Biomass | Industrial boilers | EASIUR | 42 | 3800 | AP2 | 24 | 2100 | 43 | EASIUR | 160 | 15000 | AP2 | 90 | 8000 | 45 |
| Coal | Industrial boilers | AP2 | 210 | 19000 | EASIUR | 200 | 18000 | 5.2 | EASIUR | 61 | 5400 | InMAP | 53 | 4700 | 13 |
| Gas | Industrial boilers | InMAP | 140 | 12000 | AP2 | 86 | 7700 | 37 | InMAP | 87 | 7700 | AP2 | 58 | 5200 | 33 |
| Oil | Industrial boilers | AP2 | 52 | 4600 | EASIUR | 49 | 4400 | 4.5 | InMAP | 21 | 1900 | AP2 | 16 | 1400 | 27 |
| Other | Industrial boilers | EASIUR | 53 | 4700 | AP2 | 42 | 3700 | 21 | InMAP | 24 | 2100 | AP2 | 23 | 2000 | 4.8 |
| Gas | Residential buildings | AP2 | 55 | 4900 | EASIUR | 35 | 3100 | 36 | InMAP | 47 | 4200 | EASIUR | 33 | 3000 | 29 |
| Oil | Residential buildings | InMAP | 31 | 2700 | EASIUR | 27 | 2400 | 12 | InMAP | 9.2 | 820 | AP2 | 6.1 | 540 | 34 |
| Other | Residential buildings | InMAP | 3.4 | 310 | AP2 | 2.6 | 230 | 25 | InMAP | 1.6 | 150 | AP2 | 0.97 | 86 | 41 |
| Wood | Residential buildings | InMAP | 240 | 21000 | AP2 | 160 | 15000 | 31 | EASIUR | 180 | 16000 | AP2 | 110 | 9800 | 38 |
Table 3. Range of mortality burden from PM2.5 for other industry, supply chain, and commercial cooking sources, from 2008 to 2017.
| 2008 | 2017 | |||||||||||||
|---|---|---|---|---|---|---|---|---|---|---|---|---|---|---|
| Sector | RCM with highest health burden estimate | Highest mortality burden estimate (billion $ 2017 USD) | Highest mortality estimate | RCM with lowest health burden estimate | Lowest mortality burden estimate (billion $ 2017 USD) | Lowest mortality estimate | % Difference ((highest − lowest) /highest) | RCM with highest health burden estimate | Highest mortality burden estimate (billion $ 2017 USD) | Highest mortality estimate | RCM with lowest health burden estimate | Lowest mortality burden estimate (billion $ 2017 USD) | Lowest mortality estimate | % Difference ((highest − lowest) /highest) |
| Bulk gasoline terminals | AP2 | 4.8 | 430 | EASIUR | 0.06 | 5.3 | 99 | InMAP | 3.7 | 330 | EASIUR | 0.032 | 2.8 | 99 |
| Commercial cooking | InMAP | 92 | 8200 | AP2 | 53 | 4800 | 42 | InMAP | 150 | 13000 | AP2 | 80 | 7100 | 45 |
| Gas stations | AP2 | 22 | 1900 | EASIUR | 0.0079 | 0.7 | 100 | AP2 | 14 | 1200 | EASIUR | 0.0017 | 0.15 | 100 |
| Industrial processes—cement manuf | InMAP | 60 | 5400 | AP2 | 43 | 3900 | 28 | InMAP | 25 | 2200 | AP2 | 17 | 1500 | 32 |
| Industrial processes—chemical manuf | InMAP | 82 | 7300 | EASIUR | 65 | 5800 | 20 | InMAP | 62 | 5600 | AP2 | 48 | 4300 | 24 |
| Industrial processes—ferrous metals | EASIUR | 66 | 5900 | AP2 | 39 | 3500 | 40 | EASIUR | 42 | 3700 | AP2 | 25 | 2200 | 40 |
| Industrial processes—Mining | EASIUR | 33 | 2900 | AP2 | 20 | 1800 | 40 | EASIUR | 16 | 1500 | AP2 | 9.3 | 830 | 43 |
| Industrial processes—NEC | InMAP | 230 | 20000 | AP2 | 180 | 16000 | 22 | InMAP | 150 | 14000 | AP2 | 130 | 12000 | 15 |
| Industrial processes—non-ferrous metals | EASIUR | 49 | 4300 | AP2 | 43 | 3800 | 11 | EASIUR | 22 | 2000 | AP2 | 19 | 1700 | 12 |
| Industrial processes—oil and gas production | InMAP | 45 | 4000 | EASIUR | 8.6 | 770 | 81 | InMAP | 53 | 4700 | EASIUR | 14 | 1300 | 73 |
| Industrial processes—petroleum refineries | InMAP | 28 | 2500 | EASIUR | 22 | 2000 | 20 | InMAP | 17 | 1500 | EASIUR | 13 | 1200 | 25 |
| Industrial processes—pulp and paper | EASIUR | 45 | 4000 | AP2 | 28 | 2500 | 39 | EASIUR | 34 | 3100 | AP2 | 21 | 1900 | 37 |
| Industrial processes—storage and transfer | AP2 | 61 | 5500 | EASIUR | 30 | 2700 | 51 | AP2 | 42 | 3700 | EASIUR | 14 | 1300 | 65 |
| Waste disposal | AP2 | 120 | 11000 | EASIUR | 110 | 10000 | 5.6 | EASIUR | 110 | 10000 | AP2 | 77 | 6900 | 32 |
3.4. Current air pollution health impacts
In 2017, the highest contributing sectors were industry, industrial boilers, and residential heating, with electricity and commercial buildings both now dropping to 4th highest (table 1). In 2017, the impacts from industrial boilers were largely from PM2.5 emissions from biomass combustion, followed by both SO2 from coal and NOx from gas (figure 5). The highest contributor to the impact from residential heating in 2017 was emissions of mainly PM2.5 emissions from biomass and wood, followed by a mix of NOx , NH3, and PM2.5 emitted from gas (figure 5). Electricity impacts were still dominated by coal emissions, largely from SO2. Commercial building impacts were driven mainly by emissions of NOx , PM2.5, and some NH3 from gas, followed by PM2.5 from biomass (figure 5). For non-combustion stationary sources, the three sectors with the highest impacts were the other industrial processes (mainly from PM2.5 emissions), commercial cooking (entirely PM2.5 emissions), and waste disposal (mainly PM2.5 emissions) (table 3, figure 6).
The highest impact fuel type varied substantially by state in 2017. All three RCMs indicate that coal was the highest impact fuel in 12 states, biomass and wood in 24, and gas in 3 (figure 7), with model disagreement in 11 states. When broken down by source, in most states, coal is the highest contributor to electricity generation impacts, gas and biomass and wood are the highest contributors to impacts in both commercial buildings and industrial boilers, and biomass and wood are the highest contributor for residential buildings (figure 8).
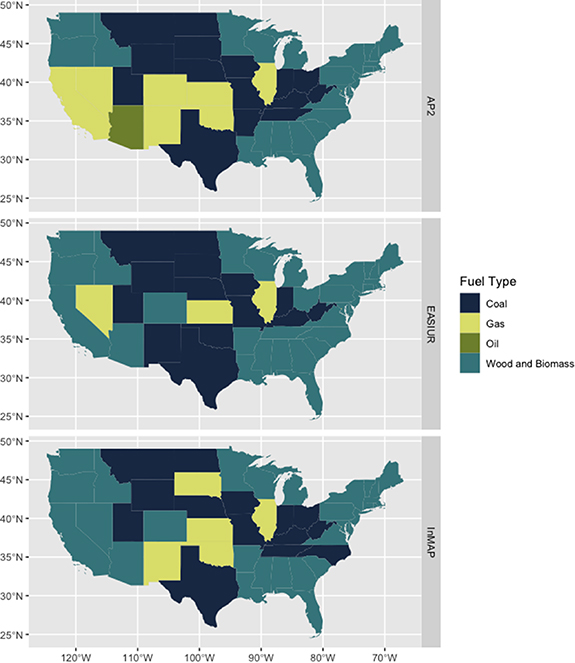
Figure 7. The combusted fuel with the highest public health burden from PM2.5 in 2017, by state, as indicated by each RCM.
Download figure:
Standard image High-resolution image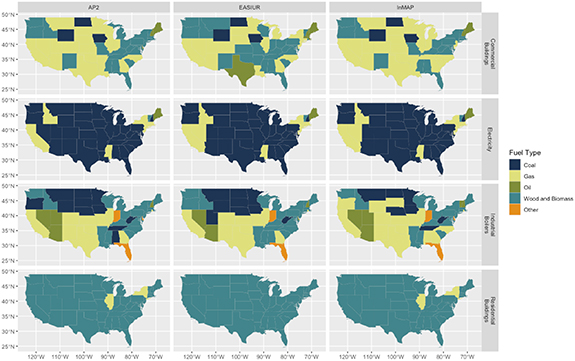
Figure 8. The combusted fuel with the highest public health burden from PM2.5 for each major sector in 2017, by state, as indicated by each RCM.
Download figure:
Standard image High-resolution imageThe highest impact non-combustion sector varied substantially between states—industrial processes not elsewhere classified had the highest impact in 11 states and waste disposal and commercial cooking were each highest impact in 5 states. The RCMs disagreed in 22 states (figure 9).
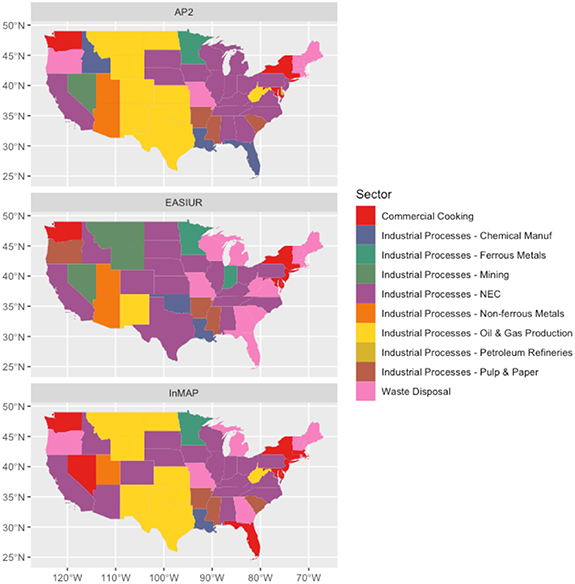
Figure 9. Non-combustion source with highest public health burden from PM2.5 in each state in 2017, as indicated by each RCM.
Download figure:
Standard image High-resolution image3.5. The change in health impacts due to the transition from coal to gas and biomass
Across sources, the total mortality impacts of coal have decreased substantially from 2008 to 2017. While trends in impacts of gas combustion varied across sources, total health impacts from gas were slightly lower than that of coal in 2017, with the two essentially converging in 2018 (table 2, figure 10). In 2018, health impacts from coal are projected to be $150-$170 billion, while gas impacts are projected to be $130-$170 billion (figure 10), with InMAP projecting that health impacts from gas exceed that of coal. Between 2008 and 2017, impacts from coal dropped substantially in commercial buildings, industrial boilers, and electricity, and were negligible in residential buildings. Gas impacts remained roughly constant in buildings and electricity, but decreased in industrial boilers (figure 11). The state-level projections, when compared with impacts based on historical data from the NEI, perform better at a national level compared to state level. On an aggregate national level, projection errors range between ∼76% underestimation and ∼88% overestimation (figure S2), while projection errors for state-level health impacts range between ∼100% underestimation and ∼390% overestimation, for coal, gas, and biomass and wood (figures S3 and S4).

Figure 10. Historical and projected mortality impacts of PM2.5-related emissions from coal, gas, and wood and biomass consumption, in the energy consuming sectors — residential buildings, commercial buildings, industry, and electricity — from 2008 to 2018, in the U.S.
Download figure:
Standard image High-resolution image
Figure 11. Historical and projected mortality impacts of PM2.5-related emissions from coal, gas, and wood and biomass consumption, by sector, from 2008 to 2018, in the U.S.
Download figure:
Standard image High-resolution imageHealth impacts modeled using the CAMD dataset are lower than those using the NEI, in part due to NEI having more comprehensive coverage of electricity generation emissions (figure 12) [10, 15]. Nevertheless, CAMD results do indicate a further decrease in 2018 and 2019 in health impacts from coal-fired power plants emissions, supporting the results from our state-level projections. All three RCMs indicate that gas had higher health impacts than coal in 8 states in 2008, and that number increased to 20 in 2017, largely on the eastern and western coasts of the U.S. (figure 13). In 2017, emissions from gas combustion had higher impact than those from coal in all 48 states, the District of Columbia, and land currently controlled by Indigenous Americans for residential buildings, 45 states for commercial buildings, 29 states for industrial boilers, and 10 states for electricity (figure 14). Across fuel types and major fuel combusting sources, the RCMs results were within a factor of 2 to an order of magnitude of each other, and this was consistent across county to state to nationwide levels of aggregation (figures 15, 16, and S7).

Figure 12. Total mortality impacts of PM2.5 from coal and gas combustion, using the U.S. EPA National Emissions Inventory from 2008 to 2017, and the Clean Air Markets Database from 2008 to 2019.
Download figure:
Standard image High-resolution image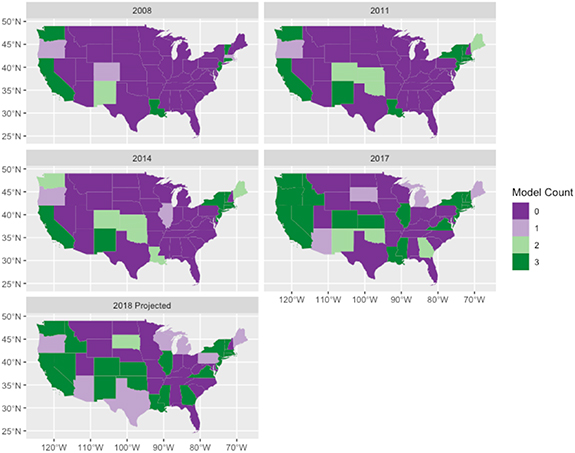
Figure 13. Changes over time in model agreement on mortality impacts of PM2.5 from gas combustion emissions compared to coal combustion emissions, from 2008 to 2018, by source state.
Download figure:
Standard image High-resolution image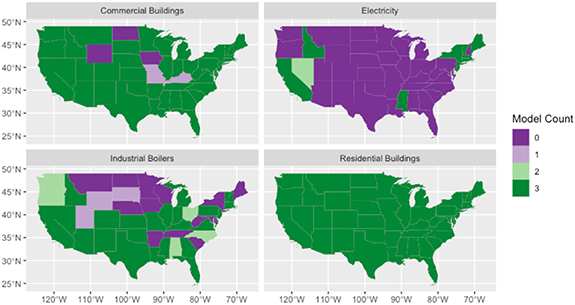
Figure 14. Model agreement on mortality impacts of PM2.5 from gas combustion emissions compared to coal combustion emissions, by source state and source type, in 2017.
Download figure:
Standard image High-resolution image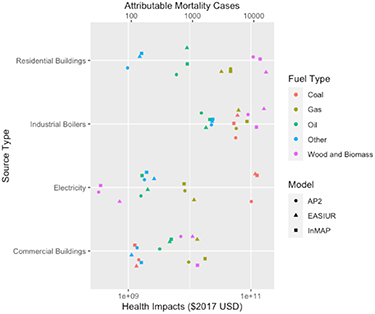
Figure 15. Total mortality impacts of PM2.5 from major fuel combusting stationary sources in the U.S., in 2017, by fuel type and model.
Download figure:
Standard image High-resolution image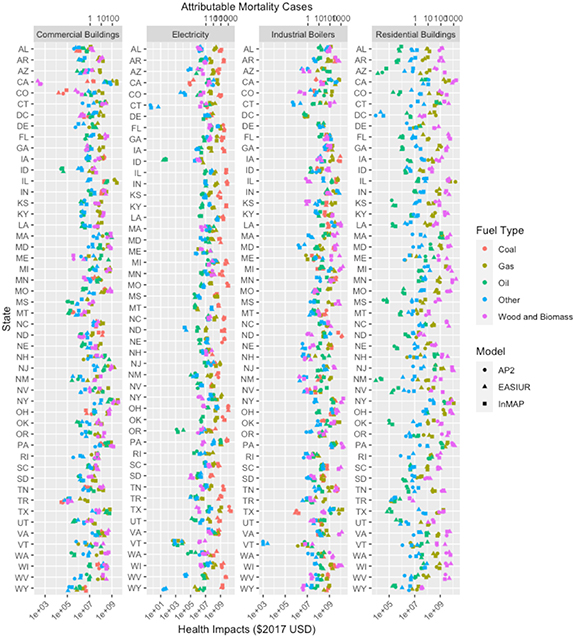
Figure 16. State-level mortality impacts of PM2.5 from major fuel combusting stationary sources in the U.S., in 2017, by fuel type and model.
Download figure:
Standard image High-resolution image
4. Discussion
Here, we show substantial changes in the contributions to mortality impacts from stationary sources of PM2.5 in the U.S. between 2008 and 2017. The transition from coal to gas and biomass has changed the compositional mix of emissions that contribute to PM2.5 across the U.S. and the subsequent health burdens (figure S1, tables S5 and S6). In 2008, the biggest contributor to health impacts from PM2.5 exposure was coal combustion for electricity generation, largely from SO2 emissions. In 2017, a variety of sources, fuels, and pollutants from more distributed nonpoint sources have proportionately much larger contributions to health impacts. The greatest contribution coming from biomass and wood combustion in residential and commercial buildings, along with industrial boilers, and other industry sources. The impacts of coal dropped below the impacts of biomass and wood in 2017, and were just above that of gas. Impacts from residential buildings and industrial boilers now exceed that of electricity. Our state-level projections indicate these trends may have continued, with biomass impacts increasing in 2018, and total impacts of coal dropping below that of gas.
At the state level, biomass and wood combustion has supplanted coal as the leading sources of mortality impacts from fuel combustion in many states. While coal is still the highest impact fuel for electricity in many states, gas and biomass are the highest fuel for commercial buildings and industrial boilers in many states. Biomass and wood is the highest impact fuel in residential buildings in most states. In 2017, total impacts from mortality from PM2.5 exposure have surpassed coal in 20 states and has surpassed or is near equal to coal in all sectors except electricity. With continuing retirement of coal-fired power plants, the continued growth of gas and biomass, these trends are likely to continue.
The RCMs had quite good agreement for source categories characterized by large coal-combustion sources with high SO2 emissions, and generally higher agreement in 2008 than in 2017. As emissions from these sources decreased with time, the models began to diverge. This is consistent with a recent intercomparison of the RCMs which found much higher agreement for SO2 than for NOx and NH3 [11]. The temporal pattern in model disagreement that we find here may be due to the growing relative role of NOx , NH3, VOCs, and to an extent, primary PM2.5 emissions, since the RCMs have more disagreement for these pollutants [11]. Our model framework scales linearly, so the implications of alternative values for parameters, such as the CRF for PM2.5 exposure and the VSL can also be explored by scaling linearly. For total impacts of source categories, the RCMs were within a factor of 2–10 of each other. This made them able to provide clear differentiation of impacts between fuels for residential buildings and electricity, but less so for commercial buildings and industrial boilers.
While our study does evaluate the public health impacts of combustion of gas and coal, it is not a comprehensive life cycle assessment or health impact assessment. It does not include any health impacts of direct ozone or NO2 exposure, morbidity impacts related to PM2.5, ozone, or NO2 like respiratory hospitalizations and birth outcomes, or localized health impacts from hazardous air pollution emissions from fuel extraction processes or combustion [4, 20–28]. It does not include impacts to climate change, including methane leaks across the gas supply and distribution chain [29–33], or carbon cycling with biomass [34–37]. Furthermore, it does not include health impacts of indoor exposures, including unvented gas combustion from cooking, indoor gas leaks, or indoor exposure to wood smoke [33, 38]. This analysis implicitly holds population constant, and while this allows the effects of emissions changes on health impacts to be isolated from the effect of population growth and aging, it may result in our estimates in later years to be underestimated. Additionally, since the RCMs demonstrate more disagreement in future years, and more disagreement with more disaggregated sources, they may need to be updated to continue to provide reliable results. Since emissions of primary PM2.5, NOx , NH3, and VOCs are playing a much more important role in the total health impacts of air pollution in the U.S., future iterations of RCMs, or models that can be used similarly such as CMAQ direct decoupled method, may be well-served by paying more attention to these pollutants. There is uncertainty to all elements of the chain of this analysis, from emissions, to pollutant transport, to health impacts of exposure and underlying health status. Our results show that the role of sources where emissions are monitored, especially large electricity generators, is shrinking, and that smaller, distributed sources where emissions are estimated based on activity and emissions factors—buildings and industrial facilities, now have a larger share. This indicates that there may be some value in expanding emissions monitoring efforts or improving methods in how emissions inventories are estimated.
This study demonstrates that the RCMs are useful for retrospective research on health benefits of emissions reductions, and that there is value in using all three [11], especially since the RCMs have varying performance when compared to CMAQ, which can depend on source sector [14]. Use of RCMs can allow more systems research exploring interactions between energy choices, air pollution, and health, and for health to be more explicitly integrated into energy policy design [9, 19]. This simplification does come at a cost of not being able to characterize the substantial degree of interstate transport of pollution [39]. We also show that the state-level projection method developed here can be used to make reasonable projections of emissions and health impacts based on energy consumption data. Despite the large projection error range, the medians of projection errors are smaller than about 44% overestimation and 53% underestimation, across all sectors for coal, gas, and biomass and wood. The discrepancies between our projection and estimates directly from the NEI could be due to increasing combustion efficiency, filtration, increasingly stringent environmental regulations, fuel blending, or preferential retirement of high-emitting or high-impact sources, which cannot be captured by our projection method. The projections tend to be less precise when the emissions change by different proportions.
Our results indicate that the U.S. may have transitioned to a substantially different regime in terms of leading contributors to health impacts of PM2.5 exposures from stationary sources. Reductions in SO2 emissions, largely from electricity generation from coal, have led to a much more mixed picture of contributors to PM2.5 exposure and health impacts. In 2017, biomass combustion in industrial boilers, residential combustion of wood, the remaining coal-fired electricity generation, and gas combustion in buildings industrial boilers, and electricity now all have much more similar shares of health impacts from PM2.5 exposure—all within roughly the same order of magnitude. With decreases in these high-impact stationary sources, this indicates that transportation emissions could now have a larger proportion of total air pollution health impacts [39]. While we show that there have been gains to public health from the reduction in coal emissions, we also demonstrate that replacement of coal with gas and biomass is not impact-free. Despite reductions in the combustion emissions rate from replacing coal with gas, there are still substantial and growing public health impacts from gas combustion. Similarly, despite the U.S. classifying biomass as a renewable energy source [1], there are still substantial health impacts from biomass. While greenhouse gas (GHG) neutrality of biologically derived fuels—wood-derived fuels, biodiesel, ethanol, renewable natural gas, and others—is often evaluated and considered as part of their implementation decision-making, this work indicates that health impacts of combustion should as well [35–37].
The increasing role of gas and biomass and wood emissions in the health burden of PM2.5 exposure indicates that swapping one air pollution-emitting fuel source for another is not a pathway to a healthy energy system. Our work demonstrates that health can be considered in energy decisions, health and energy policy are inextricably linked, and that inclusion of health in energy policy may be necessary for true primary prevention of a large portion of disease burden in the U.S. New energy infrastructure that is installed now will likely be operational for decades—likely 'locking in' their health impacts along with their GHG emissions for decades [40–42]. This means that deployment of zero-emission renewable energy sources now may be necessary to continue on a path toward a healthy energy system, and to avoid changes to the energy system that will become 'regrettable assets' in the future [40–42].
Acknowledgments
This work was supported by the Rocky Mountain Institute and the Login5 Foundation. We would like to thank Brady Seals at RMI for her comments on earlier drafts.
Data availability statement
All data that support the findings of this study are included within the article (and any supplementary files).