

Abstract
The 187 million hectares of pasturelands in Kazakhstan play a key role in the nation's economy, as livestock production accounted for 54% of total agricultural production in 2010. However, more than half of these lands have been degraded as a result of unregulated grazing practices. Therefore, effective long term ecological monitoring of pasturelands in Kazakhstan is imperative to ensure sustainable pastureland management. As a case study in this research, we demonstrated how the ecological conditions could be assessed with remote sensing technologies and pastureland models. The example focuses on the southern Balkhash area with study sites on a foothill plain with Artemisia-ephemeral plants and a sandy plain with psammophilic vegetation in the Turan Desert. The assessment was based on remotely sensed imagery and meteorological data, a geobotanical archive and periodic ground sampling. The Pasture agrometeorological model was used to calculate biological, ecological and economic indicators to assess pastureland condition. The results showed that field surveys, meteorological observations, remote sensing and ecological models, such as Pasture, could be combined to effectively assess the ecological conditions of pasturelands and provide information about forage production that is critically important for balancing grazing and ecological conservation.
Export citation and abstract BibTeX RIS
1. Introduction
In Kazakhstan approximately 187 million hectares, about 70% of its total land area, are used as pasturelands for sheep and cattle grazing [1]. The economic value of pasturelands is immense in Kazakhstan, as livestock production accounted for 54% of total agricultural production in 2010. However, a large proportion of these lands (60%) are being degraded due to unregulated livestock grazing [1, 5, 11]. Regular monitoring and ecological assessment of these pastures should be restored to provide a sustainable foundation for livestock grazing as a means to preserve natural vegetation cover, rehabilitate degraded lands and re-vegetate the desert areas with the potential to produce haloxylon forests. The large area of pasturelands is of special interest in the context of possible efforts to reduce greenhouse gas emissions to the atmosphere and increase carbon sequestration in natural ecosystems to mitigate climate change. There is a significant need to develop more effective monitoring and assessment tools for these pasturelands that can be broadly applied in Kazakhstan. Existing assessment methods in Kazakhstan are solely based on detailed field level analysis as outlined by the Republic of Kazakhstan Agency for Land Management [1]. Effective monitoring and assessment of pasturelands should be based on a combination of advanced methods and technologies, including ground, landscape and ecological studies, complemented by remote sensing and GIS technologies integrated with ecological models. There is an example of a national scale effort to systematically monitor pasturelands with field observations and remote sensing being made in Australia [2, 3], but a similar endeavor is lacking in Kazakhstan. Therefore, the objective of this paper is to demonstrate how remote sensing technologies, ground level monitoring and assessment protocols, and ecological models could be combined to effectively assess the pastureland conditions in Kazakhstan.
2. Methods
2.1. Study site
This study is focused on the territory of the southern Balkhash region enclosed by the polygon in figures 1 and 2 with a total area of 650 thousand hectares (∼0.4% of total pasturelands in Kazakhstan). The study area is bounded by the longitudes 75°30' and 76°15' east and latitudes 44° and 45° north, and is located within the Zhambyl, Balkhash and Ili administrative districts of the Almaty Oblast. Natural landscapes within this study area include the hummocky-ridged sandy Taukum, the shallow-sloped hilly sandy desert of the Sarytaukum, the sandy low hills of the old valley of the Ili river, foothill ridged plain with serozem soils, foothills with a slightly ridged plain and light serozem soils, and the current valley of the Ili river with brown meadow soils, light loamy and sandy loam soils, which become saline at the valley periphery (http://expat.nursat.kz/?3295).

Figure 1. Location of the study site south of Lake Balkhash in southeastern Kazakhstan. Copyright © Esri and its data provider. All rights reserved.
Download figure:
Standard image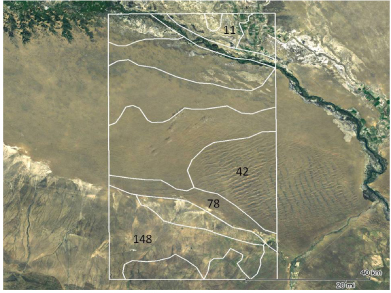
Figure 2. Geobotanical divisions of the study site. The numbered geobotanical units are described in table 2. Copyright © Esri and its data provider. All rights reserved.
Download figure:
Standard imageAccording to the botanical–geographical mapping of Kazakhstan [4], the territory under study belongs to the Balkhash sub-province of the Aral-Balkhash desert province of the northern deserts in the Turan Lowland. The dominant vegetation of the northern outlying districts of the Taukum sandy tract is Haloxylon. Naturally, Haloxylon persicum Bunge ex Boiss. & Buhse, grows on the ridge tops while H. aphyllum (Minkw.) Iljin grows on the lower sides of sandy slopes and depressions between the hills. Here and there, H. aphyllum is dense enough to form a saxaul forest.
The vegetation of the southeastern part of the sandy massif (Sarytaukum sands) is characterized by a significant diversity. Here shrub associations are numerous on high sandy ridges, such as Agropyron fragile (Roth) P. Candargy, Eurotia, Artemisieta, Ephedra, etc. In comparison, Ephedreta associations occur on slopes of sandy ridges while Eurotia are common on low-level sands. Several ephemerals and ephemeroids accompany shrub dominants and establish independent associations on this sandy massif.
Within the area of the present-day Ili river valley the most typical elements are flood-plain forest (tugais), mesoxerophytic shrubs and meadows. Trees and shrubs (Elaeagnus, Salix, Populus, Tamarix, Halimodendron) form occasional thickets together with communities of Phragmites and Calamagrostis. Within the range of the ancient Bakanas takyr plain adjacent to the Ili river valley in the north, the major elements of the landscape are H. aphyllum (Minkw.) Iljin with sagebrush, and saltwort with Krascheninnikovia ceratoides (L.) Gueldenst, which alternate with irrigated lands of rice.
In the foothill hillocky-ridged plain, widespread Artemisieta associations occur. Saltworts (Ceratocarpus utriculosus Bluk. ex Krylov, Girgensohnia oppositiflora (Pall.) Fenzl), ephemerals (Poa bulbosa L., Eremopyrum orientale (L.) Jaub. & Spach, Carex pachestylis, Alyssum desertorum Stapf) and herbaceous species (Medicago medicaginoides (Retz.) E. Small, Dianthus, Acanthophyllum pungens) occur here to different extents. Most often Artemisia sublessingiana Krasch. ex Poljakov is observed on the tops and slopes of the undulating foothills. The flatter areas are covered with Artemisieta–saltwort vegetation. The canopy of the desert part of the sub-mountain plain is almost fully replaced by annual saltworts, with Agropyron fragile (Roth) P. Candargy and ephemeral grasses.
The pastures of the foothill plain and Ili river valley are moderately grazed in most areas, but intensively grazed at some sites. The pastures of the sandy deserts have been moderately stocked with livestock in the past, but only lightly stocked in recent years. Commercial use of pastures located far from settlements, especially in the Taukum and Sarytaukum sandy areas, is very limited due to insufficient water supply. According to field measurements made in 2008 at the study area, only 20 out of 106 (19%) available water sources for the livestock were operational [16]. The average proportion of land with available water on these pastures is 0.12.
Unregulated use of pastures contributed to the changes in vegetative cover. According to the lead author's observations the greatest change occurred in desert vegetation on the foothill plain. The spring-and-summer tall grasses and spring–summer–autumn shrubby vegetation were reduced significantly. The short grasses increased mainly with annual saltwort with Ceratocarpus utriculosus Bluk. ex Krylov dominating. In some ungrazed areas restoration of wormwood was observed. In the sandy desert, the number of large shrubs was reduced significantly, in particular Haloxylon (saxaul), whereas Artemisia terrae-albae Krasch and Bassia prostrata (L.) Beck are more common now. In general, the total biological productivity of pastures was not reduced significantly; however, reductions in forage productivity are quite evident.
Affected by both natural and anthropogenic factors, vegetation cover in deserts is heterogeneous and sparse, and presents seasonal and inter-annual fluctuations. Vertically, it has 2–3 layers of seasonal vegetation: short ephemeral grass with 10–20 cm height (spring vegetation), tall grass (50–100 cm), mainly large grasses (spring–summer vegetation), semi-shrubs and semi-bushes 30–70 cm high (spring–summer–autumn vegetation), bushes 70–120 cm high (late spring–summer–autumn vegetation) and large bushes or woody plants 250–300 cm high (summer–autumn). The woody components are not part of consumable forage if they do not produce edible forage. The projected vegetation cover change depends on the agrometeorological conditions of the year and the location in the landscape, tending to fall in the following ranges: 10–25% on takyr and saline soils, 20–50% on sand, 70–80% on foothill ephemeral plains (spring), 80–90% in the river valleys (summer). All these factors cause a number of complexities for establishing regular and operational monitoring and assessment of pastures and require the development of more effective ways of assessing the ecological conditions in the region.
2.2. Approach
The approach used for pasture monitoring and assessment studies in the Balkhash region included three main phases: background information collection, remote sensing and assessment with agrometeorological models. The first phase, background information collection, was to develop base maps of vegetation in the study area. These maps served as a basis for the development of guidelines for ecological and economic pasture management and delineation of study areas. The basic pasture delineation was based on the pasture type, which was integrated into the vegetative aggregation (geobotanical unit). Each type of pasture vegetation appeared to be geographically bound to specific natural landscapes (geographical units). Therefore, separate allotments (sites) or areas in the pasture maps are referred to as landscape–geobotanical units. These vegetation maps also contained information for each type of pasture on the availability of vegetation of several plant associations. In addition to the pasture information, geobotanical data were also obtained and subsequently used for our analysis, including archived geobotanical data from field studies performed in the Balkhash region in the early 1990s by the Republic of Kazakhstan Land Management Agency. Large-scale landscape boundaries were also specified on-site, based on 250 m resolution MODIS reflectance images (Product MOD09) acquired in 2006 from the Terra satellite and semi-coincident photos of the Balkhash region from Google. This background information along with field observations in the area during the 2007 (wet) and 2008 (dry) growing seasons was used to assess vegetation cover (figure 3) in the study area.
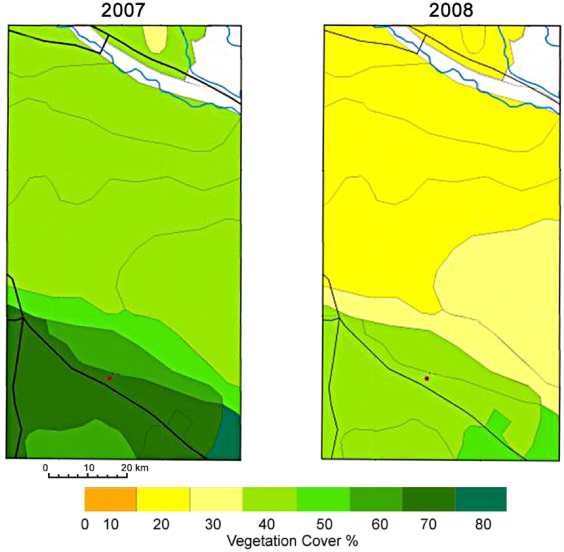
Figure 3. Average cover by geobotanical division of the study area in 2007 and 2008.
Download figure:
Standard imageThe second phase of the study was to analyze remotely sensed images over the study area to assess the potential for remote sensing to provide pastureland information necessary for management decisions. Recent pasture studies based on remote sensing in various regions by different authors demonstrate the possibility of obtaining a number of soil and vegetation cover characteristics [5–9]. To link remote sensing images with pastureland information, field surveys were made from 2006 to 2008 to collect data on 30 m × 30 m and 250 m × 250 m sites. The data contained information about the species structure of the vegetation, phenological development, the bioecological condition of the plants, vegetation height and projected cover of soil and the dynamics of biomass accumulation. For estimation of biomass we used a method employing quadrats and model shrubs [15]. The quadrats (1 m × 1 m or 2 m × 2 m) sampled 3–4 units for every type of plant to represent vegetation on the 250 m × 250 m sites. The area for every plant type was also estimated. At the same time, at each of our field study sites, spectral measurements were made on 1 m × 1 m and 2 m × 2 m plots with a multispectral Crop Scan (MSR-16) radiometer so that the spectral data were paired up with field vegetation measurements for assessing remote sensing suitability for pastureland information extraction in Kazakhstan, as used in previous studies [5–9]. To further assess the remote sensing suitability for pastureland assessment and validate field based remote sensing methods, aerial spectrometer surveys of pastures were also made to allow a considerably greater amount of data but also as a way to reduce labor-intensive fieldwork, resulting in a time series of digital pasture images from aircraft based sensors. These aerial spectrometer data over homogeneous pasture vegetation were collected quasi-simultaneously at different vegetation heights from Earth's surface, using the same spectral radiometer (Crop Scan) installed in a helicopter.
The third phase was to use a well calibrated agrometeorological model, Pasture, to assess the ecological conditions of pasturelands in the study area [10]. Numerous studies in the past indicated a promising potential to use models for pastureland assessments [11–14]. In this study, we used the Pasture [10] model that was previously calibrated and validated in Kazakhstan to assess the ecological conditions of the Balkhash region. The estimation of agroclimatic conditions favorable for pasture vegetation was based on the observed data from the Ajdarly (N44°08', E75°51') and Bakanas (N44°50', E76°16') meteorological stations. The moisture availability for the growing period depends on natural rainfall and the moisture indicator, WI, which is calculated using the following formula:

where Ws (mm) is the soil moisture to 100 cm depth during a 10 day spring period with an air temperature of 3–5 °C, R(t) is the rainfall accumulated during decade t of the warm period (mm), a is a normalization coefficient, and D is the accumulated atmospheric water vapor deficit during decade t of the warm period in kPa. The warm period (season) is defined here as number of days from spring with air temperature + 3–5 °C to autumn + 3–5 °C. The spring moisture is defined as the difference between soil water content and calculated values based on precipitation for the cold period (from autumn + 3–5 °C to spring + 3–5 °C). For most types of plant the optimal WI is ≥ 0.80 volume. The critical WI volume is <0.80 (ephemerals) and <0.30–0.40 for more subshrubs and summer grass, when plants begin to dry.
The 2007 season was characterized by relatively high WI values in spring and early summer and rather low air temperatures for all zonal pasture plants growth. Optimal moisture and heat conditions for vegetative development of plants were observed during 50 days for spring grasses and 70 days and more for cereals and semi-shrubs. The total probability of years with such weather conditions favorable for pasture vegetation amounts to 25–30% in the Balkhash region. In 2008 there was a drought, with only 30 favorable days for spring grasses and 40–50 days for grasses and semi-shrubs. The probability of years with insufficient moisture limiting plant development in the Balkhash region is estimated at 70–80%.
For shrubs with roots capable of capturing water resources in the desert, the limiting environmental factor was warmth in the spring. The intensive spring frosts with temperatures of minus 5–7 °C in late April 2008 damaged young sprouts of thermophilic bushes—Calligonum and Ammodendron argenteum—and delayed their further development, as well as affecting the survival potential of young regrowth and seed production. The probability of intensive spring frosts that can significantly affect accumulation of pasture plant biomass is relatively low, amounting to 7–10%.
Monitoring of the pastures was primarily based on the MODIS data (MOD 09) for 2007–8. Image processing analysis included geometric and atmospheric correction, geo-registration and calculation of NDVI values. Modeling of forage production on pastures was carried out using the Pasture agrometeorological model, which was developed earlier in Kazakhstan [10, 11] with preliminary parameterization based on data collected at the field study sites. This model was developed and validated for Kazakhstan in previous work [10, 11] and in this paper we simply used the model to assess the impacts of management practices on pastureland productivity. The model describes agrometeorological conditions of plant growth, biomass accumulation dynamics such as photosynthesis during the growing season, its preservation and destruction. Generally, the model can be described by the following equations [10, 11]:


where Bt is the biomass (annual increment), t/ha; Rt is the plant growth parameter, dimensionless; Bm is the maximum biomass for the vegetative period under optimum conditions, t/ha; Fp is the photosynthesis product for vegetative period, in g CO2 per g green biomass (on a dry weight basis); Bo is initial biomass, t/ha; J is the photosynthetically active radiation (PAR), J m−2 s−1; Co is the CO2 concentration in the atmosphere; Rm is a growth parameter under optimal environment conditions, dimensionless; T is the air temperature, °C; WI is the moisture sufficiency for plants, dimensionless; B't is biomass decay, t/ha; bt is the biomass decay rate factor, dimensionless; t is the time from the beginning of vegetation growth, days.
In the Balkhash region we used empirically derived values of Rm and Bm as model parameters. The Rm parameter, assumed to be a constant biological parameter of pasture plant growth, was estimated for the dominant plants (species) on the basis of multi-year, long term agrometeorological data and geobotanical field stationary observations collected in the 1960s–1980s for the conditions of Kazakhstan deserts. Figure 4 presents curves of the Rm growth parameter for several dominant species, based on data collected in the Balkhash region in the sandy and foothill clay desert.

Figure 4. Dynamic Rm for shrubs in five day averages for time τ. (1) Haloxylons, (2) calligonums, (3) eurotias and (4) astrogals.
Download figure:
Standard imageThe Bm parameter, a rather variable bio-geographical parameter, was estimated during the identification process for each landscape–geobotanical unit depending on the community structure, local climate potential, pasture stocking load and other environmental factors. The Bm parameter characterizes the potential annual increment in aboveground biomass by photosynthesis at that specific location. The Bm values were obtained through model inversion. The initial information for Bm estimates was seasonal values of the green vegetation cover (CV) %, estimated from MODIS images; the meteorological information for 2006–8, data on plant amount from the legend to landscape–geobotanical units of the pasture map.
The Pasture agrometeorological model calculates the annual increment of the aboveground biomass Bt for a pasture in a particular year. It requires the quantitative parameters Rt and Bm, as well as agrometeorological data, and maps of species composition and the amount of vegetation. Estimates of biomass were made for specific landscape–geobotanical units. Each aggregation was represented by the main dominant species with availability of at least 8% in total grass amount.
3. Results and discussion
The results of the study show that using remote sensing it is possible to collect informative indicators of pasture condition such as vegetation cover of soil and aboveground green biomass. Figure 5 shows the empirical relationship of vegetation cover to the normalized difference vegetation index (NDVI). Figure 6 shows the empirical relationship between biomass and cover, which was then used to estimate biomass with remotely sensed NDVI estimates across the larger pastures in the study area.
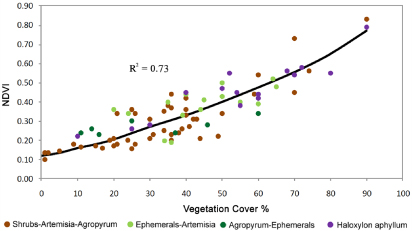
Figure 5. Correlation between NDVI and green vegetation cover (%). Field measurements of cover were from 30 May 2007; 7 August 2007; and 7 and 13 May 2008. (1) Shrubs–artemisia–agropyrum, (2) ephemerals–artemisia, (3) agropyrum–ephemerals and (4) haloxylon aphyllum.
Download figure:
Standard image
Figure 6. Correlation between vegetation cover (%) and ground biomass (t/ha) for the sandy desert. Field measurements of cover were from 24–26 July 2006; 20–22 May 2007.
Download figure:
Standard imageThe data for 2007–8 permitted confirmation of the NDVI differences observed between aerial and ground based data at altitudes of up to 500 m. Table 1 presents some results of air-spectrometer surveys of pastures carried out from different heights in weather conditions similar to the conditions when the satellite images were acquired.
Table 1. Median NDVI for a sandy geobotanical unit (N78) resulting from an aerial survey at various heights. The weather was stable and the Sun angle was ≥48°.
| Altitude from Earth's surfacea (m) | |||||
|---|---|---|---|---|---|
| Survey date | 100 | 200 | 300 | 400 | 500 |
| 28 May 2007 11:30 AM–11:48 AM | 0.173 | 0.170 | — | 0.162 | — |
| 13 August 2008 11:48 AM–12:02 PM | 0.146 | — | 0.138 | — | 0.135 |
aThe altitude above sea level of the survey area ranged from 403 to 464 m.
Statistical correlation analysis (not shown here) suggested that the NDVI dynamics corresponded well with the dynamics of the moisture availability indicator, WI, estimated from meteorological observations and the seasonal dynamics of green vegetation availability. These calculated relationships allowed the calculation of Bm values for all pasture units. Table 2 lists generalized Bm values calculated for some dominants and subdominants in the vegetation community at separate sites for 2006–8.
Table 2. Maximum biomass, Bm, t/ha, calculated for dominant plants based on MODIS imagery and meteorological data for some landscape–geobotanical units.
| Bm, t/ha by pasture grazing intensity | |||
|---|---|---|---|
| Landscape–geobotanical units of map scale 1:1 000 000 | Dominant plants | Moderatea | Heavyb |
| N 148 | Artemisia terrae-albae Krasch. | 0.082 | 0.050 |
| Ephemerals–subshrubs–grass on foothill plain | Artemisia turanica Krasch. | 0.040 | 0.020 |
| Krascheninnikovia ceratoides (L.) Gueldenst. | 0.086 | 0.030 | |
| Bassia prostrata (L.) Beck | 0.070 | 0.040 | |
| Ceratocarpus arenarius L. | 0.147 | 0.090 | |
| Peganum harmala L. | 0.060 | 0.065 | |
| Ephemeral spring group | 0.260 | 0.260 | |
| Calligonum aphyllum (Pall.) Gürke | 0.123 | 0.090 | |
| N 78 Ephemerals–shrubs on degraded sandy areas | Krascheninnikovia ceratoides (L.) Gueldenst | 0.068 | 0.045 |
| Ammodendron argenteum (Pall.) Kuntze | 0.040 | 0.022 | |
| Artemisia terrae-albae Krasch. | 0.052 | 0.035 | |
| Agropyron fragile (Roth) P. Candargy | 0.036 | 0.032 | |
| Summer group | 0.038 | 0.024 | |
| Ephemeral spring group | 0.200 | 0.190 | |
| N 42 Shrubs–mid-shrubs–grass on sandy plain with high dunes | Calligonum aphyllum (Pall.) Gürke | 0.119 | — |
| Ammodendron argenteum (Pall.) Kuntze | 0.400 | — | |
| Bassia prostrata (L.) Beck | 0.090 | — | |
| Agropyron fragile (Roth) P. Candargy | 0.033 | — | |
| Artemisia terrae-albae Krasch. | 0.033 | — | |
| Artemisia scoparia Waldst. & Kitam. | 0.035 | — | |
| Ephemeral spring group | 0.120 | — | |
| N 11 Haloxylon–ephemeral plants on delta plain of Ili River | Haloxylon aphyllum (Minkw.) Iljin | 0.690 | — |
| Salsola orientalis S. G. Gmel. | 0.120 | — | |
| Krascheninnikovia ceratoides (L.) Gueldenst | 0.060 | — | |
| Artemisia terrae-albae Krasch. | 0.040 | — | |
| Summer group | 0.055 | — | |
| Ephemeral spring group | 0.330 | — | |
aModerate grazing if cattle use < = 60% from all biomass on the pasture. bHeavy grazing if cattle use > = 75–80% of all biomass on the pasture.
As a way of validating the model, the outputs of the Pasture model were compared with some field based measurements. Here we used observations from experimental sites of 500 m × 1250 m from the 2006–8 seasons, including 34 250 m × 250 m plots located on high-hill sandy Taukum, small-hill Sarytaukum and foothill areas. The differences between the simulated and measured data ranged from 0.042 to 0.084 t/ha, or 17 to 32%.
As an example, figure 7 shows the estimated seasonal consumable aboveground biomass for the 2007 growing season of different landscape–geobotanical units, estimated by the Pasture model with in situ meteorological data. Given the forage value of pasture plants one can estimate the seasonal pasture forage stock. Livestock loading on pastures for the vegetative period of year τ can be estimated by the following equation:

where E is the load of livestock on pasture, head/ha; F is the amount of pasture forage, forage units/ha; S is the area of grazing site, hectares; F' is the animal requirement of forage, forage unit/day; N is the grazing duration, days. Pasture forage (F) can be estimated from biomass and the protein content of the pasture plants consumed by animals.
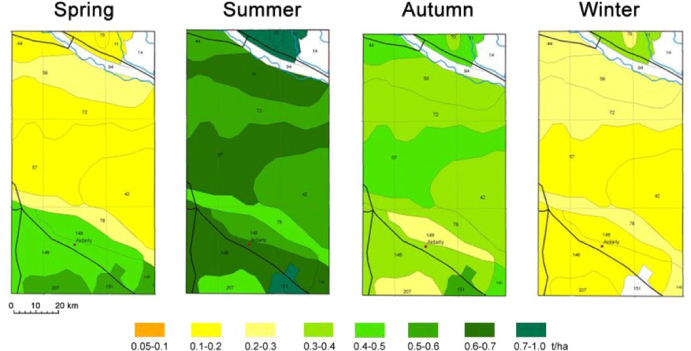
Figure 7. Modeled seasonal pasture production (t/ha) for geobotanical units across the study area in 2007.
Download figure:
Standard imageBalancing forage production and consumption is an obligatory requirement when developing pasture plans. Pasture capacity is expressed as the quantity of animals that can be grazed on a pasture with the effective forage stock [15] or as the amount of effective forage stock (biomass) that can be consumed by animals. However, the effective forage stock (biomass) depends on species composition and vegetation abundance, the agrometeorological conditions of the year and seasonality of pasture use. For existing animal grazing regulations we used the concept of ecological capacity. The ecological capacity is the amount of forage under local agroclimatic conditions that can be consumed by the livestock during a particular season without reducing the regenerative capacity of the pasture vegetation while preserving soil and vegetative cover. Generally we took 65% of total annual growth (biomass) as a measure of ecological capacity that allows sufficient plant regeneration.
Ecological capacity, similar to the concept of grazing capacity, is dependent on the characteristics of environmental and economic pasture condition, which can be mapped and is usually expressed in forage units or in a long-term stocking rate that will not exceed the annual forage production. Figure 8 presents seasonal maps of ecological capacity (measured in biomass) for landscape–geobotanical units in the study area. The preliminary estimates of forage and ecological capacity for desert pastures in the Balkhash area derived from remote sensing, ground information and modeling of production processes are available for more detailed regional studies.
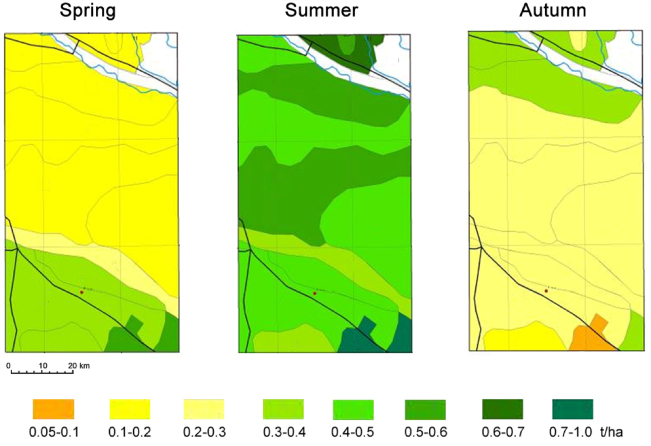
Figure 8. Modeled ecological capacity (biomass) by season (t/ha) for geobotanical units across the study area.
Download figure:
Standard image4. Conclusions
The pasturelands in Kazakhstan are important natural resources from both the economic and the ecological perspectives. However, these lands have been degraded as a result of unregulated grazing practices and possibly climate change. Assessment of pastureland ecological conditions and grazing capacities is, therefore, imperative for balanced economic development and environmental conservation of the country. Field surveys, meteorological observations, remote sensing and ecological models, such as Pasture, can be combined to effectively assess the ecological conditions of pasturelands as well as provide information about forage production that is critically important for balancing grazing and ecological conservation. A case study in the southern Balkhash region of Kazakhstan demonstrated the feasibility of such an approach to effectively managing pasturelands, implying that this approach can be applied to other parts of Kazakhstan or Central Asia with similar ecological and climate environments given the historical datasets and appropriate investment in additional data collection.
Acknowledgments
We thank three anonymous reviewers for comments that substantially improved this paper. This research was supported by the International Science and Technology Center (ISTC), Project Agreement #K-1396p and NASA's support on pastureland decision project NNX10AB65G.