

Abstract
Anthropogenic dust (AD), as a crucial component of particulate matter, is defined as dust emitted through modifying or disturbing soil particles directly or indirectly associated with human activities in urban areas, croplands, pasturelands and dry lakes. The sources, characteristics, and impacts of AD remain poorly studied, in contrast to the large body of research on natural dust (ND). This review summarizes scientific findings published since the 1990s regarding the emissions, physical-chemical characteristics, and spatio-temporal distributions of AD from the micro to the global scale. AD accounts for 5%–60% of the global dust loading, with notable spread in existing estimates. Compared with ND, AD has more complex and variable compositions and physical-chemical properties. Influenced by human disturbances, AD exhibits small particle sizes, easily accessible critical friction velocity, and large emissions. Further research should improve the observations and simulations to investigate the complex interactions among AD, climate change, and human health.
Export citation and abstract BibTeX RIS

Original content from this work may be used under the terms of the Creative Commons Attribution 4.0 license. Any further distribution of this work must maintain attribution to the author(s) and the title of the work, journal citation and DOI.
1. Introduction
Dust aerosols, as an important component of atmospheric aerosols, play a vital role in the Earth energy balance and hydrological cycle by modifying solar and terrestrial radiation (Huneeus et al 2011, Che et al 2014, Liu et al 2015, Li et al 2016). The dust cycle, which is a part of the Earth system that encompasses the lithosphere, biosphere, and anthrosphere, has a significant impact on climate change and ecosystems (Mahowald 2011, Shao et al 2011, Choobari et al 2014, Huang et al 2014). Accurate quantification of dust sources and factors affecting dust emissions is key to understanding the global dust cycle. However, dust aerosols are considered one of the poorly understood factors in current climate models, due to the complex mechanisms of dust emissions. The understanding of global dust cycle is limited by a dearth of information about dust sources, especially the impacts of anthropogenic activities (Ginoux et al 2012).
In the early 1990s, Penner et al (1994) and Tegen and Fung (1995) highlighted that it was inaccurate to merely classify dust aerosols as natural aerosols. Dust aerosols should instead be categorised into natural dust (ND) and anthropogenic dust (AD) according to the source region and emission mechanism (Tegen and Fung 1995, Tegen et al 2004, Chen et al 2018). ND emissions mainly originate from the wind erosion of bare surfaces, such as deserts and Gobi deserts (Shao 2004, Chen et al 2013b, Zhao et al 2013). AD is defined as dust emitted directly through human disturbances in urbanized regions (e.g. construction, cement production, and transportation) (Tegen and Fung 1995, Prospero et al 2002, Zender et al 2004, Ginoux et al 2012, Huang et al 2015, Xi and Sokolik 2016), and indirectly through wind erosion of human modified or disturbed soil particles from croplands, pasturelands and human-caused dry lakes (figure 1). These dry lakes are caused by extraction of water for domestic and irrigation use in addition to climate change (e.g. the shrinking of the Caspian and Aral seas in Central Asia and the Owens Lake in the United States).

Figure 1. Anthropogenic dust and its emission sources. AD are derived from direct and indirect emissions. Direct AD emissions originate from human activities in urbanized regions, such as industry, construction and transportation. Indirect AD emissions originate from the wind erosion of croplands, pastures and dry lakes.
Download figure:
Standard image High-resolution imageAD emissions contribute approximately 20%–30% of the total global dust emissions, mainly originating from semi-arid and semi-wet regions (Ginoux et al 2012, Huang et al 2015, Chen et al 2018). The proportional contribution has increased over the last few decades because of more frequent warmer and drier winters and springs in semi-arid and semi-wet regions (Huang et al 2012) as well as changes in vegetation land cover due to human activities (John et al 2009, Mulitza et al 2010, Song et al 2018). However, there exist large uncertainties regarding the impacts of anthropogenic activities on dust emissions (Sokolik and Toon 1996). Various parametric schemes have been constructed and developed to describe the ND emissions, transmission, loading and deposition processes, such as Tegen and Fung 1994 (TF scheme), Marticorena and Bergametti 1995 (MB scheme), Ginoux et al 2001 (GOCART scheme), Shao 2004 (Shao scheme), Zender et al 2003 (DEAD scheme), and Kok et al 2014. However, current Earth system models do not adequately consider the impacts of AD, and there remains inadequate understanding of the physical and chemical characteristics, emissions mechanisms, and climate impacts of AD.
AD has significant spatial and temporal heterogeneity due to the comprehensive influence of natural and anthropogenic factors, such as climate change, land type, soil texture, urban activities and farming practices (Wang and Qin 2007, Wang et al 2018a, Zhang et al 2013). AD is characterised by small emission scales, large temporal and spatial variabilities, and complex and diverse threshold friction velocities (Hoffmann et al 2008). In addition, the optical properties of AD are quite different from those of ND, with stronger absorption, smaller single-scattering albedo, an asymmetry factor and a linear depolarisation rate (Bi et al 2017, Zhang et al 2017, Wang et al 2018b). Therefore, it is difficult to quantify AD emissions and their environmental and climate impacts in regional or global modelling.
Over the past few decades, AD and its impacts have been attracting significant concerns, despite insubstantial research and data. Thus a systematic review and a more comprehensive summary of the existing studies on AD are urgently needed. In this review, we summarised the scientific findings on AD from the micro to the global scale, based on a series of publications from the Science Citation Index journals. By searching for keywords and topics in the Web of Science and Google Scholar datasets, we retrieved a wide range of theoretical, observational and modelling findings on AD. The key questions answered by this review are as follows: What are the main sources of AD emissions? How to estimate AD emissions in numerical models? What are the scientific questions worthy of attention in future research? This paper is arranged as follows: In the introduction, we introduce the basic concepts and the main sources of AD. In section 2, we introduce the screening methods used in this paper. Through scientific retrieval and screening methods, a comprehensive review of previous studies was carried out. In section 3, the physical and chemical properties of AD are introduced, including the particle size distribution (PSD) and the chemical composition. In section 4, we further explain the influence of physical properties on the dust emission flux in numerical models. Finally, we discuss some shortcomings of the existing research and ideas for future research directions.
2. Method
During our literature review, we noted the need for a clear, uniform definition to allow for a systematic review of the studies on AD. On the one hand, there is direct emission of dust particles from construction and other human activities, mainly in urbanized regions. On the other hand, there is indirect AD emission by wind erosion of human disturbed soil such as croplands, pastures and dry lakes. Therefore, we employed the keywords associated with the definition of AD when composing the search strings in the Web of Science and Google Scholar to search for the titles, abstracts and keywords of all relevant papers. We searched for relevant documents in the database by using operators such as logical 'OR', 'AND', and 'NOT'. After inductively creating categories, we evaluated the retrieved articles select articles that meet the pre-defined criteria for this study. Finally, based on the study content, we selected a total of 98 documents and divided them into three categories (figure 2). Notably, we excluded the studies on anthropogenic aerosol emissions in urbanized regions focusing on non-AD particles such as inorganic salts, sulphate, and nitrate.
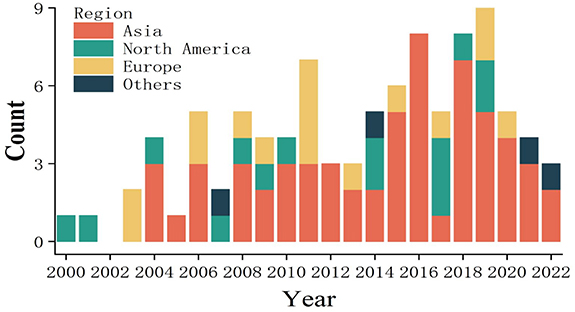
Figure 2. Distribution of the literature related to AD in recent years after screening.
Download figure:
Standard image High-resolution imageTo avoid excluding studies related to AD that may have unclear terms, we classified different research areas according to the definition of AD and searched with more accurate keywords according to the research content. In addition to the general keyword search method, to guarantee relevance, we conducted a more specific search (table 1). In section 3.1, many articles regarding 'urban road dust' are presented. However, most of the articles focus on the sources, particle sizes and heavy-metal concentrations of road sediments. The purpose of our work is not only to review the PSD of direct AD emissions, but also to explore the impact of human activities (e.g. vehicle rolling and refining effects in traffic-dense road-network areas) on particulate matter (PM) concentrations. Therefore, we employed more specific keywords in the search, such as 'traffic turbulence', 'traffic density', 'population density' and 'dust resuspension'. In addition, we included several studies that do not address the particle size of road dust but elucidate the relationship between particle size and vehicle turbulence, such as Chen et al (2019b).
Table 1. Keywords used in the literature search for this review.a,b
| Physical property | Chemical property | Key factor and parameterisation scheme |
|---|---|---|
| Soil/Dust/Pastureland/Cropland/Urban road dust/Dry lake | Soil/Dust/Urban/Road/Cropland | Soil/Dust/Grazing/Pastureland/Cropland/Urban road dust/Dry lake |
| Particle-size distribution | Chemical properties | Emission flux |
| Anthropogenic disturbance | Concentrations of heavy metal | Threshold friction velocity |
| Livestock trampling | Concentration of Polycyclic aromatic hydrocarbon (PAH) | Anthropogenic disturbance |
| Tillage/Cultivation | Anthropogenic activities | Livestock trampling |
| Traffic turbulence | Different land cover | Tillage/Cultivation |
| Traffic density | Traffic density | Irrigation |
| Population density | Population density | Dust emission schemes |
| Dust resuspension | Health effect | Numerical simulation |
Notes: (a) The keywords to describe the same term may be different among studies. Therefore, we considered the replacement of a class of synonyms in the retrieval process. For example, 'Anthropogenic' and 'Human', 'Grazing' and 'Pastureland'.(b) Each phrase in each column is separated by an 'OR' or 'AND'. The searches were conducted in batches, and the results were collated.
In section 3.2, we discuss the concentration and distribution characteristics of heavy metals and polycyclic aromatic hydrocarbons (PAHs) in AD from three main types of land cover (urban soil, road soil and agricultural soil). In the literature screening, in addition to studying the concentration and distribution characteristics of different land covers, the impact of human activities (e.g. different urban functional areas, divergence of traffic flows, and population densities) should be reflected. The concentration differences of heavy metals and PAHs between different land covers are highlighted. In section 4.1, to further screen out the effect of human disturbance, we considered more detailed and specific forms of human disturbances for AD from different sources, e.g. 'livestock trampling', 'cultivation', 'tillage' and 'irrigation'. As discussed in sections 4.2 and 4.3, our search focused on the development and improvement of AD emission schemes in numerical modelling in recent years.
Our search strategy was not exhaustive. Our search included the subject matter in title, abstract and keywords only, and consequently, we might have missed some papers wherein the relevant content appeared only in the main text. The AD emissions we studied are a subset of the total dust loading, and our core keyword is 'Anthropogenic'; however, the current research still presents some ambiguity in the distinction between ND and AD. Nonetheless, a wide range of theoretical, observational and modelling findings on AD emissions and their impacts have been obtained here.
3. Physical and chemical properties of AD
3.1. AD PSD
Particle size is a fundamental factor in evaluating the lifetime of particles, their suspension, transport and deposition processes, and their impacts on the radiative budget and the hydrologic cycle (Iyengar and Nair 2000, Kohfeld et al 2001, Woodward 2001). Fine sand (particles with sizes in the order of short wavelengths: ∼0.2 μm < D < ∼2 μm) reduces the absorption of solar radiation by the global climate and exerts a cooling effect; whereas coarse dust (D > ∼4 μm) produces a large longwave radiative absorption and exerts a warming effect (Tegen and Lacis 1996, Miller et al 2006, Kok et al 2017). The size and number of dust particles are important for forming cloud-condensation nuclei and ice nuclei (DeMott et al 2003, Twohy et al 2009, Zhao et al 2011). Due to the complexity and variability of emission sources, AD particles vary in size, shape and composition and exhibit high spatial and temporal variability.
The soil PSD is considered an important physical attribute because of its significant influence on soil properties related to water erosion, crop productivity, emission and desertification (Gomes et al 2003, Shao 2004, Su et al 2004). Soil type and PSD affect the concentrations of atmospheric PM (Ginoux et al 2001, Shao et al 2008, Shinoda et al 2011, Kok et al 2014). For example, wind erosion of soil followed by the saltation bombardment of soil particles (500 μm > d > 70 μm) is one of the main mechanisms leading to dust emission (Gillette 1974, Nickling and Gillies 1989, Shao et al 1993, Alfaro et al 1997). As shown in Shao (2008), the saltation particles (500 μm > d > 70 μm) are brought by the wind to a height of a few centimetres to tens of centimetres above the ground. Due to gravity, the saltation particles fall back to the ground and hit the soil. The soil aggregates are destroyed, and smaller particles are split and ejected into the atmosphere and stay there for a long time.
The previous studies on the soil PSD of AD sources focused on croplands in the semi-arid region of central Aragon (Spain) and near the Taklimakan Desert (China), pasturelands in semi-arid grasslands (Mongolia and China), dry lakes in the Aral Sea and Own Lake, and urban regions in developing countries (e.g. China and India). The smallest particle sizes of AD were found in cities, followed by grazing areas, with the largest sizes observed in croplands close to deserts. Compared with the non-disturbed soil, the mass fraction of fine particles in the soil affected by human disturbance is increased, the soil aggregation is destroyed. With the intensification of wind erosion and human disturbance, the AD aggregates may be broken to varying degrees, forming smaller particles (<20 μm) to be released into the atmosphere.
Numerous studies on the soil PSD of croplands have been conducted since the 1990s. We summarized the proportions of different soil types affected by human activities (table S3). Soil was classified into 12 types based on the percentage of sand (63 µm < d ⩽ 2000 µm), silt (4 µm < d ⩽ 63 µm) and clay (d < 4 µm), as classified by the United States Department of Agriculture (figure 3). This classification method is widely used in the study of wind erosion (Belnap et al 2009, Shinoda et al 2010, Mendez and Buschiazzo 2015, Katra 2020). The soil texture of croplands is divergent among different climate regions because of geographic position, rock physicochemical weathering and erosion, climate condition and human activities. Arid cropland regions, particularly the edge of deserts, are dominated by sand (60.1%–99%). For example, the croplands in central Argentina, the central Colorado Plateau and near the Taklimakan Desert are dominated by sand, which accounts for 60.1%–63.3% (Mendez and Buschiazzo 2015), 54%–76% (Belnap et al 2009) and 87%–99% (Sharratt et al 2016) of the total soil content, respectively. The soil particles over semi-arid croplands mainly comprise silt (44.3%–62.8%). For example, the soil over the semi-arid of the central Aragon is dominated by silt, accounting for 46.0%–62.8% of the total soil content (López et al 1998).

Figure 3. Types of soil texture according to the content percentages of sand, silt and clay, as classified by the United States Department of Agriculture.
Download figure:
Standard image High-resolution imageWith the improvement of measurement techniques, more detailed cropland types and various tillage periods have been analysed (López et al 1998, Sharratt et al 2016, Katra 2020). Overall, under farming conditions, the surface soil structure is destroyed, the surface roughness decreases, and the fine-grain mass fraction increases. Further, the soil PSD tends to be dominated by fine particles. López et al 1998 conducted wind-tunnel experiments on semi-arid croplands in central Aragon, Spain to analyse the effects of soil wind erosion under different farming conditions. They found that after tillage, the surface roughness decreased by a factor of four, the degree of wind erosion increased by 9%, and the proportion of soil particles with a diameter of <38 mm increased by 9.8%. Katra (2020) investigated the effects of different tillage practices on soil PSD. The size distribution of undisturbed soil particles is characterised by a concentration of large particles (>2000 µm), whereas mechanical tillage and traditional tillage in farming can reduce the soil particle size and concentrate to the 63–250 µm range, inducing desertification characteristics. Mechanical tillage is more effective than traditional tillage techniques in reducing the soil particle size. Furthermore, Sharratt et al 2016 showed that the mass fraction of soil particles greater than 1000 μm in the cotton field after tillage and sowing was nearly 2.5 times smaller than those before tillage (80% vs. 30%).
There are relatively few existing studies on the effects of anthropogenic disturbance on pasture soil. We selected the PSD studies on pastureland soil related to anthropogenic disturbance. Livestock trampling and overgrazing are the most prevalent factors contributing to AD emissions in pasturelands. Generally, livestock trampling in grazing areas reduces the soil particle size. Katra (2020) studied the soil erosion induced by agricultural activities in semi-arid areas. They showed that the PSD in natural areas is characterised by a higher proportion of large PM (>2000 µm, ∼35%), whereas the PSD in pasturelands is concentrated in the 63–250 µm range (∼57%). The effects of different grazing intensities on topsoil properties in semi-arid pastures are multifaceted. Trampling disturbance destroys the surface soil structure, reduces soil aggregation, and increases the fine particle mass fraction, which leads to an increased risk of soil erosion (Kolbl et al 2011), (Wiesmeier et al 2012). And the trampling disturbance by human activities has similar effects (Belnap et al 2007).
With the rapid growth of urban population and industrialization, the contribution of road dust to PM is becoming more and more important. Road dust is an important environmental medium due to its atmospheric resuspension. Notably, the divergence in background soil texture, urbanisation and road-traffic level increase the variability and uncertainty in the PSD of road dust. It is important to understand the impact of traffic, such as vehicle rolling and refining, on the PSD in the traffic-dense road-network areas. We summarised the PSD of road dust affected by human activities (figure 4) based on available literature (table S4). Generally, in areas with heavy traffic and intensive human activities, the road dust PSD is concentrated at 63–250 µm.

Figure 4. Particle size distribution of road dust in urbanized regions.
Download figure:
Standard image High-resolution imageZhao et al (2010) analysed the distribution of road dust PSD in three different urban environments in Beijing, China, including urban villages, main traffic roads, residential areas and college avenues. The road PSDs in the three human-activity-filled areas are all concentrated between 63 and 125 μm, with increased prominence in the main traffic roads (approximately 38%). Chen et al 2019b investigated the PSD of road dust in different functional areas of Lanzhou, China. They found that road sedimentary dust was mainly composed of relatively small particles (<100 μm, 57%–84%), particularly in areas with high traffic intensity and frequent construction activities. This particular road dust PSD reflects the influence of human activities. The turbulence caused by the traffic-dense network can induce the resuspension of road sediment particles. The smoothness and low roughness facilitate the release of dust particles into the air. However, coarse dust particles quickly fall to the ground due to gravity, thereby reducing the average size through vehicle rolling and refining effects.
Compared with the PSD of AD in soil (on the ground), the AD PSD in the atmosphere is more important for human health and climate. The atmospheric AD PSD is an important factor for human exposure and risk assessment, as well as for understanding the atmospheric processes. However, there are few studies on dust PSD in the atmosphere, in contrast to the research focus on the contribution of AD to atmospheric PM2.5 and PM10 (Introduced in 4.3). Chiou and Tsai (2001) measured the AD PSDs in factories and unpaved roads in Hsin-Chu City of Taiwan, China based on wind tunnels. They found that at an air acceleration rate of 1.5 m s−2, the aerodynamic diameter of road dust was 10–30 μm, which diameter range contributes 90% of the mass of the dust samples studied. Climate change and human activity have caused the Aral Sea to dry up, creating a potentially significant aeolian dust source (Micklin 2010, Groll et al 2013). Wiggs et al (2003) analysed the particle size of atmospheric particles at 16 locations around the Aral Sea. The results show a trimodal sediment PSD, with the proportion in number of fine particles (<20 μm) usually above 40%, sometimes exceeding 70%. These particulates mainly come from local sources such as nearby farmland, abandoned irrigation fields, overgrazed dunes or unpaved roads.
3.2. Heavy metals and PAHs in AD
AD is a complex mixture of mineral dust and pollutants. Its pollutant components include heavy metals, PAHs, carbonaceous aerosols, sulphate, ammonium salts, and some unknown components. Quantifying the chemical components and properties of AD is a prerequisite for understanding the potential link between the substance and health. However, there were very few studies on the chemical components of AD, with research on heavy metals and PAHs having received more attention.
Heavy metals existing in various chemical states or forms can be retained, accumulated and transported in the environment and ecosystem. Heavy metals, which constitute a global environmental hazard, are difficult to degrade because of their high toxicity, carcinogenicity, persistence and biological accumulation (Järup 2003, Kampa and Castanas 2008, Li et al 2014). Furthermore, they exert a negative impact on the balance of agriculture, industry, ecosystems and human health at a global scale, which directly and indirectly causes economic damage of over US$10 billion globally (Chen et al 2019, Rai et al 2019). Heavy metals can be deposited in an urban environment or suspended in the atmosphere, damaging local ecosystems and public health due to their toxicity, residence time and bioaccumulation properties. They are mainly transported and enriched in the ecosystem through inhalation, dermal contact and intake through the food chain (Alloway 1990). Heavy metals associated with respirable particles have been shown to induce pulmonary inflammation or oxidative stress of the heart (Gottipolu et al 2008, Lippmann and Chen 2009). In the past decade, the increasing concentration of heavy-metal PM in urban soil and road dust has been linked to human activities, with large amounts of metal dust continuously released from various industrial operations, traffic emissions and municipal waste-disposal activities (Kelly et al 1996, Du et al 2013, Shabbaj et al 2018).
Previous studies on heavy-metal concentrations in road dust, urban soils and agricultural soils are focused on Europe, Southeast China and Eastern North America. Overall, the highest concentration of heavy metals is found in road dust, followed by urban soil, whereas the lowest concentration is in agricultural soil. The average heavy-metal concentrations in road dust, urban soil and agricultural soil are as follows (table S1): urban road dust: Zn (704.66 mg kg−1) > Pb (451.17 mg kg−1) > Cu (149.62 mg kg−1) > Cr (101.48 mg kg−1) > Ni (61.81 mg kg−1) > Cd (8.79 mg kg−1); urban soil: Zn (186.26 mg kg−1) > Pb (125.65 mg kg−1) > Cu (64.40 mg kg−1) > Cr (62.91 mg kg−1) > Ni (38.53 mg kg−1) > Cd (1.48 mg kg−1); agricultural soil: Zn (90.51 mg kg−1) > Cr (62.30 mg kg−1) > Ni (31.77 mg kg−1) > Cu (30.15 mg kg−1) > Pb (26.73 mg kg−1) > Cd (0.18 mg kg−1). The characteristic distributions of heavy-metal concentrations in these three types of land cover are closely related to human activities. A high concentration of heavy metals in road dust is related to high traffic densities, industrial productivity and population density in urban areas. Traffic emissions (from vehicle exhaust, tyre wear and brake line faults, etc), industrial emissions (from power generation, coal combustion and metallurgy, etc) and weathering of buildings and roads result in a large number of solid particles with a high heavy-metal concentration. By comparison, heavy metals in agricultural soil are mainly from mining, urban sewage, pesticides and fertilisers.
Attention has been paid to the relationship between heavy-metal concentrations and PSD of AD. The concentration of heavy metals increases with the decrease in the particle size (Fergusson and Ryan 1984, Zafra et al 2011, Khanal et al 2014, Kang et al 2017, Khademi et al 2019). Between 55% and 75% of the total loads of Cu, Cr, Pb and Cd are associated with sizes <150 µm (Li et al 2015). The size dependence of heavy-metal concentrations in road dust is higher than the case in urban soils, particularly for particles with sizes <100 μm (Khademi et al 2020).
PAHs are toxic organic pollutants affecting the environment (Gunawardena et al 2012). PAHs consist of two or more fused aromatic rings made up of carbon and hydrogen atoms. The most prominent and prevalent sources of PAHs are incomplete combustion of modern biomass (e.g. wood) and fossil fuels (oil and coal) (Boström et al 2002, Tobiszewski and Namieśnik 2012, Ma et al 2017). PAHs are ubiquitous organic pollutants due to their high hydrophobic properties; thus, they can be absorbed by atmospheric particles and transported a long distance (Wilcke 2007, Ravindra et al 2008). With their high hydrophobicity and strong resistance to degradation, PAHs easily accumulate in urban areas. They affect human health through inhalation, ingestion or skin contact (Cachada et al 2012, Chen et al 2013a). PAH exposure has been linked to increased rates of lung cancer, bronchitis, asthma and heart diseases (Moorthy et al 2015, Yue et al 2015, Alhamdow et al 2017).
Studies have analysed the concentration, distribution, source identification and health-risk assessment of PAHs in urban soil and road dust (table S2). Most studies are focused in China and Europe. The concentration and distribution of PAHs are highly variable, depending on the characteristics of the study site. The average PAH concentrations in urban soil, road dust and agricultural soil are shown in figure 5. On average, the highest concentration of PAHs is found in urban soil (∼6994 μg kg−1), followed by road dust (∼3613 μg kg−1) and agricultural soil (∼1969 μg kg−1). Among these three soil types, the highest concentrations of PAHs are contributed by Pyrene (mean value: 831.5 μg kg−1), Phenanthrene (558.8 μg kg−1) and Naphthalene (265.5 μg kg−1); and the lowest concentrations are contributed by Acenaphthylene (40.3 μg kg−1), Acenaphthene (22.7 μg kg−1) and Fluorene (27.3 μg kg−1). The high concentrations of PAHs in urban soil and road dust are related to traffic (e.g. from vehicle exhaust) and industry (e.g. from oil refining, industrial processing, chemical manufacturing and petroleum leakage). By comparison, the anthropogenic sources of PAHs in agricultural soils are mainly the combustion of agricultural wastes.
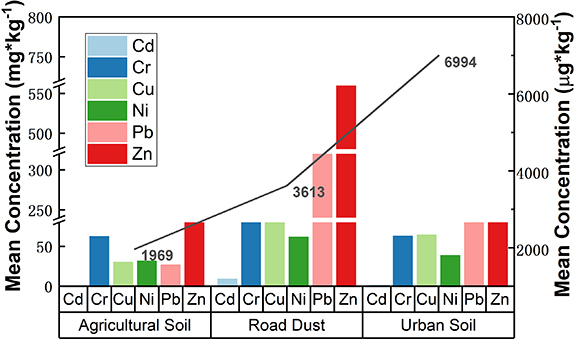
Figure 5. Heavy-metal concentrations in AD. The bar chart represents the average heavy-metal concentrations in urban soil, road dust and agricultural soils (units: mg kg−1). The line represents the average PAH concentrations (units: μg kg−1). See the attached file for more information.
Download figure:
Standard image High-resolution image4. AD emissions
Dust emission is an important part of the dust cycle (Mahowald et al 1999, Perlwitz et al 2001, Shao et al 2011). Dust emission is a complex process affected by many factors such as soil moisture, land cover type, soil particle size, soil aggregate (Chao and Alexander 1984, Zhao et al 2006, Yumimoto et al 2008, Bian et al 2011), and meteorological conditions (Gong et al 2003, Kang et al 2013, Chen et al 2017). The current dust simulations focus on ND (e.g. Chen et al 2013b, Zhao et al 2014, Wu et al 2016, Liu et al 2019), often neglecting AD (Xi and Sokolik 2016). There are still great uncertainties in the dust mechanism and key parameters for various AD sources in the dust simulation (Marticorena and Bergametti 1995, Huneeus et al 2011).
AD is emitted from non-urbanized surfaces (e.g. cropland, pastureland, dry lakes) under wind force, with mechanisms similar to ND emissions (Xi and Sokolik 2016, Chen et al 2018). Therefore, the classical dust emission parameterization schemes can be adopted to estimate AD emissions. Notably, the size distributions of AD particles and threshold velocity of AD are updated in the scheme. AD emissions from urbanized areas (e.g. construction, cement production, and transportation) are closely related to population density (Huang et al 2015, Guan et al 2016). The intense human disturbances along with economic development and city construction result in AD emissions in urbanized areas. Therefore, population data, gross domestic product data, land cover datasets and other ancillary data were used to build the AD emissions in urbanized areas (Chen et al 2018, 2019a, 2019b).
4.1. Relationship between wind-eroded AD emission flux and threshold friction velocity
Wind erosion occurs when wind flow interacts with the Earth's surface, at which point sufficient momentum is transferred to the soil surface to overcome the gravitational and cohesive forces that retard the soil-particle movement and sediment entrainment (Chepil 1959, Iversen and White 1982). The friction velocity (u*) is defined as  , where
  is the shear stress on the surface and
  the air density (Roney and White 2004, 2006). The minimal friction velocity needed to initiate wind erosion is called the threshold friction velocity (u
*
t) (Bagnold 1941, Greeley and Iversen 1985). The three variables of
the air density (Roney and White 2004, 2006). The minimal friction velocity needed to initiate wind erosion is called the threshold friction velocity (u
*
t) (Bagnold 1941, Greeley and Iversen 1985). The three variables of  ,
,  and PSD are key parameters used in wind-erosion duet emission schemes. Accurate estimation of these parameters determines the accuracy of calculated emission fluxes (Shao et al 1993, Shao et al
1996, Shao 2001, Zender et al
2003, Kok et al 2014). The dust emission flux at different
and PSD are key parameters used in wind-erosion duet emission schemes. Accurate estimation of these parameters determines the accuracy of calculated emission fluxes (Shao et al 1993, Shao et al
1996, Shao 2001, Zender et al
2003, Kok et al 2014). The dust emission flux at different  and
and  values can differ by hundreds of times in different AD source areas (grassland, farmland, pastureland, dry lakes, etc) (Shinoda et al 2011, Kok et al 2014).
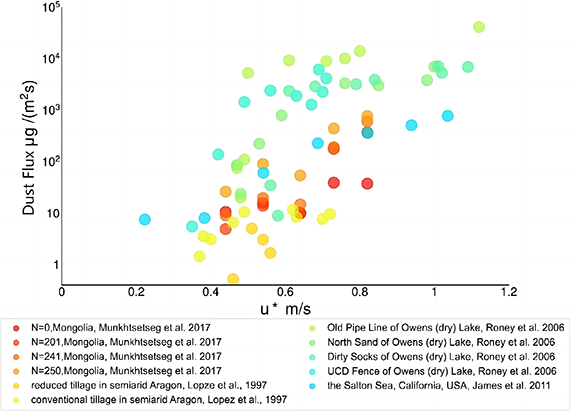
We summarised the relationship between dust flux and  in different AD source regions (figure 6). For the same land type, as the degree of human disturbance increases, the
  decreases. Under the same
  , as the degree of human disturbance increases, the dust emission flux increases. As the
  increases, the dust emission flux increases accordingly until the upper emission limit is reached. Notably, some surfaces (biological crust, hard salt crust and hard physical crust) which are normally resistant to wind erosion can also reach the
  in the case of human disturbance, allowing wind erosion.
Figure 6. AD emission fluxes as a function of friction velocity. Three different land types (pastures, croplands and dry lakes) and different degrees of anthropogenic disturbances are examined. For the pastureland, N represents the number of sheep herded in pastoral areas as an indicator of grazing intensity; for the cropland, different farming practices are indicated; for the dry lakes, the wind erosion of soil was analysed according to the different soil conditions.
Download figure:
Standard image High-resolution image
Since the beginning of the 20th century, scientists have investigated the effects of cropland cultivation on AD emission fluxes. For example, López et al (1998) investigated the effects of reducing tillage and conventional tillage on AD emission flux in dry lands of the central Aragon. They found that the AD emission flux after conventional tillage was more than three times that after reduced tillage. Fister and Ries (2009) simulated the effects of different farming methods on soil-dust release using portable wind tunnels. On average, the soil-dust emission flux is 0.51–2.71 g m−2 10 min−1 for the traditional farming mode (plough or harrow), increasing to is 21.38 g m−2 10 min−1 when small agricultural machinery was employed. Başaran et al (2017) found that cropland tillage leads to severe AD emissions in the arid areas of central Turkey, with the emission fluxes in the dry and wet seasons being 11.38 kg ha−1 and 11.40 kg ha−1, respectively. In addition, the crop-growing seasons affect the degree of AD emissions due to the changes in vegetation coverage (Leys and Raupach 1991, Bilbro and Fryrear 1994).
Pastures are an important AD emission source. For example, Hoffmann et al (2008) investigated AD emissions and dry deposition in the grazed and un-grazed regions in the pasturelands of Inner Mongolia. The grazing intensity and topography contributed the most to the AD emissions and deposition rates. The AD emission fluxes ranged from 0.05 g m−2 d−1 to 0.8 g m−2 d−1 at the grazed sites, whereas the un-grazed sites appeared to be well protected, with few AD emissions. Munkhtsetseg et al (2017) pointed out that both u* and the disturbance level of livestock density have an enormous combined effect on AD emissions. They measured AD emissions at three disturbance levels considering the livestock density and zero trampling in the pastureland of Mongolia, based on a mini wind tunnel experiment (PI-SWERL). At the same  , the AD emission flux from the three livestock-density disturbance levels increased by a factor of up to 20 compared with that for the undisturbed zero trampling case. Du et al (2019) carried out further experiments to investigate the effects of different grazing intensities on indirect AD emissions in the desert steppe of Inner Mongolia. They found that the AD emission fluxes of the moderate and heavy grazing cases were 1.78–2.06 times higher than those of the no-grazing experiment for shrub-dominated grassland, and were 17.86–56.53 times higher than those of the no-grazing experiment for grass-dominated grassland.
Dry lakes caused by human activities (domestic water and irrigation) in the context of climate change (e.g. Owens Lake in the United States, Aral Sea in Central Asia and Lake Ebinur in China) have become a new emission source of AD. Exposed lake beds contain large amounts of salt, fertilisers and pesticides. Wind-driven dust storms from dry lakes affect the environment, especially the health of surrounding residents (Goudie 2014, US EPA 2017, Johnston et al
2019, Jones and Fleck 2020). In 1997, Gillette et al (1997a) and Gillette et al (1997b) conducted many field experiments to determine the change in the  and AD emission flux rate at Owens Lake. King et al (2011) used a novel small portable field wind tunnel (PI-SWERL) to estimate AD PM10 from various soil surfaces surrounding the Salton Sea, including shoreline areas, barnacle-covered beaches, dry washes, interdunes and exposures of the Ancient Lake Cahuilla (in California, the United States and northern Mexico). They pointed out that AD emissions were higher in winter than in summer and spring in the Salton Sea. Brungard et al (2015) explored the relationship between the dust emission flux, surface type,
  and human disturbance in a dry lake in the eastern Great Basin of the United States. They found that on average, the u
*
t of the disturbed surface was less than that of the same undisturbed surface.
and human disturbance in a dry lake in the eastern Great Basin of the United States. They found that on average, the u
*
t of the disturbed surface was less than that of the same undisturbed surface.
4.2. Emission schemes for wind-eroded AD
Parameterisation of AD emissions is the key to quantifying the spatial and temporal distributions of AD and its environmental and climate effects. Under the comprehensive influence of human and natural factors, such as climate change, land type, soil texture, plant species and intensity of human activities, there is substantial spatial and temporal heterogeneity in AD emissions (Sokolik and Toon 1996, Tegen et al 2004, Xi and Sokolik 2016). AD is characterised by a small emission scale, large temporal and spatial variability, and complex and diverse u*t; consequently, it is difficult to construct AD emission schemes for different land cover types.
Parameterization of farmland AD emission is based on the influence of wind erosion dynamic process and wind erosion factors. It is the key, difficult problem in soil wind erosion research in recent years (Shao et al 1996, Alfaro et al 1998). Accounting for climate factors, soil erodibility, ridge length, crop residue and soil-surface roughness, a few models have been developed since the 1960s, including WEQ (Woodruff and Siddoway 1965), TEAM (Gregory et al 1988), WEAM (Shao et al 1996), RWEQ (Fryrear 1998) and WEPS (Hagen 1991). However, most models are based on empirical estimation and do not consider the wind erosion mechanism. In addition, these models target at specific points or farmland simulations with refined input data. They are often unable to achieve complete coupling of large-scale meteorological fields and wind erosion processes that vary in time and space, and are difficult to represent large regions.
Recent research has attempted to consider AD emissions in regional and global models. However, there are large uncertainties in the estimated contribution of AD to the total dust concentration (table 2). Tegen and Fung (1995) estimated that AD accounted for approximately 30%–50% of the dust loading, by using a three-dimensional dust transport model. Mahowald and Luo (2003) analysed dust simulations under different scenarios for a long time, and they found that AD accounted for 14%–60% of the total dust. Tegen et al (2004) found that only 5%–7% of the dust aerosols at the global scale are from AD. Xi and Sokolik (2016) divided dust sources according to the characteristics of surface wind erosion, and used the WRF-Chem model to estimate that the AD contribution in Central Asia accounted for 18%–57% of the total dust emissions from 2000 to 2014. All of the above-mentioned studies only considered indirect AD contributions from cropland, pastureland and dry lakes, ignoring direct AD emissions from urbanized areas. Chen et al (2019a) used dynamic dust sources to reflect the seasonal differences and interannual variation characteristics of different surface types. Under the observational constraint by the Cloud-Aerosol LIDAR and Infrared Pathfinder Satellite (CALIPSO) retrievals, they developed an AD emission parameterization scheme that takes into account both direct and indirect AD, and estimated the contribution of AD to global dust to be approximately 19% in 2007–2010.
Table 2. Percentage contribution of AD to the total dust concentration based on numerical modelling.
| References | Resolution | Region | Period | Contribution |
|---|---|---|---|---|
| Tegen and Fung (1995) | 8° × 10° | Global | — | 30%–50% |
| Mahowald and Luo (2003) | 1.9° × 1.9° | Global | 1980–2099 | 14%–60% |
| Tegen et al (2004) | 3.75° × 5° | Global | 1983–1992 | 5%–7% |
| Chen et al (2019a) | 1° × 1° | Global | 2007–2010 | 19% |
| Xi and Sokolik (2016) | 1° × 1° | Central Asia | 2000–2014 | 18.3%–32.8% |
Overall, the uncertainties of current AD emission schemes are mainly from the following aspects:
- (I)Neglect or severe underestimate of the differences between AD and ND emissions in key parameters such as PSD, soil moisture, surface roughness and u*t. For example, the non-homogeneity of u*t has not been well addressed. AD sources are diverse, including croplands, pastures, sparse grasslands, deforested forests, dry lakes and urbanized regions. The u*t values vary greatly across different surface types under the influence of vegetation coverage, particle size, soil moisture content and soil hardness. Shen et al (2006) indicated that the artificial utilisation and management of croplands can reduce u*t by more than 50%, thus considerably increasing AD emissions over the Gobi Desert in Dunhuang, China. However, the estimation of u*t is simplified in the early AD emission schemes, in which a universal value of u*t is typically adopted. Shao et al (2001) used the model parameterization method to calculate the u*t in Northeast Asia, but they ignored the influence of human disturbance and land use on the u*t.
- (II)Neglect of seasonal and interannual variations in AD sources. The dynamic AD sources are ignored in the models. With rapid urbanisation and the agricultural advancement, the changes in the influence of human activities on land coverage and land use are substantial. However, the current dust emission schemes regard the AD source regions as static 'climate states' and ignore their dynamic changes (Ginoux et al 2001), resulting in significant uncertainties in the simulations. Kim et al (2013) used NDVI of the Advanced Very High Resolution Radiometer to represent the dynamic change in dust sources in the GOCART scheme. They showed that the AD emissions from croplands and sparse grasslands have notable seasonal variations, with a maximum difference of 20%. Xi and Sokolik (2016) further used the Hyde dataset to classify croplands, pastures, and sparse grasslands as AD sources and found that AD emissions are closely related to land-use intensity.
- (III)Lack of complete high-precision observational constraints for AD emissions. It is challenging to identify and differentiate between AD and ND, owing to the seasonal and interannual variability of AD sources and the coarse resolution of current satellite observations. Therefore, there is significant uncertainty in the validation of numerical simulation results and the correction of model parameters. Ginoux et al (2012) developed a global-scale high-resolution mapping of sources based on moderate resolution imaging spectroradiometer (MODIS) Deep Blue estimates of dust optical depth in conjunction with other land use datasets. They ascribed dust sources to natural and anthropogenic (primarily agricultural) origins, calculated their respective contributions to emissions. Huang et al (2015) developed a satellite-inversion algorithm to identify AD and ND based on the CALIPSO data. They provided more comprehensive and accurate observations for AD simulations. However, they assumed a single value for the mass extinction efficiency in relating AD to optical depth.
4.3. Inventory of direct road dust emissions
With the development of urbanization, direct AD emissions caused by human activities such as construction and transportation have become an important source of urban air pollution. Road dust in the urban environment is a heterogeneous mixture of particles from different emission sources (Adachi and Tainosho 2004). The sources include vehicle exhaust, brake and tire wear, road wear (Pierson and Brachaczek 1983, Rogge et al 1993), traffic congestion and construction (Amato et al 2009, 2013, Kreider et al 2010). As a major component of AD, fugitive road dust is resuspended by traffic-generated turbulence and is subsequently released into the atmosphere (Abu-Allaban et al 2003, Kuhns et al 2003, Thorpe and Harrison 2008, Amato et al 2014). Along with urbanization, road dust has become a major source of urban atmospheric PM pollution (Amato et al 2009, 2013, Kreider et al 2010). Due to the complexity and diversity of anthropogenic activities, there are large uncertainties in the estimated contribution of road dust to the total PM concentration. Some studies have estimated the contribution to be about 12%–20% based on the source apportionment results, but the influence of anthropogenic aerosols such as sulphides and nitrogen oxides cannot be ruled out (Zheng et al 2005, Cao et al 2012, Zhang et al 2013). Other studies have estimated the contribution of road dust by source apportionment or the road dust emission inventory. They found a mass fraction of 55% in PM10 in Delhi, India, in 2010 (Sahu et al 2011); 25.7% in PM10 in São Paulo, Brazil, in 2014 (Pereira et al 2017); 24.6% in PM2.5 in the urban area of Lanzhou, China, in 2017 (Chen et al 2019b); and 14%–48% in PM10 in the urban areas of Europe from 2000 to 2009 (Amato et al 2013). However, road dust emissions have been neglected or substantially underestimated in modelling, which can partly explain the underestimation of simulated total PM concentrations over urban areas (Philip et al 2017).
Given that a large (sometimes the largest) fraction of urban PM2.5 originates from road dust emissions, researchers have attempted to develop road dust emission inventories in the urban areas of developing countries, such as India and China. For example, road dust emissions in Delhi, India were found to be as high as 26.2 Gg year−1 in terms of PM2.5 and 131.3 Gg year−1 for PM10 in 2010 (Sahu et al 2011). Large road dust PM10 emission fluxes can be found in the Beijing metropolitan area, which ranged from 0.5 to 1 ton km−2 month−1 during the Olympics Game in 2008 and were 40%–70% higher on the same days in 2007 (Fan et al 2009). Moreover, approximately 2 × 10⁴ tons of road dust PM10 were emitted in the Beijing metropolitan area in 2007, with emission fluxes ranging from 19 to 45 tons km−2 yr−1 (Fan et al 2013). Chen et al (2019b) revealed that road dust PM2.5 emissions were approximately 1141 ± 71 kg d−1 in the urban area of Lanzhou, where high emission fluxes exceeding 3 × 10⁴ μg m−2 d−1 were recorded over areas with small soil particles, high traffic densities and frequent construction activities. However, most of the existing studies neglected the impacts of human activities (e.g. street-cleaning activities and policies) (Amato et al 2010), road characteristics (e.g. vehicle speed, vehicle type, location and topography), and meteorological conditions (e.g. temperature, wind direction, wind speed and relative humidity) (Etyemezian et al 2003). Future studies should focus on improving the modelling by including more factors. Moreover, the previous studies on fugitive road dust emission inventories merely focus on the urban scale. Therefore, there is an urgent need to develop road dust emission inventories at regional and even global scales.
5. Discussion and future outlook
As one of the most abundant aerosols in the atmosphere, dust plays important roles in air quality and climate. Due to the complex mechanism of dust emissions, dust aerosols remain one of the poorly understood factors in current models. Even more uncertain is the impact of human activities on dust emissions. Dust emissions from urban anthropogenic activities (e.g. construction, transportation and industry), agricultural activities (e.g. farming and grazing) and human-related lake changes (e.g. drying/shrinking of the Caspian Sea, Aral Sea and Owens Lake) are underestimated or ignored. Due to the scarcity of relevant studies, a comprehensive understanding of AD is lacking. Our review identified several major sources of AD, the physical-chemical properties, the characteristic parameters related to AD emissions, and the limitations of AD emission schemes and numerical simulations.
The physical properties of AD exhibit notable regional diversity. The PSDs differ significantly among diverse AD sources, with the smallest sizes in urban areas, followed by grazing areas and croplands close to deserts. Compared with the non-disturbed soil, the mass fraction of fine particles in the soil affected by human disturbance is increased, the soil aggregation is destroyed. In general, the threshold friction velocity of the human disturbed surface is lower than that of the same undisturbed surface, and is thus more prone to wind erosion and more emissive. Several types of soil that are usually not prone to wind erosion can reach the friction velocity threshold causing wind erosion after human disturbance.
Previous research related to the health impact of AD focuses on heavy metals and PAHs in AD. The concentrations of heavy metals and PAHs exhibit high spatial and temporal variabilities. The highest heavy-metal concentration is found in road dust, followed by urban soil and agricultural soil. The highest PAH concentration is found in urban soil, followed by road dust and agricultural soil. A primary challenge in determining the health risk of AD lies in differentiating and tracing its origin. Due to the limitations of existing technology, the specific sources of dust in urban environments cannot be distinguished in detail, and the additional dust produced by human activities can only be roughly estimated. Future research needs to establish multi-pollutant source datasets to facilitate health impact studies.
Emissions are the driving force of the life cycle of AD. Mechanisms of AD emissions from different land cover types should be better established. To date, several schemes have been established to describe indirect AD emissions from croplands, pasturelands and dry lakes; and emission inventories have been constructed to estimate direct AD emissions. However, there are significant uncertainties regarding the quantification of AD emission processes, due to the diverse PSDs and the high emission frequency in small amounts of AD compared with the ND. Although wind-tunnel experimentation and extensive field measurements have revealed the physical mechanisms of indirect AD emissions, the parameterisation schemes remain poor. Enhanced field observations, monitoring networks and numerical parameterisation are crucial in better quantifying the amount and physical-chemical and spatio-temporal characteristics of AD emissions. It is particularly important to build a high-resolution satellite observation network, improve the algorithm to identifying AD based on observations, and quantify the AD concentrations at the regional and global scales.
There are highly complex links between anthropogenic activities, dust emissions, climate, and the environment. The climatic effects of anthropogenic and ND might be significantly different, given their differences in physical-chemical properties, sources and spatiotemporal variabilities. And the emerging model studies have provided important evidence of the climate impacts of AD (Xia et al 2021). However, the climate impacts of AD remain little studied, with the number of SCI journal publications less than ten. Moreover, current regional and global models do not extensively consider the life cycle processes of AD including emissions, transport and dry/wet depositions. The estimated radiative forcing by AD is subject to large uncertainties due to inadequate knowledge on the loading, size distribution, and optical properties of AD. The climate effect of AD may be amplified or weakened through feedbacks, which are unclear at the moment. Thus substantially improved observations and model simulations are needed enhance our understanding of the climate impacts of AD.
Acknowledgments
This work was jointly supported by the Project supported by the Joint Fund of the National Natural Science Foundation of China and the China Meteorological Administration (No. U2242209), the National Natural Science Foundation of China (Grant No. 42175106), and Self-supporting Program of Guangzhou Laboratory (Grant No. SRPG22-007). Data sharing is not applicable to this article as no new data were created or analysed in this study.
Data availability statement
No new data were created or analysed in this study.
Supplementary data (0.4 MB PDF)