


Abstract
Sustainable land management is integral to conserving tropical ecosystems and reducing carbon emissions. Human-set fires are part of the land cover change process and are the most common driver of deforestation and carbon emissions in Amazonia. Analyzing the behavior of major fire events provides insight into the effectiveness of current protections. This study aims to quantify the role of Indigenous Territories and Protected Areas (ITPAs) in characterizing anthropogenic fire regimes over the 2020 fire season in Mato Grosso, Brazil. Because of the rapid rate of land cover change and lack of widespread ground validation data in the region, we used a combination of ESA's Sentinel-5 Precursor Aerosol Index, NASA's Visible Infrared Imaging Radiometer Suite, and high resolution Planet satellite imagery for the Monitoring of the Andean Amazon Project to analyze spatial and temporal patterns by fire type. ITPAs cover 25% of the study area's land and contained approximately 20% of significant recorded fires in 2020. Recently deforested areas, forest, grassland, and cropland fires showed varying seasonality and lower frequencies inside ITPAs, but mean fire start dates for all fire types occurred in mid-September. Results suggest that the overall density of major fires is reduced in ITs. PAs only inhibit the density of crop or pastureland fires, but no major fires occurred past 10 km inside their borders. Burn severity of major fires had a weak relationship to distance from ITPAs for some fire types. This study highlights the advantages of near real-time data for individual fire events, provides further evidence of the effect of ITPAs on fire behavior, and demonstrates the importance of adequate protection strategies for mitigating fire activity.
Export citation and abstract BibTeX RIS

Original content from this work may be used under the terms of the Creative Commons Attribution 4.0 license. Any further distribution of this work must maintain attribution to the author(s) and the title of the work, journal citation and DOI.
1. Introduction
Since 2014, the Brazilian Legal Amazon, a geographic area under the responsibility of the federal authority Superintendência do Desenvolvimento da Amazônia [1], has seen an increasing trend in deforested area following a dramatic decline after 2005. According to Brazil's National Institute for Space Research (INPE) [2], 2019 saw the highest levels of deforestation, defined as the suppression of native vegetation, since 2008 at approximately 10 900 square kilometers, just surpassing 2020. Similarly, deforestation in indigenous and conservation areas has sharply increased in the past few years, with the highest levels from 2008 to 2020 occurring in 2019. The most common type of deforestation was forest degradation by fire [2]. Due to an uptick in fire occurrences in 2019, more restrictions on fire use were implemented in 2019 and 2020. Presidential decrees 9.992/2019 and 10.424/2020 banned fire use completely for periods of 60 and 120 days respectively, except by indigenous communities or authorities [3].
There is little potential for naturally occurring, sustained fire events in undisturbed Amazon rainforest due to frequent rainfall and humidity [4]. Fires are caused primarily by human activity, but their effects can be exacerbated by local, regional, and seasonal conditions. The landscape's susceptibility to fire is dependent mainly on biophysical parameters including rainfall and soil water content, forest height, canopy density, fuel moisture content, and microclimate [4, 5]. Fire susceptibility in Amazonia increases in disturbed ecosystems such as selectively logged forest, second-growth forest, and open pasture [4]. Fire activity has also been linked to the presence of severe drought or El Niño–Southern Oscillation [6, 7], with fires penetrating deeper into the forest under drought conditions [6]. Therefore, forest degradation or fire events that strip the forest's protective canopy exposes it to hotter, dryer conditions and further increases the risk of ignition [5]. Fire activity is also related to market demands for forest and agricultural products [8, 9] and policy shifts [10].
Fire as a land management tool has a complex history in Amazonia. In disturbed Amazon landscapes, 'slash and burn' agriculture is a common, cheap, and efficient method of land management, whereby the forest is first cleared, the 'slash', or razed vegetation, is left to dry, burned, and subsequently converted to pasture [11]. This conversion of primary forest to agriculture is associated with increases in harmful PM2.5 emissions, even within protected areas [12]. Fires used to manage crop and pastureland also significantly contribute to forest fires by escaping their intended boundaries [13]. Evidence suggests that indigenous groups have also used fire for land management since pre-Columbian times to fertilize soils, clear land for cultivation, mitigate pests, aid in hunting, stimulate plant growth, and to direct successional processes [3, 14]. Burning is controlled and precise, based on knowledge of local ecology, landscape features, and fire behavior [3].
This study will explore several measures of the Amazonian fire regime in 2020. Drawing from Bowman et al [15] and Guyette et al [16], we define an anthropogenic fire regime as the spatial and temporal patterns of fire intensity, severity, type, and frequency shaped by the interactions between vegetation and human activity. Other studies have suggested that indigenous and protected areas reduce fire frequency based on one or more of these measures [9, 17–19]. Fire detection methods using remote sensing to determine fire type have been employed in the literature, but none to the authors' knowledge have utilized verified, up-to-date land cover data on a large scale. Some monitoring efforts, such as the Global Fire Emissions Database's Amazon Dashboard [20], use annual land-cover data to predict fire type based on a variety of biophysical parameters. Montibeller et al [21] and Shimabukuro et al [22] use annual land cover data to estimate forest loss potentially caused by fire and to characterize burned areas, respectively, not accounting for intra-annual change. However, the rapid pace of land cover change in Mato Grosso, estimated to be −0.76%, −1.21%, and 1.48% annually for forest, other natural vegetation, and agricultural land respectively based on recent data from the MapBiomas Amazon Project [23], may make accurate characterizations of fire type more difficult. These are conservative measures, as they only account for net annual changes.
This study aims to address these challenges by using a combination of satellite products and recorded major fires from the Monitoring of the Andean Amazon Project's (MAAP) Amazon Real-Time Fire Monitoring application [24] to detect and characterize major fires in Mato Grosso, Brazil. This paper presents an assessment of the spatial relationships between protected area or indigenous territory status and the frequency, distribution, severity, and type of major fires detected over the 2020 fire season.
2. Data and methods
2.1. Study area
The Brazilian state of Mato Grosso is situated in the southeast of the Amazon biome, and intersects part of the Arc of Deforestation. It is considered a dynamic agricultural frontier, where agricultural expansion is contributing to high rates of deforestation and often subsequent burning [25]. In 2018, approximately one third of Mato Grosso's land was used for agriculture [23]. An expansion of large-scale agriculture and corresponding deforestation was documented with remote sensing in the early 2000s. Cropland deforestation has been concentrated in the central part of the state and within the Xingu river basin, while pasture deforestation has shown advancement into northwestern Mato Grosso [8].
A total of 57 indigenous territories and 28 protected areas intersect with Mato Grosso within the Amazon watershed, covering approximately 25% of this land area. The Xingu, Aripuana, and Nambiquara indigenous territories are the largest in Mato Grosso (RAISG). Indigenous territories are federally recognized and delineated lands inhabited by indigenous people, where indigenous peoples have permanent use rights to the land. As such, agricultural activity is permitted on these lands [9]. Protected areas in Brazil are defined by the National System of Protected Areas (SNUC), and can be sorted into strict protection areas and sustainable use areas [26].

Figure 1. Study area with indigenous and protected areas in Mato Grosso, Brazil.
Download figure:
Standard image High-resolution image2.2. Satellite Earth observation acquisition
Landsat 8 Operational Land Imager (OLI) Level 2, Collection 2, Tier 1 Top of Atmosphere reflectance was obtained from the US Geological Survey (USGS) [27] using the Google Earth Engine (GEE) platform [28], which allows for easy data access and analysis in a cloud-based environment. Landsat 8 imagery has a 30 m spatial resolution and a 16 day repeat cycle. Imagery was obtained from May to December 2020, representing the 2020 fire season in Brazil. This date range represents dry period months and major fire detection dates.
2.3. Vector data acquisition
Indigenous and protected areas data updated in 2019 were obtained from the Rede Amazônica de Informação Socioambiental (RAISG) [29, 30]. Country and state administrative boundaries for Brazil were obtained from the Database of Global Administrative Areas (GADM) [31]. Amazon Basin shapefile data was obtained from Aqueduct and is available from the World Resources Institute [32].
Individual major fire events during the 2020 fire season were recorded as points using MAAP's Real-Time (RT) Fire Monitoring Application, using a GEE application [24] (figure 3). The app, which overlays imagery from the European Space Agency's 5.5 km by 3.5 km resolution Sentinel-5P Aerosol Index [33] with 375 m Visible Infrared Imaging Radiometer Suite (VIIRS) active fire detections from the Suomi National Polar-Orbiting Partnership (Suomi NPP) spacecraft [34], allows the user to identify major fires in the Amazon Basin daily. Providing global coverage every 12 hours or less, the VIIRS active fire detection algorithm shows more coherent tracking of biomass-burning fire perimeters and a 3–25 times increase in the number of global detections over the 1 km MODIS active fire algorithm, providing advantages for small fire detection [34]. First, areas where high emissions, or pixels where daily Sentinel-5P Aerosol Index is greater than 1 (relatively high emissions representing high biomass burning), overlapped with daily VIIRS fire alerts were identified using the application. Visual detection by the authors was used to identify high levels of aerosols and fire 'hotspots' where these occurrences were slightly displaced due to unknown atmospheric variables, but otherwise corresponded. These were apparent in the corresponding sizes and shapes of the aerosol plume and fire detections. Some high Aerosol Index values were ignored if they were indicative of noise in the data; for example, a single Aerosol Index pixel with a high value that was not adjacent to any other pixels with values greater than 0 would be ignored.
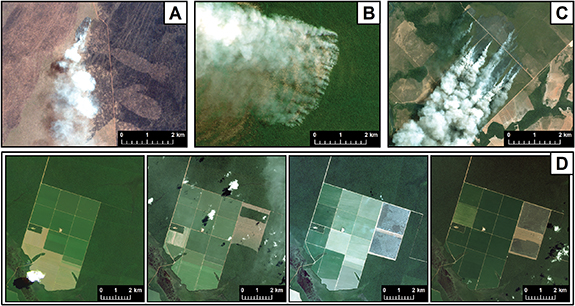
Figure 2. Example PlanetScope imagery of each fire type in 2020 (Images ©2020 Planet Labs PBC). (A) Grassland/Savanna, (B) forest, (C) cropland, (D) recently deforested. (D) represents a series of images from April to December, 2020.
Download figure:
Standard image High-resolution image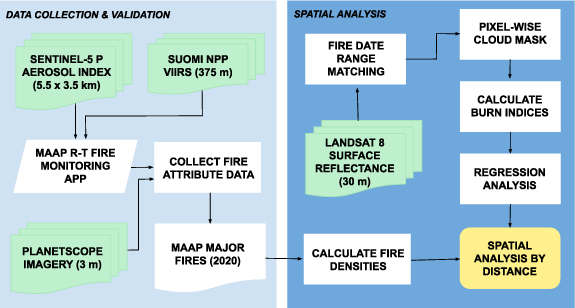
Figure 3. Methodological workflow.
Download figure:
Standard image High-resolution imageNext, major fires were confirmed using daily high-resolution PlanetScope imagery at approximately 3 m resolution accessed through the Planet Explorer platform [35]. Smoke or burned bare land provided a confirmation of fire occurrence. This was especially important for fire events composed of few 'hotspot' VIIRS detections or fires that showed displacement with their corresponding aerosol signatures. However, it is possible that the Planet imagery may have been collected before the time that the fire was detected by VIIRS, even if on the same day. These limitations, as well as limitations posed by cloud cover, were mitigated by viewing Planet imagery collected in the days following the fire detection. Thus, a 'major fire' is hereafter defined as generating a thermal anomaly detected by VIIRS active fire alerts, demonstrating an overlapping or wind-displaced Aerosol Index greater than 1 (excluding noise), and confirmed visually using high-resolution imagery on the date of the VIIRS detection or immediately preceding or following it by one day.
Land cover type was categorized by visual photointerpretation using current and archived PlanetScope imagery in the days and months preceding the burn. This determined the fire 'type', which was categorized in two ways. The Inclusive category consists of fires classified into one or more of the following categories: Forest, Crop or Pastureland, Grassland or Savanna, or Recently Deforested. These fires are not required to be exclusive to one category and may be counted twice. The Forest type represents natural forest vegetation that has not been recently degraded, or degraded since 2017. Crop or Pastureland refers to agricultural fields or areas cleared for grazing. Grassland or Savanna represents natural grassland or shrubby vegetation. The Recently Deforested type refers to land cover that has been recently cleared on or after 2017 and burned in 2020, and can resemble degraded early-successional forest. The second categorization, referred to as Exclusive, consists of fires classified into one of ten discrete, non-overlapping categories (table 1). These categories represent fires classified under these combinations exclusively; a fire classified under Forest is not additionally associated with any other type. Using Inclusive and Exclusive types allowed us to distinguish fires that occurred on more than one land cover type. This information is currently not provided by the Brazilian national monitoring system Terrabrasilis [2], or other systems that classify fire type, such as the Amazon Dashboard [20].
Table 1. 2020 major fire types and counts.
| Category | Fire type | Major fires—all (count) | Major fires—BS analysis (count) |
|---|---|---|---|
| Inclusive | F | 431 | 384 |
| Inclusive | D | 202 | 176 |
| Inclusive | C | 225 | 204 |
| Inclusive | G | 34 | 34 |
| Exclusive | F | 278 | 245 |
| Exclusive | D | 123 | 118 |
| Exclusive | C | 93 | 84 |
| Exclusive | G | 25 | 25 |
| Exclusive | F and C | 96 | 87 |
| Exclusive | C and D | 16 | 14 |
| Exclusive | C and G | 1 | 1 |
| Exclusive | F and D | 30 | 26 |
| Exclusive | F and G | 8 | 8 |
| Exclusive | F, C, and D | 19 | 18 |
Fire Types are represented as follows: forest (F), recently deforested (D), crop/pastureland (C), and Grassland/Savanna (G). Fires selected for the BS (burn severity) analysis were those that were not obscured by cloud cover, as identified by Landsat 8 imagery. Double counting may occur in Inclusive categories if a fire falls under multiple categories (i.e. a fire that is classified as both Forest and Recently Deforested; the total counts of fires under Inclusive and Exclusive categories do not match for this reason.
The coordinates of the approximate center point of each fire event were recorded, based on VIIRS anomaly detections and aided by visual cues such as burned vegetation or burn scars in Planet imagery, and here represent major fire events. Because counts of fire event centroids represent human fire ignitions, unlike burned area values, the use of centroids rather than area in fire density calculations allowed for evaluating socio-political implications of fire use. An area-based density, on the other hand, does not directly connect to the number of ignitions. Fire occurrence dates and approximate area of the first day of burning were also recorded. Burned area on the first day of detection was manually digitized over the high-resolution imagery by drawing polygons, and area was estimated using the Planet Explorer GUI based on visual evidence of the burn. Evidence included charred vegetation, blackened or ashy soil over agricultural fields, vegetation damaged or cleared within the past few days, or smoke that could be traced directly to a field or vegetated area. However, burned area was not continuously tracked due to the large quantity of fires and time intensive nature of manual area estimation. Areas thus represents a conservative or minimum approximation. Fire points represent major fire events, in contrast with other fire products that produce 'hot pixels' or single thermal anomaly detections that are not separated into fire events.
Using MAAP data for spatial analysis presents advantages and limitations. First, it allows for analysis of behavior and characteristics of fire events, rather than 'hot pixels'. Many burned area data sets available for Amazonia, determined by hot pixels or modelled land cover changes, vary significantly in area [22, 36]. Counts of hot pixels, even when aggregated into burned areas, can be difficult to interpret and do not allow for tracking the duration of individual fire events. Second, using Planet imagery allows for near-real time confirmation and classification of fires rather than relying on land cover classification maps that may not reflect the rapid pace of land cover change. However, this data set approximates fire locations using centroids of fire events, so spatial analyses were done using centroids rather than areas.
2.4. Data preprocessing
The Brazil Administrative Boundaries, Amazon Basin, Natural Protected Areas, and Indigenous Territories data sets were projected to the SIRGAS 2000 geographic coordinate system, the official geographic coordinate system of Brazil [37]. Data sets were then clipped to the Amazon basin within Brazil. National and sub-national protected areas from RAISG were consolidated into one data set.
Pre-processing for Landsat 8 OLI imagery was done in GEE. First, clouds were masked by creating a pixel-wise cloud-free composite using the quality assessment band. Imagery was filtered to the study area. Bands 5 and 7, corresponding to the near-infrared and short-wave infrared bands, were extracted to prepare for calculation of burn indices.
2.5. Spatial distance analysis
To evaluate spatial relationships between major fire events and Indigenous and Protected Areas (ITPAs), fire frequency was calculated at regular distances inside and outside of ITPAs. One-kilometer buffers were created up to 50 km inside and 20 km outside of ITPA borders. Fire frequency and density were calculated within each buffer distance for each of the four Inclusive fire types in order to maximize the sample size of each fire type. To normalize fire frequency, we calculated the ratio between density of fires (count per unit area) at each interval. Areas were calculated using ArcGIS Pro version 2.6 software [38]. 5 km and 10 km buffers were used to calculate the fire density ratio based on the methods of Nepstad et al [9], who calculated fire density based on 20 km bands for 4 km GOES fire pixels. Because VIIRS, at 350 meters, has a much greater spatial resolution than GOES, we chose narrower bands of 5 and 10 km to maintain a width of at least two times the error (which for GOES, was within one pixel). If the fire density ratio at 5 km was 0.5, the density of fires at 5 km outside the border was twice that of 5 km inside the border. Frequency and density ratios were evaluated by fire type to compare the spatial distribution of fire drivers.
2.6. Burn severity analysis
Recorded start and end dates of each MAAP major fire point were used to define an eight-week period before and after the fire event. That is, the pre-fire period was defined as a range from one day prior 57 days prior to the start date and the post-fire period was defined as a range from one day after to 57 days after the end date. An eight-week time range allowed for three Landsat 8 images to be used. Cloud-masked pre- and post-fire imagery was stacked and median values were selected to obtain composite pre-fire and post-fire image pairs for each major fire.
The difference normalized burn ratio (dNBR) was used to represent burn severity and conduct a spatial analysis in relation to ITPA. dNBR was calculated and extracted to major fire points using GEE. Fire presence points which were obscured by cloud cover during the imagery dates associated with the fire, as identified from the quality assessment band, were removed from this portion of the analysis. Defined as the normalized difference of near-infrared and short-wave infrared bands, there is longstanding precedent for the use of dNBR for both short and long-term assessments vegetation change due to burning [39]. Other burn indices that can be calculated from Landsat 8 imagery include an altered version of the difference normalized burn ratio (dNBR2) which uses both of the SWIR bands, Relativized difference Normalized Burn Ratio (RdNBR), and the relativized burn ratio (RBR). dNBR 2 is sensitive to water in vegetation, making it a possible alternative to dNBR in detecting burned areas [40]. Parks et al [41] demonstrated that the RBR showed reduced correlation with pre-fire NBR than did dNBR. Miller and Thode [42] found that a relativized index equivalent to the RBR developed by Parks et al, the RdNBR, overestimated the burn severity of fires with low pre-fire NBRs, but resulted in an increased correlation with field data over dNBR using a regression analysis. Because field assessment was outside the scope of the present study, dNBR was primarily used to represent burn severity for spatial an due to its frequent use in the literature and its association with approximate categorical severity levels predefined by the USGS [43]. dNBR was also used by dos Reis et al [19] to map burned areas in Amazonia using satellite imagery from Landsat 8 OLI. Severity categories defined by the USGS are as follows: enhanced regrowth (high), enhanced regrowth (low), unburned, low severity, moderate-low severity, moderate-high severity, and high severity. Burn severity equations calculated are listed in table 2.
Table 2. Burn index equations.
| Index | equation | |
|---|---|---|
| Normalized burn index |
![$\displaystyle \mathrm{NBR} = \frac{[B5] - [B7]}{[B5] + [B7]}$](https://content.cld.iop.org/journals/1748-9326/17/8/084030/revision2/erlac8237ieqn1.gif)
| (1) |
| Difference normalized burn ratio (dNBR) |
| (2) |
 and
and  represent the NBR before and after the fire event, respectively. Band 5, or NIR (B5) is 0.85–0.88 µm and Band 7, or SWIR 2 (B7) is 2.11–2.29 µm in wavelength.
Fires were plotted by distance to an IT or PA and burn severity (calculated as dNBR). The Inclusive and Exclusive fire type breakdowns were used to discern the relationship between distance to IT or PA and burn severity. Correlation statistics and p-values were then computed for the relationship between distance and fire frequency and density by inclusive and exclusive fire types. The Kendall rank correlation coefficient was chosen because it accepts nonlinear relationships and is less sensitive to outliers [44]. As a non-parametric test for statistical dependence between two variables, it is appropriate when the underlying distribution of the data is unknown or is not normally distributed. This statistic was chosen due to the skewed distribution of burn severity values. Nepstad et al [9] also uses non-parametric rank correlation analyses for skewed, non-normally distributed data to test for relationships between deforestation in indigenous lands and time since first contact with non-indigenous groups, and reserve population density [9]. Ferreira Barbosa et al uses a nonparametric rank correlation statistic, the Spearman correlation coefficient, to identify relationships between fire foci and carbon emissions, burned area, and multiple climatic variables [45].
Methods are summarized in figure 3.
3. Results and discussion
3.1. Frequency and seasonality by fire type
The proportion of Forest Fires recorded in the state of Mato Grosso (48.3%) was higher than that recorded in all of Brazil within the Amazon Basin (30.7%), whereas the proportion of Recently Deforested Fires was lower in Mato Grosso (22.6%) than that of the Brazilian Amazon Basin (39.5%). Compared to the entire country, Mato Grosso therefore showed more individual fire activity related to burning undisturbed forest or the escape of other fire types into forest. Some 96 of 689 major fires, or about 13.9% (counting fires by Exclusive type) (table 1) were categorized as Forest and Crop/Pastureland fires. This supports the hypothesis that a major source of Forest Fires is the escape of crop or pastureland management fires past their intended boundaries [13]. Of fires that burned forest, about 7% also occurred on Recently Deforested areas. Dos Reis et al [19] notes a link between deforestation and fire occurrence in central Amazonia.
On average, MAAP recorded larger area but shorter duration fires than did the Amazon Dashboard [20]. This is expected due to the aerosol emissions threshold value of one used as an indicator of a major fire. MAAP also recorded significantly less fires, focusing on fires with significant biomass burning and high aerosol emissions. Major fires with at least part of their area over forest tended to have the highest initial area and total duration (figure 4).
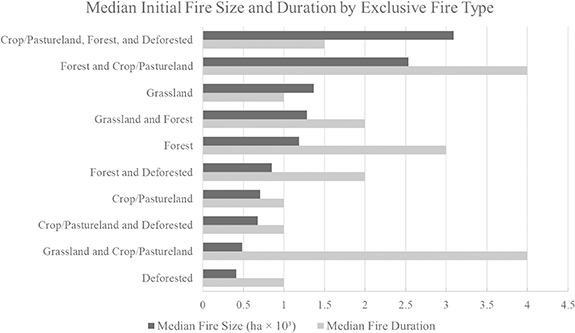
Figure 4. Median of individual major fire size and duration by exclusive type. Fire sizes represent size estimated on the first day of detection.
Download figure:
Standard image High-resolution imageDifferences in seasonal variation by fire type are apparent. Recently Deforested fires had the longest fire season in 2020. The majority of Forest and Crop/Pastureland fires started abruptly in early August and continued into early September (figure 5). Because of the significant number of fires that occurred in both Forest and Crop/Pastureland (about 42.7% of fires in the Crop/Pastureland inclusive class also burned forest, and about 22.3% of fires in the Forest inclusive class also burned crop or pastureland), the seasonal timing of Crop/Pastureland and Forest fire types is similar (figure 5). The mean fire start day of the year (rounded up) for the Deforested, Crop/Pastureland, Forest, and Grassland/Savanna inclusive fire types were 256, 258, 259, and 263, or 11, 14, 15, and 19 September. Therefore, land cover types that were recently impacted by human activities on average burned one to 8 days earlier than those occurring on natural forest or grassland and savanna land covers. This may occur in part due to burning on agricultural and recently deforested lands and subsequent spread into forest or grassland in the following days, which is supported by previous literature [13, 46]. Additionally, landowner interviews conducted in the state of Pará suggest that younger slashed vegetation tends to be burned earlier in the season than does forest [11]. This, and the fact that recently deforested areas are often burned in preparation for planting or conversion to pasture, may help to explain earlier deforestation start dates [11]. However, landowners' decisions on when to burn are dependent on multiple land management strategies and on the economic standing of individual landowners, making temporal patterns complex [11, 47].

Figure 5. Seasonality of inclusive fire type, as measured by the date of recorded fire starts.
Download figure:
Standard image High-resolution image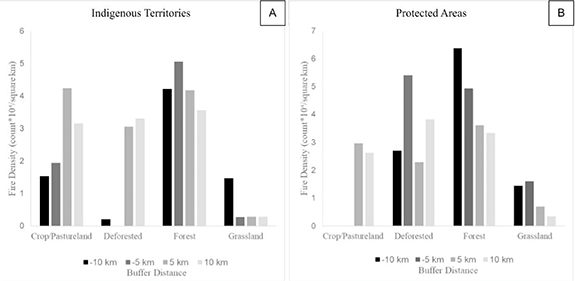
Figure 6. Fire density inside and outside of indigenous (A) and protected (B) areas. Negative buffer distances represent buffers inside indigenous and protected area borders.
Download figure:
Standard image High-resolution image
Timely and efficient fire response must consider when the majority of major fires occur in the season. We found that the second and third quartiles of the start dates for the Forest, Recently Deforested, Crop/Pastureland, and Grassland/Savanna Inclusive types corresponded to 5–23 September, 29 August–30 September, 3–17 September, and 8 September–2 October.
3.2. Spatial distance analysis for indigenous territories and protected areas
Approximately 22% of major fires in 2020 occurred inside ITPA in Mato Grosso. Crop/Pastureland fires and Recently Deforested fires each showed lower densities inside than outside for both 5 km and 10 km buffers. This is expected, as legal protections limit unsustainable or non-indigenous land use in indigenous areas, such as use associated with agriculture or deforestation. In total, fire density was lower at the 5 km and 10 km buffers. The ratio of fire densities outside 5 km to those inside 5 km is approximately 1.62, while the ratio outside 10 km to inside 10 km is approximately 1.39. However, the ratio of Forest fire densities outside to inside indigenous territories was approximately 0.82 for the 5 km buffers and 0.84 for the 10 km buffers. Grassland fire densities also had a ratio below one (0.2) for the 10 km buffers, and therefore did not suggest inhibition by indigenous territories at this distance. Some of this effect may be explained by the fact that Indigenous groups themselves have a well-established history of using fire [14, 48, 49].
Additionally, especially high fire densities closest to the borders (within 5 km) suggest that drivers related to economic or agricultural activity may also be at play. Approximately 13.9% of all major fires and 18.18% of major fires occurring within 5 km inside or outside of an indigenous territory border were classified as both Forest and Crop/Pastureland fires. This suggests that nearly one fifth of major fires inside or very near to indigenous borders may be considered 'spillover fires', or fires used to manage agricultural land that escape into forest, and that the number of spillover fires is higher near indigenous territories. Results agree with those of Santos et al [48], which found that most fire outbreaks were located at the edges of indigenous lands in the state of Rhondonia, Brazil, and that the variation in the number of fires within indigenous lands was explained by the number of fires outside of them. Fonseca Morello et al [50] suggests that the relationship between fire occurrence and indigenous lands may be complex; they recorded a positive relationship between fire occurrence and area of indigenous lands within municipalities. We recognize that there is a potential for leakage or blockage, whereby fires are diverted from ITPAs to surrounding areas. In these cases, it is possible that the total number of fires is not reduced, but the location of fires is simply diverted [51]. However, quantifying leakage or blockage is outside the scope of this study.
Forest and Recently Deforested fire types also showed higher densities inside than outside of protected areas when comparing 5 and 10 km buffers (figure 5). Similar to the pattern noted for indigenous territories, protected areas show inhibition of fires as measured by fire density for Crop/Pastureland fires. Unlike indigenous territories, we note that major fire frequency inside protected areas drop down to zero past 10 km inside. However, the ratio of fire densities of the inner to outer 5 km bands is approximately 0.8, while that of the inner to outer 10 km bands is 0.96. This indicates that fire density inside and outside the borders are more disproportionate at a smaller distance. One caveat is that this result is derived from fire frequency only, and does not consider burned area.
Results suggest that protected areas have an inhibitory effect overall, but do not entirely prevent major fires from occurring based on density. Although Article 38 of Law 12 561 (Law for Protection of Native Vegetation) prohibits use of fire applied to vegetation except for research purposes or for agriculture, sustainable resource use is allowed in some protected areas, including Environmental Protection Areas, Areas of Relevant Ecological Interest, State and National Forests, Extractive Reserves, Wildlife Refuges, Sustainable Development Reserves, and Private Natural Heritage Reserves. These represent about 8.7% of the total area of protected areas in Mato Grosso, and contained about 38.7% of major fires inside all protected areas. Although setting fires to natural vegetation is banned, resource use that leads to degradation of forest, such as logging, can result in greater susceptibility to fire. Further research on resource use within protected areas that allow sustainable use may help to evaluate its connection to fire activity in comparison to fully protected areas.
Disaggregating fire events by type provided information on the drivers of fire. The relatively high rate of fires classified as both Crop/Pastureland and Forest occurring within 5 km of indigenous territory borders (18.18%) suggests that either spillover of management fires or encroachment of agriculture may be occurring. Other studies have similarly linked land use drivers to fire occurrence. Nelson and Chomitz [52] found a strong positive relationship between fire activity and deforestation in Latin America and the Caribbean by comparing active fire detections to forest cover loss. De Oliveira et al [12].
3.3. Burn severity
Results showed little to no difference in burn severity values across fire types. This could be due to the fact that fire presence data consisted of high-biomass burning fires, which may share burn severity characteristics. However, when considering the relationships between burn severity and distance to IT or PA, fire types showed varying relationships. The Crop and Pastureland and Grassland Exclusive type, as well as the Forest and Grassland Exclusive type, were excluded from this analysis due to their low sample sizes (table 1). Both Inclusive and Exclusive forest fire types (for both distance to IT and PA) showed correlations between burn severity, as measured by dNBR, and distance to IT or PA, according to a Kendall rank correlation coefficient test. Specifically, for the Inclusive Forest Fire type, distance to both indigenous and protected areas was correlated to burn severity (τ = −0.112, P = 0.001 and τ = −0.135, P < 0.001, respectively). In terms of exclusive fire types, the Forest and Crop/Pastureland type showed a weak positive relationship between burn severity and distance to protected areas (τ = 0.282, P < 0.001). The exclusive Forest type shows a weak negative relationship between burn severity and distance to indigenous territories (τ = −0.156, P < 0.001). These results support a slight inhibition of the most severe fires that occur on forest-cropland interfaces, but not necessarily forested areas alone, based on distance to protected areas.
4. Conclusion
Understanding the types, spatial relationships, and timing of fire that pose the greatest risks to indigenous and protected areas can help stakeholders inform and prioritize fire response efforts to high biomass-burning fires, mitigating ecosystem disturbance and illegal fire activity. Results from this study suggest that about 22% of major fires in 2020 occurred inside ITPA in the study area. Indigenous territories inhibited the density of major Crop/Pastureland and Recently Deforested fires within but did not significantly inhibit the density or frequency of major Forest fires. Protected areas inhibited the number of all major fires past 10 km inside borders, but a higher density of forest fires within 10 km inside than outside is noted. Additionally, desegregating fire monitoring data by fire type allowed for a deeper analysis of fire drivers. We found that 22.65% of major fires occurred over land that was recently deforested, suggesting that prior disturbance may increase risk of future fire. The higher proportion of fires classified as both Crop and Pastureland and Forest occurring within 5 km of indigenous territories suggests the occurrence of spillover fires or encroachment of agriculture. Analysis of burn severity suggests a complex relationship between burn severity and distance to ITPA, which may be influenced by fire type and differences in burning practices. Analysis of fire timing points to average fire start days in mid-September, suggesting that fire response efforts in Mato Grosso should be focused in September.
While this study suggests that ITPA play a role in inhibiting major fires in Mato Grosso altogether, results support the hypothesis that fire is still a serious issue near ITPA borders, despite protections. More resources are needed to mitigate fires occurring near ITPA borders, which could include improved monitoring of agricultural encroachment and the implementation of fire risk reduction measures to reduce the risk of spillover. As an active agricultural frontier, land policy and protection status in Mato Grosso plays an outsized role in anthropogenic fire regimes. Overall, this study highlights the need for stronger protections and monitoring of fire activity in Amazonian frontier lands.
Acknowledgments
The authors want to acknowledge Planet for providing access to high resolution satellite imagery through their Education and Research Program, as well as Google Earth Engine for the use of their platform. We would like to thank the Monitoring of the Andean Amazon Project (MAAP) for providing guidance on the MAAP application and data collection process and for allowing the use of their data. Thanks also to Henrique Vale Costa for contributions and guidance on data collection and to Matt Finer and Douglas Morton for their guidance on data use. Funding for this research was provided by National Aeronautics and Space Administration (NASA) SERVIR through NASA Cooperative Agreement 80MSFC22M001. The authors declare no conflicts of interest.
Data availability statement
The data that support the findings of this study are available upon reasonable request from the authors.