

Abstract
Exposure to ozone (O3) is associated with many human health problems, resulting in tens of thousands of premature deaths annually in Europe. This study quantifies the impact of changes in anthropogenic emissions of O3 precursors on premature deaths from long-term O3 exposure in Europe and the impact of emissions changes during 2005–2015 using the nested-grid chemical transport model Goddard Earth Observing System (GEOS)-Chem and its adjoint. In 2015, it is estimated that a 20% decrease in total anthropogenic emissions in our modeled European domain could prevent 1576 (467–3252) premature deaths from respiratory disease ( 30 years of age), 70% of which is owing to the decrease in nitrogen oxides (NOx) emissions. Underlying this aggregate effect is substantial spatial variation. In most of Europe, O3 formation is NOx-limited so that NOx emission reductions help to decrease premature deaths. Yet where O3 formation is NOx-saturated (as in parts of the United Kingdom, Benelux and Germany) emission reductions cause more premature deaths through increased ozone exposure. Despite the overall decreases in anthropogenic emissions, the marginal benefit, expressed as the avoided premature deaths per 1 kg km−2 yr−1 reduction in NOx emissions, is found to generally increase during 2005–2015, with a mean value more than doubling over Europe. This highlights the general trend that O3 formation becomes less sensitive to volatile organic compound emissions and more limited by NOx emissions. An important policy implication of increasing marginal benefits is that more costly regulations of NOx emissions are economically justified even as total anthropogenic emission are declining. NOx contributions from road transport, industry, energy, and residential sectors are most affected by the change in the O3 production regime. Consequently, European regulations of NOx emissions targeted at those sectors will yield the highest health benefits per unit NOx emission of all sources.
Export citation and abstract BibTeX RIS

Original content from this work may be used under the terms of the Creative Commons Attribution 4.0 license. Any further distribution of this work must maintain attribution to the author(s) and the title of the work, journal citation and DOI.
1. Introduction
There is increasing epidemiological and toxicological evidence suggesting that long-term ozone (O3) exposure leads to significant adverse impacts on human health, especially due to respiratory diseases [1–4]. With more participants included and a longer follow-up than the original work of Jerrett et al [5], Turner et al [6] use the American Cancer Society Cancer Prevention Study (ACS CPS-II) to update quantification of the relative risk of premature death attributable to long-term O3 exposure. Malley et al [7] estimate that long-term O3 exposure in 2010 results in 0.40–0.55 million and 1.04–1.23 million premature deaths from respiratory illness globally based on earlier [5] and updated [6] CPS-II exposure response relationships, respectively. The increases in the potential magnitude of the O3-related health impacts indicate more severe public health impacts of O3 exposure than previously thought.
Tropospheric O3 is formed through photochemical reactions among nitrogen oxides (NOx ), volatile organic compounds (VOCs), and carbon monoxide (CO). Non-linearities in this chemistry imply that ambient O3 concentrations can be highly sensitive to changes in precursor emissions, not just in terms of magnitude but also in terms of sign. Thus, tracing the response of O3 pollution to emission changes is of extraordinary importance for designing effective environmental policies. Approaches to identify which emissions contribute most to O3 are mostly based on chemical transport models (CTMs), which either tag precursor emissions from particular source categories or regions [8, 9], perturb certain emissions to quantify their contributions [10–12], or employ instrumented versions of the CTM to calculate first or second order O3 sensitivities [13]. Such methods have been applied to investigate the response of O3-related health impacts to emission changes in previous studies [14]. For example, Anenberg et al [15] estimate premature deaths avoided from reducing surface O3 via 20% cuts in anthropogenic emissions of NOx , VOCs, and CO across different source regions, suggesting that foreign emission reduction contributes to over 50% of the mortality reduction in Europe. By subtracting specific sectoral emissions from total emissions, Lelieveld et al [16] find that residential emissions contribute most to the premature mortality linked to outdoor fine particulate matter (PM2.5) and O3 pollution, making up 31% of the total air pollution-related premature deaths worldwide in 2010. While these approaches provided valuable insights, their applicability is limited by computational costs when attempting to estimate contributions from a large (>100) number of sources resolved at finer spatial and temporal resolution.
To meet the need for more detailed analysis of sources of the health burden of air pollution, the adjoint source attribution approach has been developed and applied in several prior studies focusing on the health burden in different cities and regions [17–21]. An adjoint model calculates the sensitivities of either the pollution exposure or the exposure related health burden over a particular receptor region to each individual emission (grid cell, species, and time step) with a computational cost that only scales with the number of receptor functions or regions that are considered [22, 23]. Based on a global adjoint simulation, Nawaz et al [20] quantify the regional and sectoral emission contributions to the health impacts associated with PM2.5 and O3 in each of the Group of Twenty (G20) countries. Their results show that transportation emissions contribute 42% of the O3-related premature deaths across all G20 countries due to the strong sensitivity of O3 to NOx emissions. When it comes to specific regions, the global simulation, however, introduces uncertainty in the health assessment since the coarse spatial scale of the simulations have difficulties in capturing sub-grid variabilities of emissions and pollution exposure [24, 25]. While exposure estimates for O3 are less affected by coarse model resolution than e.g. PM2.5 [24] given its relatively long lifetime, global O3 simulations are still limited in resolving contributions from individual sources or urban areas, and thus high-resolution simulations to identify particular receptor regions are still needed to obtain more accurate regional source apportionment results.
In Europe, long-term O3 exposure is estimated to have led to 16 000–55 000 annual premature deaths due to respiratory and other diseases during the past decade [26–31]. Contributions of emissions to European O3 pollution, as we mentioned above, have been examined focusing on particular sectors, regions and time periods [11–15] due to the limitation of source attribution approaches. The adjoint method is only applied in certain European city areas without a focus on health impacts [32, 33]. Detailed response of the O3-related health burden to changes in species and sectoral emissions and how it has changed over time therefore remain to be further investigated. Our prior study has employed a nested adjoint calculation to conduct source attribution of PM2.5-related health impacts in Europe [21]. In this study, we augment this model calculation to include O3-related health impacts, to evaluate species, sectoral and regional emissions contributions to the O3-related health burden. Given the non-linear relationship between O3 and its precursors, we focus on the marginal sensitivity of O3 to each source and investigate how the marginal benefit brought by various emission reductions has changed as the emission control is advanced. We consider the period 2005–2015 when the European emissions of O3 precursors, notably NOx and VOCs, were reduced under the first stage of emission controls (e.g. Directive 2001/81/EC and 2008/50/EU). Based on the HTAPv3 emission inventory [34], the health benefits associated with different types of emissions reductions are quantified to inform efficient policies to reduce the health risks resulting from O3 pollution.
2. Methods
2.1. Air quality and adjoint modeling
We simulate O3 and its sensitivity to various precursor emissions in a European domain ('Europe', 32.75–61.25° N, −15–40° E) using a nested-grid capability of the Goddard Earth Observing System (GEOS)-Chem chemical transport model (v9–02, www.geos-chem.org, last access: 11 October 2022) and its adjoint (v35n) [22]. The model is driven by assimilated meteorology from the GEOS-FP of the NASA Goddard Earth Observing System at a resolution of 0.25°× 0.3125°. Model configurations and emissions are described in text S1. We perform six 2 month simulations to generate the BASE results during April to September in 2015. Each simulation includes one month of adjoint forcing and two months of adjoint integration (in order to e.g. capture the influence of emissions in April on O3 in May), and can be executed in parallel for computational efficiency. Concentrations from the forward model, which is the standard GEOS-Chem simulation, are used as the restart files so that consistent and reasonable initial conditions can be generated. The restart files for each of these simulations come from a continuous 7 month simulation from March to September. We consider the receptor function as the total health burden attributable to O3 exposure in all European countries listed in the Global Health Data Exchange included in our nested domain. The adjoint simulation calculates the response, or sensitivity, of the health impact receptor function ( ) to changes in emissions of NOx
, VOCs, CO, sulfur dioxide (SO2), and ammonia (NH3) everywhere in our nested domain:
) to changes in emissions of NOx
, VOCs, CO, sulfur dioxide (SO2), and ammonia (NH3) everywhere in our nested domain:

where  is the adjoint sensitivity of the receptor function to emissions of species
  in model grid cell
  in month
2.2. Health impact calculation
The O3-related health burden is calculated according to the estimated relative risk for premature deaths due to respiratory diseases in association with the 6 month average (April to September) of the maximum daily 1 h average O3 concentration ( ) based on the CPS-II cohort study of Jerrett et al [5]. The receptor function (
 ) can be expressed as:


where  and
and  are the baseline mortality rate and the population, respectively, for age group
  in grid cell
  in country
  . Age composition and baseline mortality rate are obtained from the Global Burden of Disease (GBD) Results Tool (https://vizhub.healthdata.org/gbd-results/, last access: 1 February 2023). Following [27], mortality causes considered here match the International Classification of Disease tenth revision (ICD-10) codes for respiratory disease in the population
  30 years of age. Total population is obtained from the fine resolution (∼1 km) population estimate of the Center for International Earth Science Information Network [35]. The hazard ratio
  in grid box
  is calculated according to the exposure response relationship reported in Jerrett et al [5], which suggested a HR of 1.040 (CI: 1.013, 1.067) per 10 ppb increment in
  .
.  is the O3 increment above the theoretical minimum risk exposure level (TMREL) of 33.3 ppb [5], and
  is the exposure-response factor capturing the log-linear relationship between the health risk from respiratory disease and O3 exposure.
2.3. Source attribution and sensitivity experiments
Given the non-linear O3-precusor relationship as well as the non-linearity in the exposure response function (section 2.2), we apply a first-order approximation to quantify the response of O3-related premature deaths in Europe to a 20% change in anthropogenic emissions from each species and sector:

where the contribution ( ) resulted from a 20% reduction in emissions (
 ) from species
  , sector
  , and grid cell (
 ) in month
  is calculated according to the adjoint sensitivity (
 ). The accuracy of this first-order estimate in describing the O3-NOx
-VOCs relationship has been demonstrated by Nawaz et al [20], who compared effectiveness of the standard first-order calculation to that of the second-order approach and finite difference test by examining
). The accuracy of this first-order estimate in describing the O3-NOx
-VOCs relationship has been demonstrated by Nawaz et al [20], who compared effectiveness of the standard first-order calculation to that of the second-order approach and finite difference test by examining  changes for different emission levels. Their results suggest the response of O3 to NOx
emission changes can be well characterized by the first-order calculation. The bias and correlation relative to the response obtained by the forward model perturbation are comparable to those calculated by the second-order approach with ±50% NOx
emission changes. As the O3-VOCs relationship is less non-linear compared to that of O3-NOx
[36], we assume the response of O3-NOx
-VOCs relationships to a 20% change in emissions can be well characterized by the first-order approximation in this study. The conducted sensitivity experiments are displayed in table 1.
changes for different emission levels. Their results suggest the response of O3 to NOx
emission changes can be well characterized by the first-order calculation. The bias and correlation relative to the response obtained by the forward model perturbation are comparable to those calculated by the second-order approach with ±50% NOx
emission changes. As the O3-VOCs relationship is less non-linear compared to that of O3-NOx
[36], we assume the response of O3-NOx
-VOCs relationships to a 20% change in emissions can be well characterized by the first-order approximation in this study. The conducted sensitivity experiments are displayed in table 1.
Table 1. Configuration of the numerical experiments.
| Scenario | Description |
|---|---|
| BASE | The base simulation conducted with anthropogenic emissions and meteorology in the year 2015. |
| EMI2005 | Similar as BASE, but with the anthropogenic emissions changed from 2015 to 2005. This scenario is used to quantify the impact of emission changes by comparison to BASE. |
| MET2013 | Similar as BASE, but with meteorology from 2013. This scenario is used to quantify the impact of meteorology by comparison to BASE. |
| MET2014 | Similar as BASE, but with meteorology from 2014. This scenario is used to quantify the impact of meteorology by comparison to BASE. |
| FWD_TEST | Forward model perturbation, in which the anthropogenic emissions within the nested domain are reduced by 20%. This scenario is conducted to evaluate the marginal benefit calculated according to the adjoint simulation (BASE). |
a As quarter resolution GEOS-FP in 2005 is not available, we change the meteorology to 2013 and 2014 to investigate impacts of meteorological interannual variability.
3. Results
3.1. Health impacts attributable to O3 exposure
In 2015, the total O3-related health burden in Europe is estimated to be 25 432 premature deaths. This estimate lies in the range of previous estimates (16 000–55 000) for Europe, even with some variability across these studies in terms of the year considered and countries included [26–31]. The uncertainty of our estimate is discussed in more detail in section 3.4. As figure 1(a) shows, large amounts of O3-related premature deaths occur in coastal and central regions, among which Germany (15.4%), Italy (12.6%), Spain (9.5%), and the United Kingdom (UK, 8.3%) are the countries where the highest number of deaths occur, making up 45.8% of the total O3-related health burden in Europe. The number of O3-related deaths is closely associated with the exposure level as well as the respiratory mortality rate in each country (figure 1(b)). For example, the high incidence in Italy is driven by high O3 exposure near the Mediterranean (figure 1(c)) whereas in the UK it is due to the high baseline of respiratory mortality among the local population. In addition, the health burden scales with population as can be seen in densely populated areas like Benelux (figure 1(d)).

Figure 1. (a) The spatial distribution of O3-related premature deaths (unit: deaths per grid cell) from respiratory diseases ( 30 years of age) over the receptor region in 2015. (b) The associations of O3-related premature deaths with the O3 exposure and baseline mortality rates for respiratory illness. The size of each bubble represents the total premature death attributable to O3 exposure (premature deaths per 100 000 population) in each European country, which is also stated following country names for each bubble. The color of each bubble indicates whether the number of O3-related premature deaths in this country were larger or no more than 5 per 100 000 people. A country name followed by an asterisk indicates a country that only lies partially within our nested model domain. (c) and (d) are the average daily maximum 1 h O3 concentration between April and September (6 mDM1h, unit: ppbv) and the spatial distributions of the population (unit: thousand people per grid cell) in 2015, respectively. The horizontal resolution of (a), (c) and (d) is 0.25°× 0.3125°.
Download figure:
Standard image High-resolution image3.2. Response of the health impact to anthropogenic source changes
Figure 2(a) displays the number of avoided O3-related premature deaths everywhere in Europe resulting from a 20% decrease in anthropogenic emissions in each grid cell in 2015. We refer to this as the marginal benefit as it approximates the contribution of the last unit of pollution emitted on premature deaths (as distinct from the 'total contribution' corresponding to a 100% reduction in emissions). Note that the marginal benefit is negative when O3 increases. A 20% reduction in emissions prevents 1576 premature deaths in Europe. Decomposed by species, we estimate marginal benefits of anthropogenic emissions as: NOx (1,105), VOCs (381), CO (99), SO2 (18), and NH3 (−28). The small negative contribution from NH3 emissions is owing to its role in the chemical sink of NOx via formation of ammonium nitrate aerosol. As NOx , VOCs, and CO account for 99% of the positive contributions from anthropogenic emission changes, we focus on these species in the remainder of our analysis. The sign of the contributions from NOx emission changes largely determines whether reducing anthropogenic emissions has net positive or negative impacts on the O3-related health burden. In most European countries, NOx emissions make positive contributions to the O3-related health burden. O3 formation in these areas is NOx -limited, and NOx emission control would be an efficient approach to reducing O3-related health risk. The negative NOx contributions in areas like southern UK, Benelux, and Germany suggest that the O3 formation regime is NOx -saturated (VOC-limited), and hence NOx reductions—while providing health benefits via PM2.5 decreases [21]—aggravate health risks attributable to O3 exposure. The boundary between NOx -limited and VOC-limited conditions shifts in space over time. Consistent with satellite-based estimates of patterns of NOx vs VOC limited regimes [37], our results (figure S1) show that the area of the negative-NOx -contribution regions expands as temperature decreases. In southern UK and Benelux, O3 production is NOx -saturated all year. In Germany, the O3 formation regime shifts from NOx -saturated to NOx -limited during June to August, indicating that regulating NOx in summer and VOCs in other seasons would maximize O3-associated health benefits.
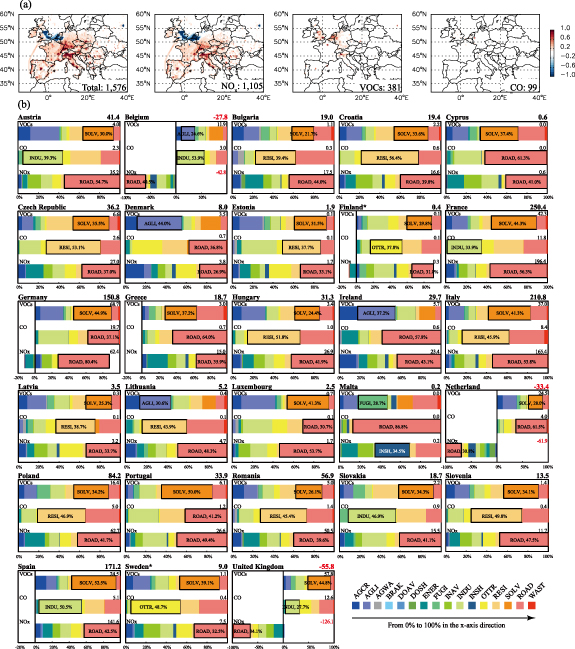
Figure 2. (a) The distribution of marginal benefits, expressed as the number (unit: deaths per grid cell, 0.25°× 0.3125°) of avoided O3-related premature deaths in Europe resulting from a 20% decrease in anthropogenic emissions in each grid cell in 2015. The marginal benefits for total anthropogenic emission changes and those for anthropogenic emissions of NOx , VOCs, and CO are presented. A positive value suggests that emission reductions are conducive to reducing the health burden, while a negative value indicates that emission reductions exert adverse impacts on public health in Europe. The number in the bottom right of each figure is the total contribution due to a 20% change in domain-wide anthropogenic emissions. (b) The O3-related premature deaths everywhere in Europe avoided by a 20% decrease in each species and sectoral emissions aggregated by country. The total number of O3-related premature deaths avoided by a 20% decrease in anthropogenic emissions in each country is reported next to the country name. The bars indicate the contributions to this total from domestic emissions of NOx , VOCs, and CO, with the absolute number of the contribution of a species reported next to its name. The breakdowns of each bar shows the share of the contributions from different sectors. From 0% to 100% in the x-axis direction, these sectors are agriculture crops (AGCR), agriculture livestock (AGLI), agriculture waste (AGWA), brake and tyre (BRAK), domestic aviation (DOAV), domestic shipping (DOSH), energy (ENER), fugitive (FUGI), international aviation (INAV), industry (INDU), international shipping (INSH), other ground transport (OTTR), residential (RESI), solvent (SOLV), road transport (ROAD), and waste (WAST), respectively. The largest sectoral source for each species contribution from each country is outlined, with the corresponding sector name and percent contribution to the country-level species contribution written inside. A country name followed by an asterisk indicates a country that only lies partially within our nested model domain.
Download figure:
Standard image High-resolution imageFigure 2(b) displays the marginal benefit aggregated to the 27 European Union (EU) member states and UK. Reducing emissions by 20% in France, Italy, and Spain yields the largest health benefits by avoiding, respectively, 250, 211, and 171, O3-related premature deaths in Europe. In contrast, emission reductions in Belgium, Netherland, and UK make negative contributions to the O3-related health burden due to the NOx -saturated conditions (figures 2(a) and S1). The road transport (ROAD) sector constitutes the dominant source of NOx emissions in most of Europe, contributing 26.9%–80.4% of the total premature deaths that could be avoided by a 20% decrease in NOx emissions in each country. The marginal benefit of reducing VOC emissions is mostly contributed by the solvent and agriculture livestock (AGLI) sectors, while the industry (INDU), residential (RESI), and ROAD sectors are the leading contributors to the marginal benefit of CO emission reductions. Our results also indicate that NOx emissions from different sectors within the same country might have opposite impacts on O3-related health impacts. For instance, in Germany, a 20% reduction in NOx emissions generally helps to avoid deaths, in particular for emissions emanating from transportation activities. In contrast, NOx control at German power plants has a negative effect on public health in Europe. As figure S2 shows, hotspots of NOx emissions from the energy (ENER) sector exhibit a strong spatial overlap with NOx -saturated areas in Germany, as identified by high NOx /VOC emissions ratios and relatively high ambient ratios of NOx to formaldehyde. While transportation generates more NOx emissions overall, those emissions are concentrated in urban areas where the presence of high VOC emissions prevents NOx -saturated O3 regimes. In contrast, high NOx /VOC ratios in both emissions and ambient concentrations, together with the magnitude of emissions and corresponding negative contributions, suggest that energy emissions are mainly responsible for NOx -saturated O3 regimes in Germany. In the other NOx -saturated regions identified by figure S2(c), especially where the ENER emissions are low (e.g. the Netherlands), shipping and aviation emissions should also be important sources that contributed to O3 depletion, given the large NOx /VOC emissions ratios.
3.3. Marginal emissions contributions from 2005 to 2015
According to calculations for the BASE and EMI2005 scenarios, the number of O3-related premature deaths in Europe (a.k.a. receptor function) falls by about 10% between 2005 and 2015, from 28 312 to 25 432. Despite precursor emissions falling by 19%–32% (table S1), however, the marginal benefit of a further 20% decrease in anthropogenic emissions increases from 1304 avoided premature deaths in 2005 to 1576 in 2015. Subdividing by pollutant and normalizing by absolute emissions reductions yield that the marginal benefit of abating one unit of NOx more than doubles (+128%) between 2005 and 2015. Following the economic logic of equalizing marginal benefits and marginal abatement costs, this finding provides strong support for tighter regulations of NOx emissions in Europe. In contrast, marginal benefits per unit of abatement for VOCs and CO decline only slightly over this period (−11% and −9%, respectively), owing to the non-linear nature of O3 formation.
Figure 3(a) shows the spatial extent of those changes by plotting the response of O3-related premature deaths to 1 kg km−2 yr−1 change in NOx emissions in 2005 and 2015. Negative O3 response to NOx emission changes generally weakens in NOx -saturated areas such as southern UK, Benelux, and Germany, while the positive O3 response becomes stronger in NOx -limited areas. The results point to a change in the predominant O3 formation regime in Europe, in that O3 formation becomes less sensitive to VOC emissions but more limited by NOx emissions due to the emission changes during 2005–2015. The anthropogenic emission changes during the studied period are shown in figure S3. The changes in marginal contributions in most NOx -saturated areas are related to stronger reductions in NOx emissions than in VOC emissions. In the Netherlands, the lack of VOC emission reductions further weakens the negative O3 response to NOx , since the VOC emissions exhibit distinct increases during the studied period. Such VOC increases are related to the intensified agriculture, with the VOC emissions from the AGLI sector increasing over 60% during April to September according to the HTAPv3 emission inventory [34]. In NOx -limited areas, O3 formation is not sensitive to VOC emission changes. The increased marginal contribution is thus mostly caused by the large NOx emission reductions, especially those from the ROAD sector.

Figure 3. (a) The spatial distributions of O3-related premature deaths attributable to 1 kg km−2 yr−1 change in local NOx emissions in 2015 and 2005, and corresponding differences. (b) O3-related premature deaths that can be prevented by a 20% decrease in each species and sectoral emissions in 2015 and 2005. The inner ring indicates the O3-related premature deaths everywhere in Europe avoided by a 20% decrease in each species emissions, and the outer ring indicates the deaths prevented a 20% decrease in corresponding species emissions from each sector. The number of avoided premature deaths is marked after the name of each species and sector. The sector names are the same as those defined in figure 2. The receptor function ( and
and  ), the marginal benefits brought by all the anthropogenic emission reductions (
 and
and  ), and those by reductions in anthropogenic emissions of species other than NOx, VOCs, and CO (Others) are also presented.
Download figure:
Standard image High-resolution imageAs figure 3(b) shows, most increases in the total marginal benefit are due to the contribution from NOx emissions, which increases by over 85% (∼509 deaths) from 2005–2015. This indicates that per-unit NOx emission reduction yields higher health benefits at lower overall emissions levels. The share of contributions from ground transportation emissions (ROAD and other ground transport (OTTR)) decreases while that of contributions from international aviation emissions increases in each species contribution. The results are consistent with those reported by prior studies that ground transportation emissions are effectively reduced while aviation emissions increase in Europe during the studied period [38, 39]. In tables S1 and S2, we present more details of the marginal benefit and the total anthropogenic emissions in 2005 and 2015. Considering the magnitude and relative changes, the marginal benefits associated with the ROAD, INDU, RESI, and OTTR sectors exhibit the largest increases due to the O3 chemistry changes, despite the decreased NOx emissions. The negative-to-positive shifts of the marginal benefit of NOx emission reductions from the ENER sector indicate that the adverse impacts of the energy-related NOx reductions on public health decrease owing to the emission changes. As the energy emissions are important sources affecting NOx -saturated regions in Europe, further emission reductions from energy sources could help to mitigate the negative impacts of emission reductions in these areas and bring increasing health benefits as emissions are further regulated.
3.4. Uncertainties
Uncertainties in our results arise from two major areas: the CTM-related calculations and the health impact assessment. As covariance between these two aspects is not well known, we treat them independently to estimate total uncertainty.
CTM-related uncertainties arise from uncertainty in estimating O3 concentrations using the forward model and uncertainty in calculating O3 source-receptor sensitivities using the adjoint model. These both are related to uncertainties in emissions, meteorology, and the chemical and physical processes represented by GEOS-Chem. A measure of these uncertainties is the accuracy of the model estimated O3 compared to in-situ measurements provided by the European Environment Agency Air quality e-reporting database. As figure S4 shows, the overall mean bias in the model estimated O3 concentration ( ) is approximately +0.27 ppb over the 1794 European monitoring sites, which translates into a slight overestimation (∼1%) in O3 levels and related health impacts over the domain. Though simulated O3 concentrations exhibit relatively larger bias in low O3 areas (observed O3 concentrations <30 ppb), they show good agreement with observations in most monitoring sites, and the normalized mean bias is within ±10% at over 73% of the sites. Additional uncertainty arises when estimating the marginal benefit changes during 2005–2015, since we only account for impacts of emission changes. This neglects uncertainty owing to interannual variability in meteorology, which also influences the accuracy of O3 simulation [40–43]. To bound this, our sensitivity results show that the year-to-year meteorology variability causes 2.5%–22.5% changes in the absolute species contributions (figure 4) and −12.0%–+5.3% changes in the proportional species contributions (figure S5). Compared to those (−51.6% to +148.1%) induced by emission changes, the differences are small. The change in O3 chemistry associate with emission changes is thus the dominant factor influencing the marginal benefit changes. Our adjoint calculations can be numerically verified by comparison to results from the forward model perturbation (FWD_TEST), where a 20% decrease in anthropogenic emissions avoids 1779 and 1415 premature deaths in 2015 and 2005, respectively. As the adjoint results depend largely on emissions, we discuss possible impacts of the uncertainty in the emission inventory in text S2.
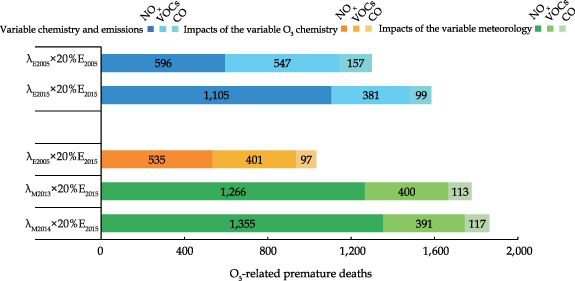
Figure 4. The response of the receptor function to a 20% change in anthropogenic emissions of NOx, VOCs and CO over the nested domain in 2005 and 2015. Three types of total marginal benefit are presented. In the case 'Variable chemistry and emissions,' the species contributions in 2005 and 2015 are calculated according to emissions in corresponding years and the O3 sensitivity from EMI2005 ( ) and BASE (
 ), respectively; in the case 'Impacts of the variable O3 chemistry,' the species contributions in 2015 are calculated according to the O3 sensitivity obtained from the EMI2005 scenario, which is used to compare with the estimated values obtained from the BASE simulation; in the case 'Impacts of the variable meteorology,' the total species contributions in 2015 are calculated according to the O3 sensitivity obtained from the MET2013 (
 ) and MET2014 (
 ) scenarios, respectively, to quantify the impacts of interannual meteorological variability by comparing them with those from the BASE simulation. The numbers marked on each segment of the color bars are the total marginal benefits due to a 20% reduction in anthropogenic emissions of each species over the nested domain.
Download figure:
Standard image High-resolution image
Health assessment-related uncertainties arise from uncertainty in estimates of population, baseline mortality rate, and the exposure response relationship. We adopt the health assessment approach from Jerrett et al [5] rather than a later method from Turner et al [6] since the latter is based on annual average O3 exposures. As we consider the marginal benefit over a large European region, the annual total contribution would be mitigated by enhanced negative ones in winter due to a shift in the spatial extent of different O3 formation regimes (figure S1). There is also greater certainty in all-cause mortality impacts of peak O3 exposure compared to annual [44]. We thus only focus on the O3 pollution season from April to September. The uncertainty bounds of the population and mortality rate have been discussed in Gu et al [21], where the former is 1.9%–11.3% (population-weighted) in total European population in 2015 and the latter are provided explicitly by the GBD results. Using those bounds and ranges for the hazard ratio (1.013–1.067) [5], we estimate the total number of O3-related premature deaths from respiratory diseases ( 30 years of age) to be 25 432 (7356–53 160) over Europe in 2015. The uncertainty (−71%–+109%) associated with the health assessment is still the major source of uncertainty, and thus we report these ranges in the summaries of our findings. To quantify the impacts of population and baseline mortality rate, we find that demographic changes alone under conditions of constant exposure and meteorology lead to a decrease in NOx
and VOC contributions by −4.3% and −11.8%, respectively in 2005, while the source attribution results are only slightly affected (figure S6). We consider the lower bound of TMREL (33.3 ppb) in Jerrett et al [5]. Given there's limited evidence that a 'safe' O3 threshold exists below which there's no health risk, our estimates might still underestimate the absolute health burden in Europe. However, as the 6mDM1h O3 concentrations are all above the TMREL over our receptor region, the health assessment-related uncertainties would only greatly affect the absolute values of the estimated premature deaths. The relative contributions of different species and sectors are largely determined by the CTM calculations. Thus, our relative results of the source attribution should be generally representative, with uncertainties close to those of the CTM calculations.
30 years of age) to be 25 432 (7356–53 160) over Europe in 2015. The uncertainty (−71%–+109%) associated with the health assessment is still the major source of uncertainty, and thus we report these ranges in the summaries of our findings. To quantify the impacts of population and baseline mortality rate, we find that demographic changes alone under conditions of constant exposure and meteorology lead to a decrease in NOx
and VOC contributions by −4.3% and −11.8%, respectively in 2005, while the source attribution results are only slightly affected (figure S6). We consider the lower bound of TMREL (33.3 ppb) in Jerrett et al [5]. Given there's limited evidence that a 'safe' O3 threshold exists below which there's no health risk, our estimates might still underestimate the absolute health burden in Europe. However, as the 6mDM1h O3 concentrations are all above the TMREL over our receptor region, the health assessment-related uncertainties would only greatly affect the absolute values of the estimated premature deaths. The relative contributions of different species and sectors are largely determined by the CTM calculations. Thus, our relative results of the source attribution should be generally representative, with uncertainties close to those of the CTM calculations.
4. Conclusions
In this study, we quantify effects of precursor emission changes on the O3-related health impacts in Europe using the chemical transport model GEOS-Chem and its adjoint. Our results suggest that 1576 (467–3252) premature deaths can be avoided by reducing anthropogenic emissions within Europe by 20% in 2015. Within these benefits, contributions from emissions of NOx , VOCs, and CO help to avoid 1105 (328–2300), 381 (113–770), and 99 (29–200) premature deaths, respectively. The marginal benefit or contribution of anthropogenic emission reductions is found to increase during the 2005–2015 period despite the overall decreases in emissions. This seemingly counterintuitive finding is driven by a doubling of the marginal benefit per unit of NOx abated, where non-linearities in O3 formation play a prominent role. In NOx -saturated areas, the negative response of O3 to NOx emission changes generally weakens while in NOx -limited areas, the positive response grows stronger as a result of emission changes between 2005 and 2015. Further, within the NOx -limited regime, O3 production is more efficient at low NOx levels than at high NOx levels. The generally strengthened marginal contribution of NOx emissions, especially those related to road transport, industry, energy and residential sectors, leads to 272 (76–581) more premature deaths avoided in 2015 than in 2005 when a 20% decrease in anthropogenic emissions is applied, suggesting that per-unit NOx emission reduction likely brings more health benefits as emissions regulations are advanced in Europe.
Acknowledgments
This project received funding from the European Research Council (ERC) under the European Union's Horizon 2020 research and innovation programme (Grant No. 865181), the National Aeronautics and Space Administration (Grant No. 80NSSC19K0193), the German Research Foundation (DFG) through CRC TR 224 (Project B07), and the University of Mannheim. We acknowledge members of our research team at both the University of Colorado Boulder and University of Mannheim for their contributions.
Data availability statement
The data that support the findings of this study are openly available at https://doi.org/10.5281/zenodo.8379727.
Supplementary data (2.7 MB DOCX)