

Abstract
Considering the anticipated rise in wet extremes due to climate change, effective management of flood risks in global agriculture necessitates an initial assessment of the impact of floods on crop production. Such estimation can inform the development of strategies to enhance the resilience of the global agricultural system against floods, particularly in the face of growing demand for food. To this end, a worldwide calculation of inundation areas' return periods was conducted using a global river and inundation model output. This information was then linked to a global historical yield map, allowing for the identification of flood-induced crop yield changes. The findings revealed that for return periods over ten years, global average yield losses were estimated to be 4% for soy, 3% for rice, 2% for wheat, and 1% for maize. These losses amounted to a total production loss of 5.5 billion United States dollars during the 1982–2016 period. This first global estimation of flood impacts on crop production contributes to the advancement of flood risk management in agriculture, although the limitations identified in this study need to be addressed in future research.
Export citation and abstract BibTeX RIS

Original content from this work may be used under the terms of the Creative Commons Attribution 4.0 license. Any further distribution of this work must maintain attribution to the author(s) and the title of the work, journal citation and DOI.
1. Introduction
Floods occurred an average of 149 times per year worldwide during the 2009–2018 period, and associated losses across sectors accounted for approximately 400 billion United States dollars $B—the total amount of damage to property, crops, and livestock (Centre for Research on the Epidemiology of Disasters CRED 2020). The Food and Agriculture Organization (FAO) of the United Nations reported that floods were the second gravest agricultural disaster, next to droughts, as they were responsible for $21B in crop and livestock loss from 2008 to 2018 in the developing world (FAO 2021). Considering the more significant portion of loss associated with climate-related disasters in the gross domestic product of low-income countries (CRED and UNISDR 2018), reduction of exposure and vulnerability to floods is necessary to achieve no poverty and zero hunger, as the first and the second goals respectively, in the sustainable development goals promoted by the United Nations (https://sdgs.un.org). In mid and high-income countries, minimizing flood damages based on risk sharing and compensation (Förster et al 2008, Erdlenbruch et al 2009) is increasingly important for promoting robust resilience and adaptive capacity to climate hazards as the 13th goal in the SDGs. These activities are critical for coping with the projected increase in flood risk in a warmer climate (Hirabayashi et al 2013, Donat et al 2016) and the associated intensification of the hydrological cycle (Allen and Ingram 2013).
Flood-induced crop losses have been investigated at the regional scale using a process-based crop model (Li et al 2016) or a satellite-based damage index (Chen et al 2019, Rahman et al 2021). Both were useful tools for understanding flood-induced crop losses at their specific scales. However, these methods are not readily applicable to global analysis due to the use of site-specific parameters in the model or index calculation. In addition, the limitations in spatiotemporal coverage of satellite sensing became an inevitable obstacle. A global analysis with country-level datasets of crop yield and flood events was attempted by Lesk et al (2016). This was the first global study estimating the influence of extreme weather disasters on crop production. However, it was unable to identify statistically significant crop losses due to floods worldwide, although crop losses due to droughts and extreme heats were captured. Merely in China, Shi et al (2021) was able to report a decrease in crop yield caused by floods using the same method as used by Lesk et al (2016). If the above shortfalls of the global analysis could be addressed with a new indicator for global estimation of crop loss due to flooding, that would contribute to global flood risk management for the global agricultural system, which needs to be more robust against flooding, given the growing demand for food.
Previous studies have often used excessive precipitation as an indicator of floods (Li et al 2019, Rojas et al 2019). However, a more reliable and systematic approach to defining fluvial floods (hereafter floods), is to use inundation, which is the result of the difference between inputs of precipitation and river flow and outputs of evapotranspiration and drainage. This approach is supported by the fact that regions with high evapotranspiration output, such as sub-dry and dry regions with high temperatures, also have high potential evaporation rates. In such an environment, an increase in precipitation, even an increase relative to the normal precipitation, could result in increased crop yields, despite the occurrence of floods indicated by a precipitation-based indicator (Li et al 2019). Therefore, using inundation as an indicator of flood occurrence is expected to enable a more precise identification of flood impacts on crop losses, taking into account the systematic input and output of water. This is likely why flood-induced crop reduction analyses with precipitation at the global scale have not produced clear results so far, while those at regional scales have (Li et al 2016, Chen et al 2019, Shirzaei et al 2021).
Building upon the aforementioned points, our study will address two main questions: first, can global flood-induced crop losses be identified using inundation area as a flood indicator? Second, where are flood-induced crop losses occurring most significantly worldwide? Additionally, we will address what remaining issues require further investigation in the global assessment of flood-induced crop losses.
2. Method
2.1. Yield changes
We used a 0.5∘-resolution global dataset of historical yields for 1981–2016 (GDHY, Iizumi and Sakai 2020). Annual time series of yield Y (metric tons per hectare, t ha−1) generally have a temporal trend T (t ha−1) which represents yield increases associated with improved technology and management. To include the association with floods, we calculated yield change Yʹ—the ratio relative to the yield trend—in which T was removed from the yield time series as
where i, j, and k are indices of year, grid cell, and cropping season of a crop c, respectively. The n is the total number of the cropping seasons—the main season and the second season for maize and rice, the spring and the winter for wheat, and just one major season for soy (Sacks et al
2010). The time series of  was estimated using a locally weighted regression model (Lu et al
2017) set to the smoother span f = 0.14, corresponding to using a 5-year interval for smoothing of 35-year data. We note here the limitations of crop data inherited from GDHY, which were model estimates and not free from uncertainties due to imperfect modeling, inaccurate inputs, misreporting in agricultural census statistics, and the use of time-constant information in 2000, such as the crop calendar (Sacks et al
2010) and the harvested area (Monfreda et al
2008) used for GDHY. It is particularly important to improve the gaps in crop distributions in the near future, especially when compared to the study by Ray et al (2012), Kim et al (2021), and Grogan et al (2022).
was estimated using a locally weighted regression model (Lu et al
2017) set to the smoother span f = 0.14, corresponding to using a 5-year interval for smoothing of 35-year data. We note here the limitations of crop data inherited from GDHY, which were model estimates and not free from uncertainties due to imperfect modeling, inaccurate inputs, misreporting in agricultural census statistics, and the use of time-constant information in 2000, such as the crop calendar (Sacks et al
2010) and the harvested area (Monfreda et al
2008) used for GDHY. It is particularly important to improve the gaps in crop distributions in the near future, especially when compared to the study by Ray et al (2012), Kim et al (2021), and Grogan et al (2022).
2.2. Return periods
We calculated the return period R with inundation area fraction I during 1951–2016. The daily I data were obtained from the Global Drought and Flood Catalogue (He et al
2020
https://prep-next.github.io/data/GDFC/index.html)—the I was the simulation output of the global river and inundation model CaMa-Flood (Yamazaki et al
2011), with soil moisture and runoff simulated by the enhanced variable infiltration capacity (Liang and Lettenmaier 1994) land surface model with the enhanced global meteorological forcings (He et al
2020). Next, the daily I was spatially aggregated from the original grid size of 0.25∘ to 0.5∘, to be consistent with the grid size of the crop yield maps presented in the previous section. The harvested crop area A in 2000 (Monfreda et al
2008) was used as the weight in this spatial aggregation:  . Then the maximum value of daily I for the 90 day interval d just before the harvest day H—which was obtained from the global crop calendars (Sacks et al
2010)—was given for a yearly I as
. Then the maximum value of daily I for the 90 day interval d just before the harvest day H—which was obtained from the global crop calendars (Sacks et al
2010)—was given for a yearly I as
Finally, the return period R of I was estimated with the Weibull formula as
where r is the rank on the flood index, which is arranged in descending order, and N is the total number of years. The R was calculated by year i, grid cell j, and crop c associated with yield change Yʹ.
2.3. Flood-induced yield changes
We calculated each grid cell's mean yield changes for flood years and non-flood years. The years with an inundation area's return period of  years were classified as non-flood years, whereas those with a return period of
  years were classified as flood years—this threshold of a return period presented the largest significant flood-affected areas among all return periods. When a significant difference in the mean yield change between flood and non-flood years was detected based on Student's two-tailed t test (p < 0.1), the grid cell's yield change was recorded as the flood-induced yield change and was used for the subsequent analysis. The grid cells that showed significant difference were also recorded in order to estimate the flood-affected crop areas. For comparison, the other flood-induced yield changes were estimated using precipitation instead of inundation area. The precipitation data were obtained from the WFDEI meteorological forcing data (Weedon et al
2014)—water and global change (WATCH) forcing data, which was based on European centre for medium-range weather forecasts re-analysis interim data corrected using Global Precipitation Climatology Centre (GPCC) data.
years were classified as flood years—this threshold of a return period presented the largest significant flood-affected areas among all return periods. When a significant difference in the mean yield change between flood and non-flood years was detected based on Student's two-tailed t test (p < 0.1), the grid cell's yield change was recorded as the flood-induced yield change and was used for the subsequent analysis. The grid cells that showed significant difference were also recorded in order to estimate the flood-affected crop areas. For comparison, the other flood-induced yield changes were estimated using precipitation instead of inundation area. The precipitation data were obtained from the WFDEI meteorological forcing data (Weedon et al
2014)—water and global change (WATCH) forcing data, which was based on European centre for medium-range weather forecasts re-analysis interim data corrected using Global Precipitation Climatology Centre (GPCC) data.
2.4. Flood-induced production changes
The flood impact on crop production loss  in United States (US) dollars ($) was estimated with
where A and P are the harvest area (ha) and producer price ($ t−1), respectively. The subscripts x, y, and z are indices of the flood year based on the return period of  years, flood grid cells chosen in the previous section, and country. The A was from Monfreda et al (2008) and P was the average from 1998 to 2002 obtained from the FAO statistical database (www.fao.org/faostat/en/#data/PP). Actually, it is ideal to apply historical A and P datasets for this calculation because
  was the total loss during the 1982–2016 period. Therefore, these datasets were studied in advance. The other case, the crop production gain
  is calculated with
  instead of
  in equation (4). Lastly, we use the statistically significant Yʹ described in the previous subsection.
2.5. Analyses of the receiver operating characteristic (ROC)
Using the ROC curve, annual counts of national flood grid cells were tested with binarized time series of national flood events during 1982–2016. The binary label of the time series as a flood indicator was assigned according to whether the annual count of national flood events was  or 0 based on the emergency events database (EM-DAT, CRED accessed 7 February 2023). The target score was the annual time series, which consisted of the annual total counts of flood grid cells described in the section 2.3.
3. Results
3.1. Global flood-induced crop losses
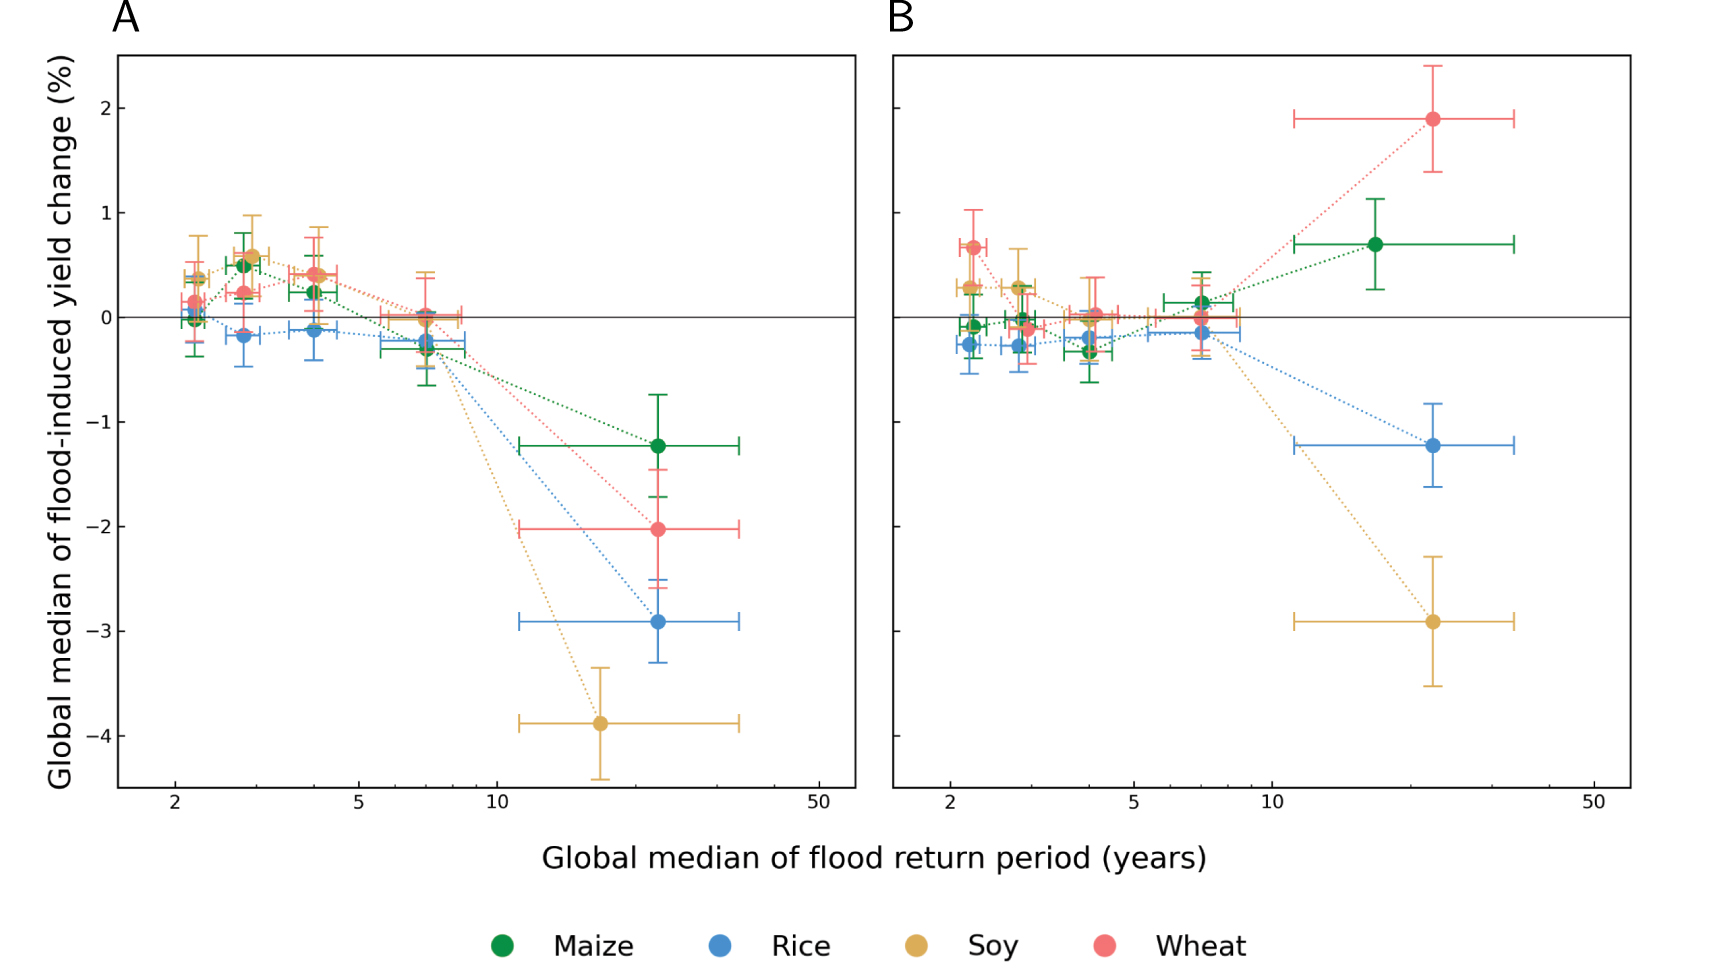
The global medians of the annual grid yield changes were estimated to be significant losses of 4% for soy, 3% for rice, 2% for wheat, and 1% for maize at the return period of over ten years (figure 1(A)), while most of the yield changes for return periods under ten years were not losses. The tendency that a longer return period of inundation area leads to a larger yield loss therefore seems reasonable. The differences in yield loss between the crops imply that the crop vulnerability to floods varies with crops' morphological characteristics and growing field environment. The vulnerability related to the former includes that crops with relatively lower heights such as rice, soy, and wheat were more susceptible to water lodging than taller crops, such as maize, though the inundations were of equal depth. Related to the latter, especially rice has traditionally been cultivated in paddies and is sensitive to floods (Bailey-Serres et al 2012): rice fields located along with river channels or in lowlands were exposed to floods more frequently than upland crop fields. This result is consistent with the result that the effect of drought on rice appeared to be relatively small compared to those on other crops (Kim et al 2019).
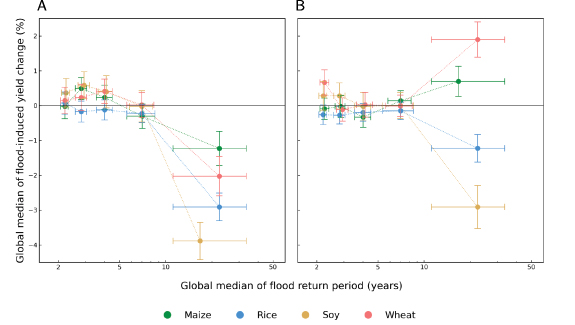
Figure 1. Global median annual grid yield change during the 1982–2016 period in accordance with the increase in the flood return period calculated with inundation area fraction (left) and precipitation (right), which is divided by the 20th percentile. The horizontal and vertical whiskers indicate the 10th to 90th percentile range of data to estimate each return period and the 95% confidence interval estimated by bootstrapping with 10 000 replications, respectively.
Download figure:
Standard image High-resolution imageFlood-induced yield gains were detected for maize and soy at a three year return period (green and yellow in figure 1(A)). This result was interpreted as meaning that inundated areas for this return period were too small to inundate the fields of these crops, whereas more water than normal years resulted in yield gains for them. This tendency was shown at return periods shorter than ten years for maize, soy, and wheat that were cultivated in dry fields. Li et al (2019) indicated that excess rainfall in warm states of the US led to a positive maize yield caused by fulfilling water demand and mitigating heat stress. Chen et al (2019) also pointed out the positive response to floods in China under certain conditions where water shortages were alleviated. The same effects would cause our result in flood-induced yield gains for a return period shorter than ten years.
The global total production loss during 1982–2016 reached $5.5B and its gain was $1.9B: $3.1B and $0.6B for rice, $1.1B and $0.6B for maize, $0.8B and $0.4B for wheat, and $0.4B and $0.2B for soy, respectively. Totals of the top ten countries indicated a 83% loss and a 67% gain for these global totals (figure 2(A)). China was the most flood-stricken country with 56% of the global total production loss, whereas Argentina and Brazil were flood-benefited countries in terms of total crop production. FAO reported $20B of cereal loss due to natural disasters for the least-developed and lower middle-income countries in Africa, Asia, and Latin America during 2008–2018 (FAO 2021). Taking about 19% of this loss as having been caused by floods (FAO 2021), $3.8B was the total flood-induced crop loss calculated for these countries. This value is comparable with our result, $1.2B loss during approximately the same period.
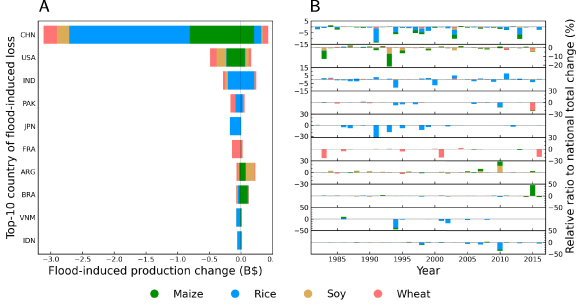
Figure 2. Flood-induced production changes in the top ten countries with flood-induced losses and the annual trends of the ratios to the respective national total change during the 1982–2016 period. Country names are presented based on ISO3166.
Download figure:
Standard image High-resolution imageMost of the annual events by country that were captured in this study as flood events (figure 2(B)) were comparable with those in EM-DAT (The International Disaster Database, https://public.emdat.be/data) and other reports mentioned previously. However, a quantitative relationship was not found between them because the financial damages estimated by the EM-DAT and the reports included the damages of not just the agricultural sector but also other sectors. Noticeably, just a few flood events devastated crops in most of the countries (figure 2(B)).
3.2. Global flood-affected crop areas
The global totals of the flood-affected crop areas—the harvest areas in grid cells of which flood-induced yield changes were statistically significant—were 13, 8, 8, and 4 million hectares (Mha) for rice, maize, wheat, and soy, which were 9%, 6%, 4% and 6% of each global harvest area, respectively (figure 3(A)). Of these global affected areas, two-thirds had yield losses for rice, maize, and soy, and half had losses for wheat (dark red). These yield losses were predominantly in the upper Songhua, the lower Yangtze, and the Hongshui in China, the middle and the lower Mississippi in the US, the lower Parana and the Uruguay in Argentina and Uruguay, and the Indus in Pakistan (figure 3(A)). The crop losses in Northeast Asia were conspicuous. All identified crop loss areas (red in figure 3(A)) in this study were consistent with reported local flood-prone regions in the river basins of China (Li et al 2016, Yang et al 2016, Chen et al 2018, 2019, Wang et al 2022), the US (Kaur et al 2020, Davenport et al 2021, Lazin et al 2021, Shirzaei et al 2021), India (Samantaray et al 2014, Amarasinghe et al 2020), Argentina (Seiler et al 2002, Ferrazzoli et al 2010, Abelen et al 2015), and Pakistan (WFP 2010, Sayama et al 2012). For crop-specific information, the Mississippi in the US for wheat, the southern branches of the Amazon in Brazil for maize and rice, the middle Godavari and Krishna in India for rice and soy, and the Loire and Seine in France for wheat were identified. Here, we should not overlook the crop loss areas that were not statistically significant (light red in figure 3(A)), because those areas could be damaged by floods in the near future when a wetter world arrives caused by the global warming (Allen and Ingram 2013, Donat et al 2016). Those potential areas are concentrated in global food baskets such as eastern China, the central US, and southern Brazil, and make up about 18% to 35% of the global harvest areas for the examined crops (figure 3(A)).
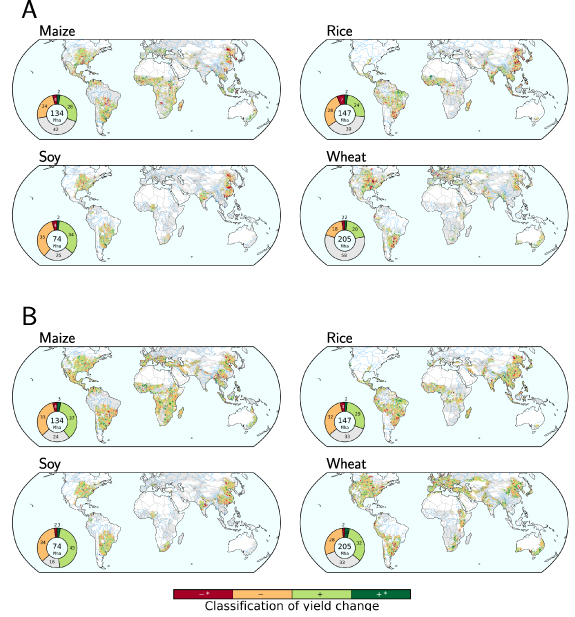
Figure 3. Global patterns of flood-affected crop areas over the ten year return period for 1982–2016 using inundation (A) and precipitation (B). The reddish and greenish colors indicate where yield loss (−) and gain (+) occurred, respectively. An asterisk in the color bar denotes the statistically significance at p < 0.1. The white and the grey represent where no crop was harvested and yield data are not available, respectively. The doughnut chart gives the percentage of each classified area of the total harvested area indicated in the center based on Monfreda et al (2008).
Download figure:
Standard image High-resolution imageYield gains from floods have been reported for local studies (Chen et al 2019, Li et al 2019), and were detected in our results for some crops and regions of the world as well. One reason for the yield gains in flood years could be that inundation or soil saturation levels were not critical to yield loss under a dry conditions—high temperature and low soil moisture make floods beneficial to crops by mitigating their heat stress and fulfilling water demand (Li et al 2019). This yield gain would also be prominent in dry regions where evaporation was high and water was the primary limiting factor of crop cultivation. In our results, the yield gains were detected in the lower Rio Grande in the US for maize and wheat and the upper Niger in Mali for maize and rice (figure 3(A)). Therefore, we infer that flooding might not lead to crop loss under the wetter-than-normal conditions in a dry region because the return period is the relative value of temporal variations in an inundation area. This limitation should be noted for future research. Flood-induced yield gains were also detected in the lower Parana in Argentina for maize and soy, the lower Amazon in Brazil for rice, and the Krishna in India for rice. The reason given earlier for yield gains does not well explain these results, since there were no dry regions in this case. As another reason for yield gains, we suggest that there was a mismatch between cultivated and inundation areas according to localized spatial variation within a grid cell as reported by Chen et al (2019). Unfortunately, we could not determine any relationship of our yield changes with geographical slope and also could not obtain global data to define their relationship with the flow accumulation area and the distance from a nature freshwater resource. Therefore, it is probably necessary to investigate flood-induced yield changes with fine spatial resolution data to precisely define flood-induced crop losses. Fine temporal resolution data are also required because duration of inundation is one of the significant factors used to estimate yield loss (Kaur et al 2020).
3.3. Comparison of flood grid count with flood events of the EM-DAT
It was difficult to directly validate global flood effects on crop yields because of data limitations. Nonetheless, ROC analysis of an annual count of flood grids with a binarized flood event compiled from the EM-DAT has been a meaningful validation of the relationship between a flood area and crop yield (Chen et al
2019, Shirzaei et al
2021, Wang et al
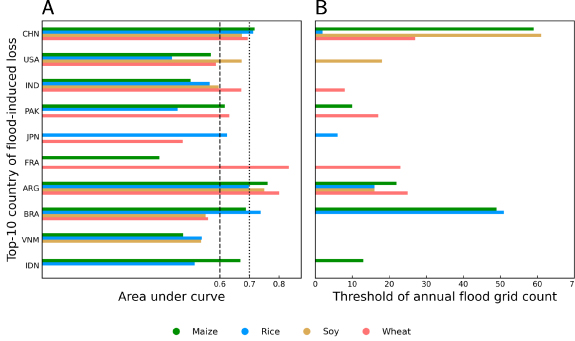
2022). Figure 4(A) shows that the area under the ROC curve (AUC) for all crops in China and Argentina is  , which means excellent estimation (Yang and Berdine 2017). In addition, more than half of crops in all (
 ) had AUC higher than 0.6 which was statistically acceptable. Thus, the annual flood grid count was able to describe whether floods occurred in areas with national crops. The crops in some countries with an AUC
  were detected, and these were inappropriate for estimating flood effects on crop yields, which was a limitation of this study. Nonetheless, our estimation is helpful for understanding global or national flood effects on crop production because the major countries and crops affected by floods were analyzed.
Figure 4. Area under the curve (A) and the threshold of the annual flood grid count (B) estimated by a receiver operating characteristic analysis with the top ten countries with respect to flood-induced losses. The dashed and dotted lines denote the minimum values of acceptable and the excellent, respectively. Thresholds were estimated with the items of which values of the area under the curve are acceptable estimations ( ).
).
Download figure:
Standard image High-resolution image
The ROC threshold of the annual flood grid count, which describes the presence and absence of floods in terms of a spatial domain, was differed by country and crops (figure 4(B)). A higher threshold implied a more immense flood event, namely, a rarer event than a lower threshold. In the case of China, the flood-induced yield changes of soy were relatively rarer events because floods occupied larger area were rare. Otherwise, those of rice occurred more frequently, and then the losses were greater than soy (figure 2(A)). This result imply that the reason of yield losses did not cause magnitude of flood event but frequency of that.
4. Discussion
The global total crop production loss due to floods accounted for $5.5B in this study. This loss was merely 3% of the loss due to droughts, $166B (Kim et al 2019). It was also much smaller than the $731B (CRED 2020) which was the flood-induced total damage of agriculture and all other sectors during the same 1982–2016 period. Therefore, crop harvest areas mainly distributed in floodplains are able to be water restoration areas when floods occur, and thereby contribute to mitigation of the total flood damage by allowing the redirection of floods from the most to the least vulnerable areas (Förster et al 2008, Erdlenbruch et al 2009) in terms of economic aspects. This concept is increasingly important when flood damages are expected to concentrate in an urban area located in a lower part of a river basin with a higher population density. Therefore, the estimation of the crop production loss due to floods is expected to be helpful for decision-making in order to minimize total flood damage in a river basin. Thus, this study can be a starting point for estimating global flood-induced crop losses, which is helpful for global flood risk assessments based on local studies considering risk sharing and compensation (Brémond et al 2013, Mao et al 2016). Additionally, these findings will also help in the development of international and national policies and measures to reduce the exposure and the vulnerability of global agriculture under pressures to meet increasing food demands and threats to reveal increasing flood damages in climate change.
A flood indicator based on inundation area is more reliable for evaluating flood-induced crop losses than precipitation, because inundation is first-hand information that indicates water balance in and on the rhizosphere, whereas precipitation is just input and into water balance. Therefore, an actual flooding area can be different from a rainfall area. In a comparative analysis using precipitation instead of inundation, the global medians of flood-induced yield losses were underestimated for rice and soy; moreover, gains in yield changes were detected for wheat and maize (figure 1(B)). The geographic pattern of yield losses in the Asia Monsoon region was nearly the same as that based on inundation, while many other regions showed inconsistent distributions (figure 3(B)). Detected numbers of grid cells indicating flood-induced yield loss using precipitation were smaller than those using inundation. Moreover, many grid cells of flood-induced yield gain were detected for the analysis using precipitation worldwide, especially wheat. Therefore, we are able to suggest that the flood index using inundation is more reliable for estimating flood effects on crop production than precipitation because the inundation was the output of a realistic simulation considering water flows in soil and through rivers with a state-of-the-art global land surface model and a river routing model, respectively.
While we have used inundation area as a flood index, further studies are required to overcome the yield gain issue with wetter-than-normal conditions in dry regions and the spatial inconsistency between flooded and cultivated areas. For the former, optimization of evapotranspiration parameters in the land surface model, and for the latter, construction of damage functions between yield changes and geographical parameters are required with fine spatial resolution data in order to evaluate the global flood-induced crop loss. Fine temporal analyses are also helpful for the physiological crop impacts in accordance with inundation duration. Finally, an uncertainty analysis for return periods with an analytical distribution function is also required to guarantee the creditability and precision of our study results
5. Conclusions
- (1)A flood indicator based on inundation area derived from a global river and inundation model is more reliable for estimating flood-induced crop loss than a flood indicator based on precipitation because inundation is first-hand information that indicates water balance in and on the rhizosphere, whereas precipitation is just an input into water balance. Namely, the actual flooding area could be different from the area rained on.
- (2)Local studies have identified eastern China and the central US as the most flood-prone area where significant crop losses occur due to floods. Moreover, the production losses associated with floods are concentrated in those two countries. The findings of this study, along with those from other countries, can be instrumental in minimizing total damage by implementing the concept of risk sharing in national or international river basins.
- (3)Further studies are required to overcome the yield gain issue with wetter-than-normal conditions in dry regions and the spatial inconsistency between flooded and cultivated areas. For the former, optimization of evapotranspiration parameters in the land surface model, and for the latter, construction of damage functions between yield changes and geographical parameters are required with fine spatial resolution data to estimate the global flood-induced crop loss. Fine temporal analyses are also needed that consider physiological crop impacts due to inundation duration.
- (4)The results of our study will serve as a starting point for estimating global flood-induced crop losses and contribute to global agricultural flood risk assessments based on risk sharing and compensation. These findings will be beneficial for international or national decision-making to develop policies and measures to cope with global agriculture under pressures to meet increasing food demand in disaster-prone countries.
Acknowledgments
We thank two anonymous reviewers for their comments, which helped to improve the manuscript. This research was partially supported by the Environment Research and Technology Development Fund (JPMEERF20202002) of the Environmental Restoration and Conservation Agency provided by the Ministry of Environment of Japan.
Data availability statement
All data that support the findings of this study are included within the article (and any supplementary files).