


Abstract
Winter cold extreme events have been observed to frequently take place over North America mainly over its east side, which show significant interannual and decadal variability and cause huge economic losses in the United States. However, it is unclear what leads to the interannual-decadal variability of winter cold extremes over the eastern North America. In this study, we indicate that the decadal variability of winter cold extremes over the eastern North America, whose period is shortened in the recent decades, is mainly tied to Pacific decadal oscillation (PDO), whereas their interannual variability is mainly regulated by Victoria mode (VM). A positive PDO promotes cold extremes in the lower latitudes of the eastern North America mainly owing to the presence of positive Pacific North American (PNA+) patterns, whereas a positive VM is favorable for intense cold extremes in the higher latitudes of the eastern North America mainly due to the occurrence of negative North Pacific oscillation (NPO−) patterns. Thus, the positive VM and PDO combine to significantly contribute to the interannual-to-decadal variability of winter cold extremes over the eastern North America through changes in the winter NPO− and PNA+ patterns due to the variations of meridional background potential vorticity gradient and basic zonal winds. These new findings can help us understand what are the origins of the interannual-decadal variability of winter cold extremes over the eastern North America.
Export citation and abstract BibTeX RIS

Original content from this work may be used under the terms of the Creative Commons Attribution 4.0 license. Any further distribution of this work must maintain attribution to the author(s) and the title of the work, journal citation and DOI.
1. Introduction
In recent decades, the winter in the North America especially over its east has experienced frequent extreme cold events as observed during 2013–2014 and 2014–2015 (Wang et al 2014, 2015). The study on the occurrence of winter cold events over the North America and their variability has been an important topic (Wang et al 2014, 2015, Yu and Zhang 2015, Baxter and Nigam 2015, Hartmann 2015, Lee et al 2015, Harnik et al 2016, Zaba and Rudnick 2016, Swain et al 2016, Vigaud et al 2018, Luo et al 2020a, Ge and Luo 2022, Yao et al 2023). It has been revealed that the Pacific North American (PNA) and North Pacific Oscillation–West Pacific pattern (NPO/WP) patterns are often two independent spatial modes (Wallace and Gutzler 1981, Blackmon et al 1984), which are characterized by a quadrupole structure from Pacific to North America (Walker and Bliss 1932, Rogers 1981) and a meridional dipole over North Pacific (Linkin and Nigam 2008, Baxter and Nigam 2015), respectively. The two modes are of 10–20 d timescales (Feldstein 2002, Franzke et al 2011). Because the North America is located in the downstream of Pacific basin, the North American cold events are inevitably related to NPO/WP (Baxter and Nigam 2015, Lee et al 2015, Yu and Zhang 2015) and PNA patterns (Ge and Luo 2022) as the PNA pattern exhibits a circumglobal teleconnection wave train (Dickson and Namias 1976, Leathers and Palecki 1991, 1992, Lin 2015, Harnik et al 2016). The severe cold winters over North America have been found to be linked to the NPO/WP (Baxter and Nigam 2015, Yu and Zhang 2015) and PNA (Walsh et al 2001, Cellitti et al 2006, Grotjahn et al 2016) patterns, even though the North American cold events are also related to the North Atlantic Oscillation and North Pacific blocking (Westby et al 2013, Iles and Hegerl 2017, Luo et al 2020a). While some studies have noted the role of Arctic sea ice decline in the winter North American temperature variability (Kug et al 2015, Iida et al 2020, Zhang et al 2020, Zhuo and Jiang 2020, He et al 2021, Zhao et al 2022), the retrogression of Greenland blocking modulated by the decline of winter Arctic sea ice over the Baffin Bay, Davis Strait, and Labrador Sea was shown to cause winter cold events in the east part of North America (Chen and Luo 2017, Cohen et al 2018). Recently, Zhang et al (2022) found that Pacific decadal oscillation (PDO) and PNA can regulate the western North American extremes. However, it is not clear what leads to the interannual-decadal variability of winter cold events over the eastern North America.
The PDO and Victoria mode (VM) are the two main modes of extratropical Pacific sea surface temperature (SST) anomalies (Bond et al 2003, Mantua et al 1997, Zhang et al 1997, Ding et al 2015), which reflect Pacific decadal and interannual variability, respectively. Thus, it is inferred that the interannual and decadal variations in the North American cold events are likely linked to the phases of PDO and VM via their modulation on atmospheric circulation patterns in the Pacific-North American sector due to changes in the background condition (Luo et al 2020a, 2020b, Ge and Luo 2022). In this paper, by defining the winter cold extremes over the eastern North America we indicate that the decadal variation in winter cold extremes over the eastern North America is mainly regulated by the PDO via changing the positive PNA pattern, whereas the interannual variability of the winter cold extremes mainly results from the modulation of VM on the negative NPO pattern.
2. Data and method
The reanalysis datasets we used here are taken from the National Centers for Environmental Prediction–National Center for Atmospheric Research (NCEP–NCAR) from December 1950–February 1951 to December 2019–February 2020 (1950–2019 hereafter) (Kalnay et al 1996). These datasets include the daily-mean surface air temperature (SAT), geopotential height at 500 hPa (Z500) and zonal wind at 500 hPa (U500) with a horizontal resolution of 2.5° × 2.5°. The used monthly-mean SST with a resolution of 1° × 1° is available from the Hadley Centre (HadISST1) for the time period 1950–2019. The anomalies for the variables in each grid are obtained by removing the seasonal cycle and linear trend. In this paper, our emphasis is placed on investigating the physical cause of the interannual-decadal variability of winter cold events over the eastern North America during 1950–2019 rather than the multidecadal variability of North American cold events. Thus, the data size of 70 yr we used here is sufficient for the investigation of the interannual-decadal variability of winter cold events.
The first and second empirical orthogonal function (EOF) (EOF1 and EOF2) modes of the December–January–February (DJF)-mean SST anomalies over the North Pacific (120° E–120° W, 20–60° N) are used to reflect the PDO and VM (Ding et al 2015), respectively. Correspondingly, the normalized time series of their principal components (PC1 and PC2) are defined as the winter PDO and VM indices.
The monthly and daily PNA teleconnection pattern indices are available from the National Oceanographic and Atmospheric Administration Climate Prediction Center (https://ftp.cpc.ncep.noaa.gov/cwlinks/). The monthly and daily North Pacific Oscillation (NPO) indices are defined as the difference of the domain-averaged Z500 anomaly between the two regions: (25°–40° N, 140° E–150° W) and (25°–40° N, 140° E–150° W). Then, we used the daily PNA (NPO) index to define an individual PNA+ (NPO−) event if the daily PNA (NPO) index is above 1.0 (below −1.0) standard deviations (STDs) and persists at least three consecutive days. Here, we did not consider non-monotonic PNA events when there are two peaks for an event during its life cycle and the time interval between its two peaks is <10 d. Such a requirement is also utilized to pick individual NPO events. We define the variation with the timescale of 10–20 d as the sub-seasonal variability and the peak day of the PNA or NPO event as lag 0. Here, the time average of the composite daily cold SAT anomalies from lag −10 to 10 d is made to reflect the occurrence of sub-seasonal North American cold anomalies related to PNA or NPO events.
In a nonlinear multi-scale interaction (NMI) model of PNA or atmospheric blocking (Luo et al 2019, 2020b, Luo and Zhang 2020), the meridional gradient (PVy) of the background potential vorticity is a key factor influencing the PNA+ and NPO− if the NPO− or the anticyclonic anomaly of the PNA+ is considered as an atmospheric blocking. For example, when PVy is larger (smaller) in the lower (higher) latitudes of North Pacific, the large-scale teleconnection patterns such as NPO and PNA are less (more) persistent due to stronger (weaker) energy dispersion and weaker (stronger) nonlinearity (Luo et al 2023). Because the NPO− is located in the higher latitudes than the PNA+, the NPO− (PNA+) is inevitably long-lived (short-lived) and has large (short) zonal width because of weaker (stronger) energy dispersion and stronger (weaker) nonlinearity. In this paper we may use the NMI model to account for the changes in the PNA+ and NPO−.
The non-dimensional baroclinic meridional potential vorticity gradient (PVy), scaled by the characteristic horizontal velocity  (∼10 ms−1) and length
  (∼106m), is defined as

where  ,
,  ,
,  and
and  is taken as in Luo and Zhang (2020) for a fixed atmospheric stratification.
  represents the non-dimensional meridional gradient of the Coriolis parameter at a given latitude
  = 45° N.
The non-dimensional nonlinear phase speed  of the NPO or PNA can be obtained as (Luo et al
2019, 2020b)
of the NPO or PNA can be obtained as (Luo et al
2019, 2020b)
where  is the non-dimensional basic zonal wind,
  and
and  are the non-dimensional zonal and meridional wavenumbers of the NPO or PNA respectively and F=0.82 is chosen as in Luo and Zhang (2020).
  is the non-dimensional amplitude of the NPO or PNA and the other coefficients with
  can be found in Luo and Zhang (2020). It is further noted that the NPO can undergo a stronger retrogression if
  or
or  is smaller or if the amplitude of the NPO is larger. In contrast, its westward movement is suppressed if
  ,
,  and
and  show opposite changes. The northern node of NPO can have longer lifetime, stronger westward movement and larger zonal scale (or width) as
  is smaller in high latitudes (Zhang and Luo 2020). Such features can also be applied to the case of PNA.
The coefficient of the pattern correlation we used here can reflect a similarity between two patterns, but it cannot feature the amplitude variability. The pattern correlation coefficient is the uncentered Pearson product-moment coefficient of linear correlation between two variables that are respectively the values of the same variables at corresponding locations on two different maps (Wigley and Santer 1990, Wilks 2011). The pattern correlation coefficient can be written as
where the  (
( ) with a standard deviation of
  (
( ) is the mean value of
  .
.
In this study, the wavelet transform can be utilized to obtain the dominant variability mode of the time series that contains nonstationary power at many different frequencies (Torrence and Compo 1998). The wavelet analysis used in this paper is the Morlet wavelet consisting of a pane wave modulated by a Gaussian-type distribution (Farge 1992, Torrence and Compo 1998), which can efficiently identify the main period of the North American cold days. Here, we use the local and global wavelet power spectra to detect the dominant modes of the variability. The local wavelet power spectrum decomposes the time series into time-frequency space, which can identify both the dominant modes of variability and how those modes vary with time (Torrence and Compo 1998). The global wavelet power spectrum is the time-averaged wavelet spectrum over a certain period and reflects the time-mean power of the dominant modes. The details of the Morlet wavelet method can be found in Torrence and Compo (1998).
3. Result
3.1. Linkage of winter cold extremes over the eastern North America to PDO and Victoria mode
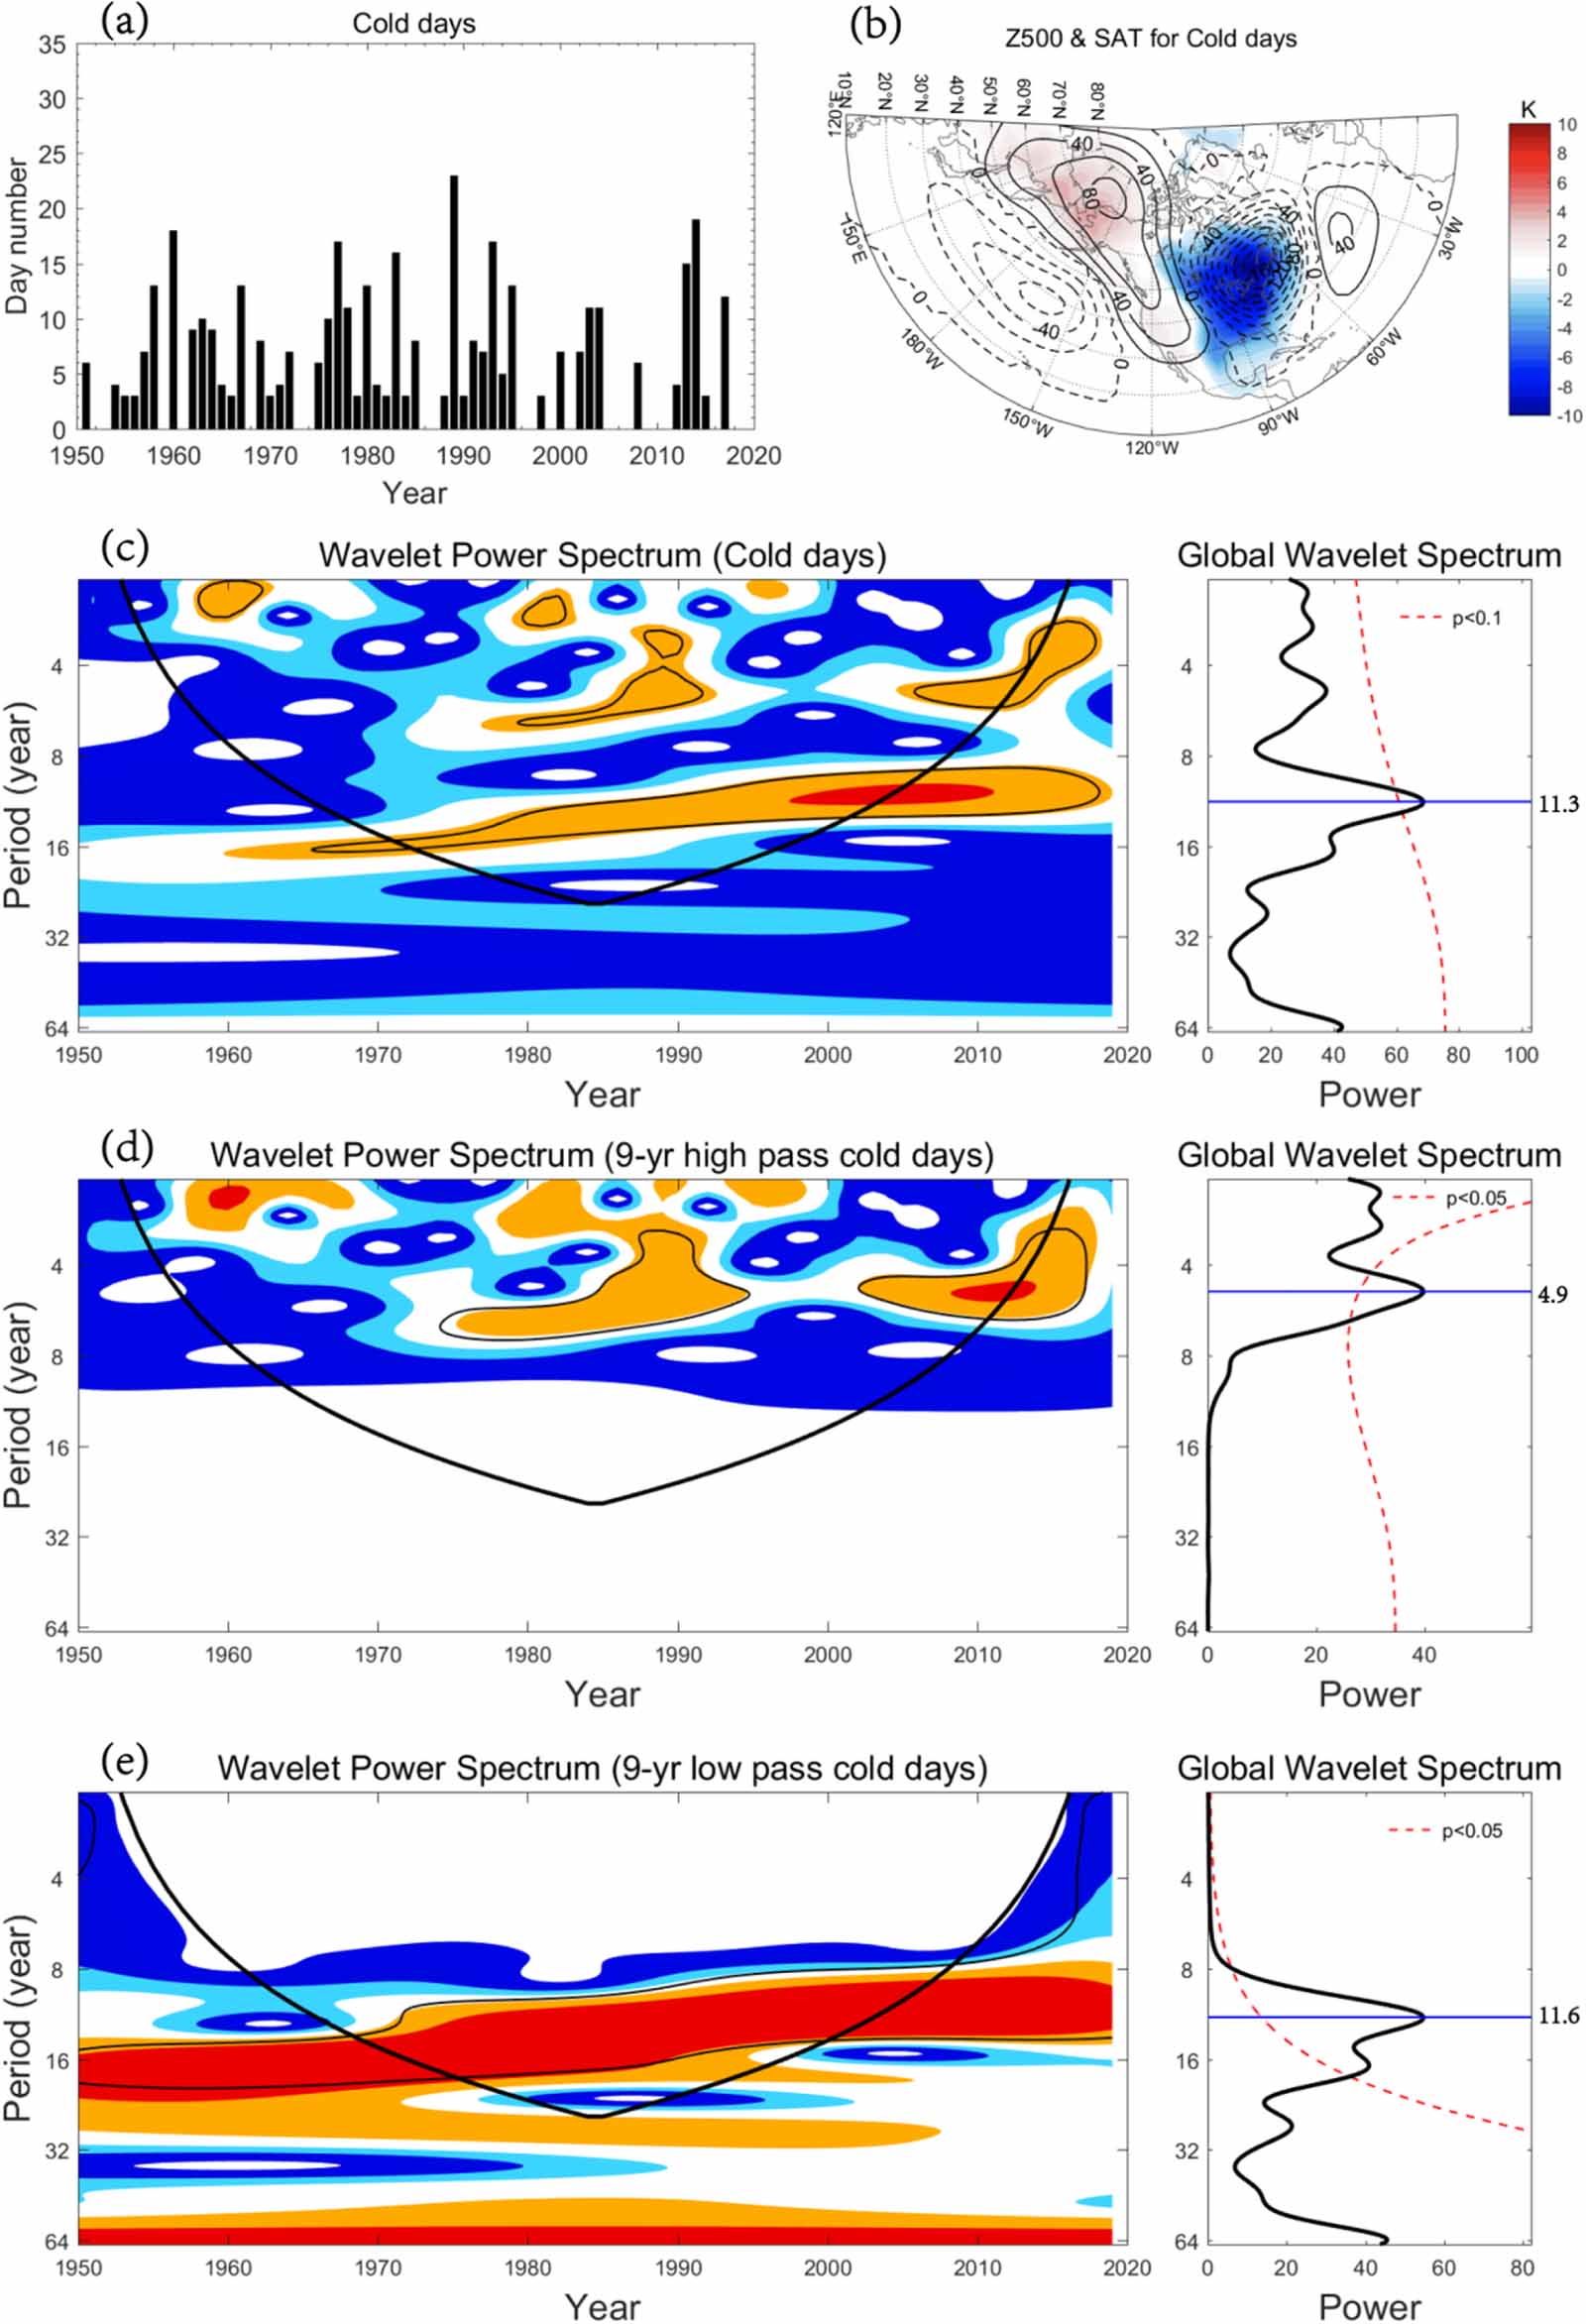
To establish a connection of winter cold extremes over the eastern North America to PDO and VM, a cold extreme event can be defined to have happened over the eastern North America if the daily minimum SAT anomalies over the region (90°–60° W, 25°–55° N) exceeds its 90th percentile and persists at least three consecutive days similar to the definitions of Diao et al (2015) and Li et al (2020a). One advantage of the area average definition of the cold extreme event is that it can reduce or remove the effects of mesoscale or smaller weather systems. The winter cold extreme over the eastern North America is also briefly referred to as the North American cold extreme, hereafter. Based on this definition, it is found that there are 91 North American cold extreme events during 1950–2019. The total number of days of the cold extreme events in a winter is defined as the winter cold days, whose time series (figure 1(a)) shows interannual and decadal variations. The time-mean composite daily Z500 and SAT anomalies for the all days (395 d) of winter cold days (figure 1(b)) clearly show that the Z500 anomaly field associated with the North American cold extreme has a strong cyclonic anomaly appearing in the midlatitudes of the North America and its eastern part. At the same time, an anticyclonic-over-cyclonic dipole appears over the North Pacific and its anticyclonic anomaly extends toward the lower latitudes along the west coast of the North America.

Figure 1. (a) Time series of winter North American cold days during 1950–2019. (b) Time-mean composite Z500 and SAT anomalies for all cold days during the 1950–2019 winters, where color shading represents SAT anomaly being the 95% confidence level based on a two-sided Student's t-test. (c), (d), (e) local (left) and global (right) wavelet power spectra of (c) North American cold days and their 9 yr (d) high pass and (e) low-pass time series during 1950–2019. The 90% or 95% significance level against the red noise is indicated by thin black contour line (left side) and dashed red line (right side) in panels (c), (d), (e). In the left-hand side of panels (c)–(e), the thick black curve delimits the cone of influence, a region influenced by edge effects and in their right-hand side the black line represents the global wavelet power curve.
Download figure:
Standard image High-resolution imageIn this paper, we use a 9 yr high pass (low pass) filter to extract the interannual (decadal) variability. The local and global wavelet power spectra of the North American cold days are shown in figures 1(c)–(e) for the raw (no filtering) time series and its 9 yr high pass and low pass components. It is interesting to see that the North American cold days mainly located in the eastern part of North America during 1950–2019 have a decadal peak of about 11 yr that is significant at the 90% confidence level (right-hand side of figure 1(c)), but can reach the 94% confidence level during 1990–2019 (left-hand side of figure 1(c) for a local wavelet spectrum). The wavelet spectra of the 9 yr high pass and low pass filtered time series of the North American cold days further show that the interannual variability of the cold days is dominated by about 5 yr (figure 1(d)), whereas their decadal variability has a peak of about 12 yr (figure 1(e)). Similar results are also detected for the ERA5 (figure S1) and ERA 20 C (figure S2) data. We further find that the decadal period of the North American cold days is shortened from 1950–1989 to 1990–2019 (left-hand side of figure 1(e)), showing a similar feature of the PDO variability in a warming climate (Li et al 2020b). On the other hand, it is noted that there is a significant correlation of 0.34 or 0.38 (p < 0.05) between the North American cold days and the PDO or VM index as shown in figures 2(a) and (b), even though the extreme cold events have a positive correlation of 0.28 or 0.32 (p < 0.05) with the PDO or VM index during 1950–2019. Thus, it is inferred that the variability of the cold extremes over the eastern North America is tied to the phases of the PDO and VM.
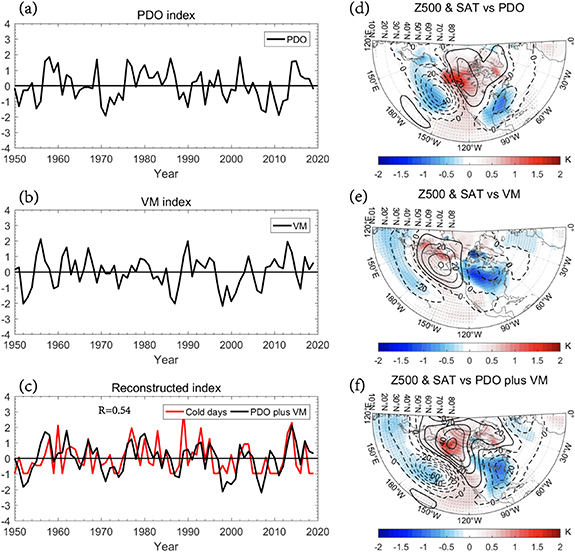
Figure 2. Normalized time series of DJF-mean (a) PDO and (b) VM indices as well as (c) North American cold days (red line) and the reconstructed cold days index (black line) from the combination of PDO and VM (PDO plus VM) using a binary linear regression model during 1950–2019. (d), (e), (f) Regressed fields of DJF-mean Z500 (contours, contour interval = 10 gpm) and SAT (color shading) anomalies against the normalized time series of DJF-mean (d) PDO and (e) VM indices as well as (f) reconstructed cold days index during 1950–2019. The dots represent the region being significant at the 95% confidence level based on a two-sided Student's t-test. In panel (c), R = 0.52 denotes the correlation coefficient (p < 0.05) between two curves.
Download figure:
Standard image High-resolution imageTo understand the role of VM and PDO in the winter cold extremes over the eastern North America, we first examine whether the winter atmospheric circulation pattern associated with the North American cold extremes consist of those associated with PDO and VM. The regressed DJF-mean Z500 and SAT anomalies against the normalized PDO (figure 2(a)) and VM (figure 2(b)) indices as well as the reconstructed time series of PDO and VM indices (figure 2(c)) are shown in figures 2(d)–(f). It is clearly seen that a cold anomaly associated with a positive PDO phase (PDO+) appears over the southeastern side (or the lower latitudes) of the eastern North America (figure 2(d)). Its corresponding DJF-mean Z500 anomaly looks like a positive PNA pattern (figure 2(d)). For the positive VM phase (VM+) a higher latitude cold anomaly takes place over the eastern North America, whose DJF-mean Z500 anomaly is characterized by an anticyclonic anomaly over the Bering Strait and a cyclonic anomaly over the higher latitudes of North America (figure 2(e)), resembling a negative NPO pattern. We also find that the DJF-mean Z500 anomaly pattern (figure 2(f)) regressed onto the reconstructed time series of the North American cold days has a pattern correlation coefficient of 0.76 (p < 0.05) with that of North American cold days in the North American region (130°–60° W, 20°–70° N) (figure 1(a)). This reflects the combined role of PDO and VM in the variability of the cold extremes over the eastern North America, even though the DJF-mean Z500 anomaly regressed onto the winter PDO or VM index has a pattern correlation coefficient of 0.53 (p < 0.05) or 0.55 (p < 0.05) with the winter Z500 anomaly associated with North American cold extremes in the region (130°–60° W, 20°–70° N) (figure 1(b)). Thus, PDO and VM can significantly modulate the variability of winter cold extremes over the eastern North America.
The wavelet power spectra of the PDO and VM indices show that the significant variability of PDO is mainly concentrated on decadal timescales with a peak of about 19 yr (90% confidence level) (global wavelet spectrum in figure 3(a)), whereas the large variability of VM is concentrated on interannual timescales with a peak of 5.7 yr (global wavelet spectrum in figure 3(d)). Although the PDO and VM indices have no significant correlation of −0.14 (p > 0.1), the PDO (VM) index also possesses an interannual (decadal) component. To highlight the different roles of the PDO and VM variations in the North American cold extremes, it is useful to show the local and global wavelet power spectra of the 9 yr low pass (high pass) PDO and VM indices in figures 3(b), (c), (e) and (f). It is seen that the 9 yr high pass PDO (VM) index exhibit a prominent interannual variability with a peak of 5.1 (5.5) yr being significant at the 95% confidence level (figures 3(b) and (e)). However, the interannual variability of the PDO (figure 3(b)) has smaller wavelet power than its decadal component, though its decadal period is shortened in the recent decades (the left-hand side of figure 3(c)). Moreover, the decadal variability of VM has almost same wavelet power amplitude as its interannual variability. Correlation calculation (table 1) further indicates that the interannual variability of the North American cold days shows a modest significant positive correlation of 0.28 (p < 0.05) with the 9 yr high pass VM index, but no significant correlation with the 9 yr high pass PDO index. Although the decadal part of North American cold days also has a positive correlation of 0.53 (p < 0.05) with the 9 yr low pass VM index, it can have a larger positive correlation of 0.62 (p < 0.05) with the 9 yr low pass PDO index. Thus, the decadal variability of North American cold days primarily results from the modulation of PDO. This suggests that the interannual (decadal) component of North American cold days is mainly related to the interannual (decadal) variability of the VM (PDO).

Figure 3. (a)–(f) Local (left) and global (right) wavelet power spectra of (a) PDO (figure 2(a)) and (d) VM index (figure 2(b)) during 1950–2019 and (b)–(f) their 9 years (or 9 yr) (b), (e) high pass and (c), (f) low pass indices. The black thick contour in left hand panel indicates the 90% (95%) significance level against red noise in panels (a), (d) ((b), (c), (e), (f)). The thin black line (left side) has the same meaning as in figure 1. For global wavelet power spectrum, the 90% or 95% confidence level against red noise for the global wavelet spectrum is indicated by the red dashed line in the right-hand panel where the black line represents the global wavelet power curve.
Download figure:
Standard image High-resolution imageTable 1. Correlation coefficients of North American cold days and its 9 year (9 yr) low pass and high pass parts with the raw PDO and VM indices and their 9 yr low pass and high pass components. The 90% (95%) confidence level is marked by one asterisk (two asterisks).
| Cold days | PDO | VM | 9 yr low (high) pass PDO | 9 yr low (high) pass VM |
|---|---|---|---|---|
| Raw | 0.34** | 0.37** | 0.33** (0.18) | 0.29** (0.27) |
| 9 yr high pass | 0.16 | 0.23* | 0.02 (0.19) | 0.03 (0.28**) |
| 9 yr low pass | 0.40** | 0.34** | 0.62** (0.04) | 0.53** (0.06) |
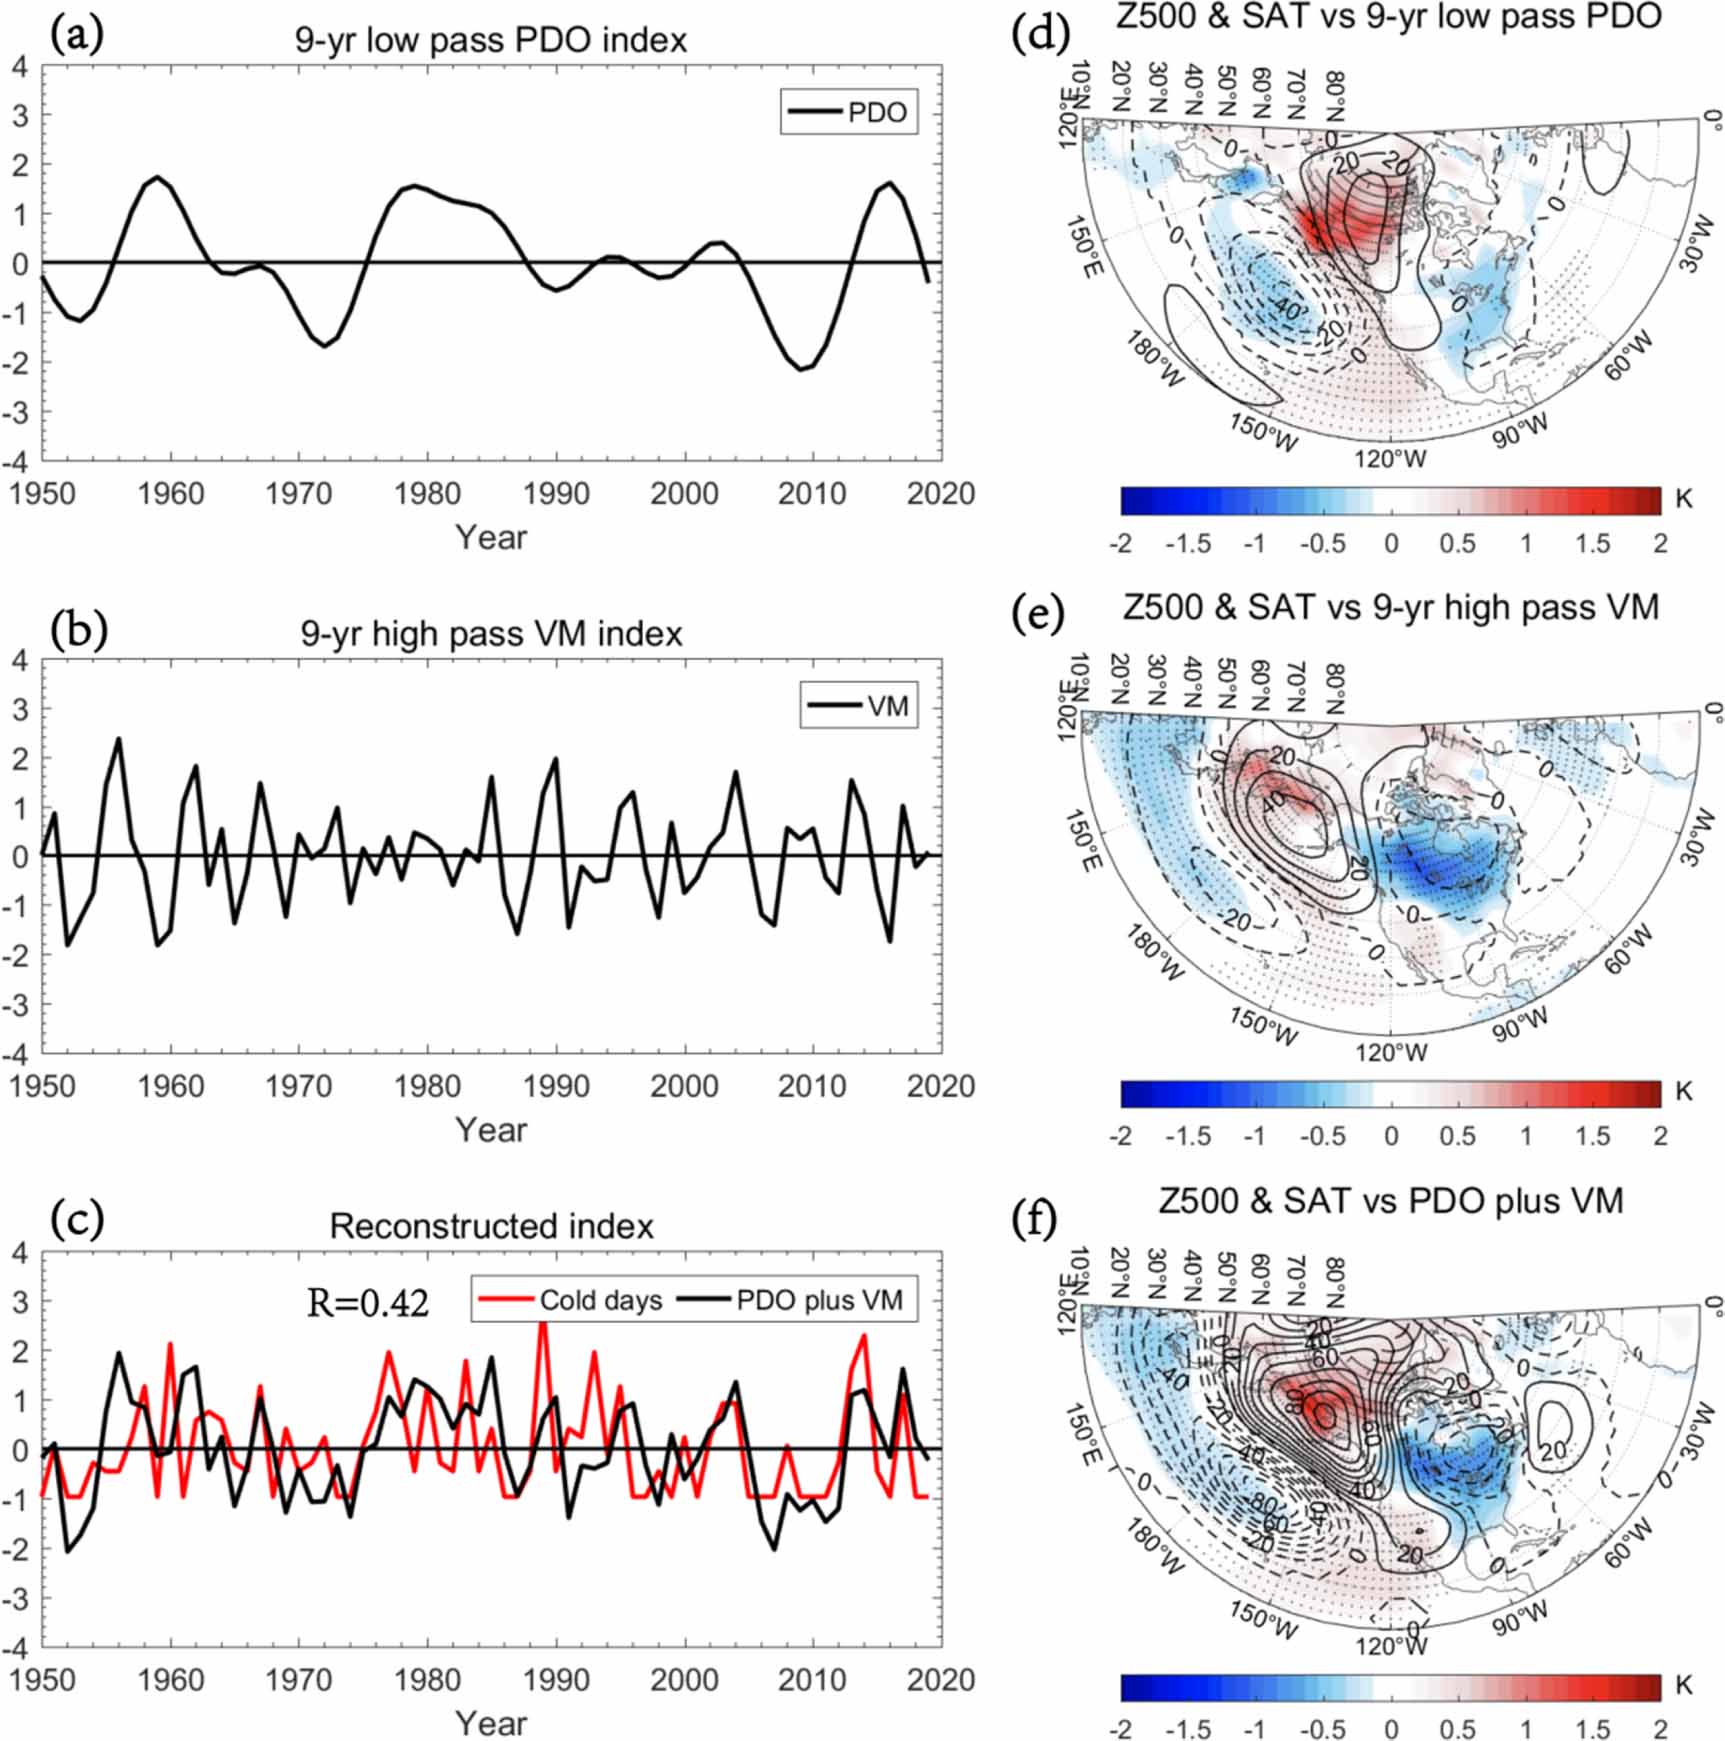
We show the DJF-mean Z500 and SAT anomalies regressed onto the 9 yr low pass PDO index (figure 4(a)) and 9 yr high pass VM index (figure 4(b)) in figures 4(d) and (e). The reconstructed time series of North American cold days from both the 9 yr low pass PDO index and 9 yr high pass VM index and its corresponding regressed DJF-mean Z500 and SAT anomalies are also shown in figures 4(c) and (f), respectively. We can see that the reconstructed time series (PDO plus VM) has a significant positive correlation of 0.42 (p < 0.05) with the North American cold days (red line in figure 4(c)), which is slightly smaller than the result based on the raw PDO and VM indices (figure 2(c)). Thus, the variability of the cold extremes over the eastern North America is due to the combined modulation of the PDO and VM. We further see that the positive phase of the VM (PDO) on interannual (decadal) timescales corresponds to a cold anomaly in the higher (lower) latitudes of the eastern North America (figures 4(d) and (e)). This result is also detected in figures 2(d) and (e) for raw PDO and VM indices. Moreover, the effect of the interannual (decadal) variability of PDO (VM) on the North American cold extremes has a similar result (figure S3). Our calculations further show that the DJF-mean Z500 anomaly regressed onto the 9 yr low pass PDO or high pass VM index has a pattern correlation coefficient of 0.8 or 0.48 (p< 0.05) with the circulation anomaly of the North American cold extreme in the North American region (130°–60° W, 20°–70° N), as the corresponding Z500 anomaly pattern of the reconstructed time series possesses a pattern correlation coefficient of 0.80 (p < 0.01) with that of the North American cold extreme. Thus, in the subsequent discussions, we mainly use the 9 yr low pass (high pass) PDO (VM) index to emphasize the role of the decadal (interannual) variability of PDO (VM) in the variability of the cold extremes over the eastern North America through modulating PNA and NPO patterns.
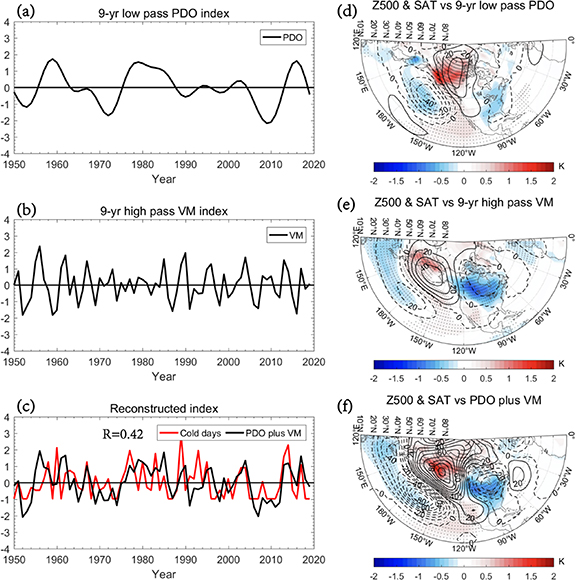
Figure 4. As figure 2 but for 9 yr low pass PDO index and 9 yr high pass VM index. In panel (c), R = 0.42 denotes the correlation coefficient (p < 0.05) between the reconstructed (PDO plus VM) time series, obtained from both the 9 yr low pass PDO and 9 yr high pass VM indices, and the North American cold days.
Download figure:
Standard image High-resolution imageTo examine why the positive PNA and negative NPO patterns play an important role in the winter North American cold extremes, we show the time series of the DJF-mean PNA and NPO indices, and their corresponding regressed Z500 and SAT anomaly fields in figures 5(a)–(d). In the regression, the multiplication of the NPO index by −1 is to obtain the cold anomaly related to the NPO−. Our calculations show that the DJF-mean PNA index (figure 5(a)) has a correlation coefficient of 0.64 (p < 0.01) with the DJF-mean PDO index (figure 2(a)), but −0.37 (p < 0.05) with the VM index (figure 2(b)). This implies that the variation of the winter PNA pattern is mainly related to PDO. By contrast, the DJF-mean NPO index (figure 5(b)) has a significant correlation of −0.71 (p < 0.01) with the DJF-mean VM index, but no significant correlation of −0.02 (p > 0.1) with the PDO index. This means that the variation of the winter NPO pattern is mainly related to VM. A relatively weak cold anomaly occurred in the lower latitudes of the eastern North America for a positive winter PNA (PNA+) pattern (figure 5(c)), whereas a relatively strong cold anomaly appeared in the higher latitudes of the eastern North America for a negative winter NPO (NPO−) pattern (figure 5(d)). Thus, the latitude position of North American cold extremes depends on whether a PNA+ or NPO− pattern occurs. It is also found that the pattern correlation coefficients of the winter PNA+ (figure 5(c)) and NPO− (figure 5(d)) patterns with the winter circulation pattern of North American cold extremes (figure 1(c)) are 0.53 (p < 0.01) and −0.82 (p < 0.01), respectively. This suggests that the cold extremes over the eastern North America are more strongly related to the NPO− pattern than the PNA+ pattern. As seen from the time series of daily PNA and NPO indices associated with the North American extreme cold days during 1950–2019 (figures 5(e)–(f)), the daily cold extremes are mainly associated with the daily positive PNA index (figure 5(e)) and daily negative NPO index (figure 5(f)). Thus, the PNA+ and NPO− events can significantly contribute to the winter extreme cold events over the eastern North America. Below, we further explore how PDO and VM modulate the cold anomalies of individual PNA+ and NPO− events.

Figure 5. (a), (b) Normalized time series of DJF-mean (a) PNA and (b) NPO indices during 1950–2019. (c), (d) Regressed fields of DJF-mean Z500 and SAT anomalies against the DJF-mean (c) PNA index and (d) NPO index multiplied by −1 during 1950–2019. (e) Daily PNA and (f) NPO indices of the North American cold days during 1950–2019. In panels (c) and (d), the dots represent the region being significant at the 95% confidence level based on a two-sided Student's t-test.
Download figure:
Standard image High-resolution image3.2. Modulation of the Victoria mode and PDO on sub-seasonal North American cold extremes associated with PNA+ and NPO− events
Composite shows that cold anomalies cannot occur over the eastern North America to the south of 50° N for negative PNA (PNA−) and positive NPO (NPO+) events (figure 6). Also, the PNA− and NPO+ combination events cannot produce the cold anomaly in the south of 50° N over the eastern North America, even though they are fewer (18 cases) during 1950–2019. However, this can happen for PNA+ and NPO− events. We show the time-mean fields of composite daily Z500 and SAT anomalies averaged from lag −10 to 10 d for PNA+ and NPO− events, and the time–longitude evolution (i.e. Hovmöller diagram) of the composite daily Z500 anomalies averaged over the latitudes (40°–60° N) for the PNA+ and over the latitudes (50°–70° N) for the NPO− in figure 7. It is noted that the PNA+ (NPO−) corresponds to a weak (strong) cold anomaly in the lower (higher) latitudes or in the latitude region 25°–40° N (35°–50° N) over the eastern North America (figures 7(a) and (b)). The strong and widespread cold anomaly in the higher latitudes of North America (figure 7(b)) is likely due to long lifetime, large zonal width and strong retrogression of the NPO− (figure 7(d)). In contrast, the weak cold anomaly in the lower latitudes of the eastern North America (figure 7(a)) is likely attributed to short lifetime, small zonal width and strong eastward movement of the PNA+ (figure 7(c)). Thus, in the following discussions we only consider the influences of PNA+ and NPO− events on the cold anomalies over the eastern North America. Since the winter PNA+ or NPO− pattern can be considered as a DJF-mean result of individual PNA+ or NPO− events in winter, the variation of the winter PNA+ or NPO− pattern can be approximately reflected by the DJF-mean change in individual PNA+ or NPO− events. Thus, it is useful to examine the composite results of the individual PNA+ and NPO− events associated with VM and PDO to understand how the VM and PDO influence the North American sub-seasonal cold extremes associated with PNA+ and NPO− events. Here, we did not consider the role of the negative PDO (VM) phase having at least −0.5 STD value of the raw PDO (VM) index or its band-pass filtered index (not shown), because the sub-seasonal cold anomalies over the eastern North America are very weak even when PNA+ (NPO−) events are present (figure S4). Here, we define the 9 yr low pass (high pass) PDO (VM) time series with ⩾0.5 STDs as a PDO+ (VM+) winter. It is found that there are 20 PDO+ and 20 VM+ winters during 1950–2019. In the PDO+ (VM+) winter there are 39 (27) individual PNA+ events and 34 (46) individual NPO− events respectively, corresponding to 1.95 (1.35) PNA+ and 1.7 (2.30) NPO− events per PDO+ (VM+) winter. Clearly, PNA+ events are more frequent during the PDO+ winter than during the VM+ winter, whereas NPO− events are more frequent during the VM+ winter than during the PDO+ winter. This indicates that the PDO+ (VM+) promotes the occurrence of PNA+ (NPO−) events.

Figure 6. Time-mean fields of composite daily Z500 and SAT anomalies averaged from lag −10 to 10 d for (a) 92 PNA− and (b) 84 NPO+ events during the 1950–2019 winters. The region of the SAT anomaly (color shading) with the 95% confidence level based on a two-sided Student's t-test is plotted.
Download figure:
Standard image High-resolution image
Figure 7. (a), (b) Time-mean fields of composite daily Z500 and SAT anomalies averaged from lag −10 to 10 d for (a) 102 PNA+ and (b) 107 NPO− events during 1950-2019 and (c), (d) Hovmöller diagrams showing the time–longitude evolutions of the composite daily Z500 anomalies averaged over the latitudes (40°–60° N) for (c) the PNA+ and over the latitudes (50°–70° N) for (d) the NPO−, where the black contour line is 60 gpm and the thick blue line represents the maximum position of daily composite Z500 anomaly in panels (c) and (d). In panels (a) and (b), the color shading region represents the SAT anomaly being significant at the 95% confidence level based on a two-sided Student's t-test.
Download figure:
Standard image High-resolution imageThe time-mean fields of composite daily Z500 and SAT anomalies averaged over the life span of PNA+ and NPO− events from lag −10 to 10 d are shown in figures 8(a)–(d) for PDO+ and VM+ winters, where lag 0 denotes the peak day of the PNA+ (NPO−) event. It is interesting to see that the time-mean fields of composite daily Z500 anomalies associated with PNA+ events exhibit a zonally (meridionally) oriented wave train structure for VM+ (PDO+) due to strong (weak) basic zonal winds in the latitudes (30°–60° N) of the North America, thereby leading to strong (weak) sub-seasonal cold anomalies in the higher (lower) latitudes of the eastern North American sector (figures 8(d) and (e)). Because PNA+ events are more frequent during the PDO+ winter than during the VM+ winter as noted above, sub-seasonal cold extremes more easily occur in the lower latitudes of the eastern North America during the PDO+ winter (figure 8(d)). Moreover, we see that while the sub-seasonal cold anomaly associated with NPO− events is strong over the North America for both the PDO+ and VM+ winters (figures 8(a) and (b)), it is located in the higher latitudes for VM+ than for PDO+ (figure 8(c)). The above results also hold even for raw PDO and VM indices (figure S5). Consequently, the PDO+ (VM+) favors more frequent sub-seasonal cold extremes mainly occurring in the lower (higher) latitudes of the eastern North America via changes in PNA+ and NPO−.
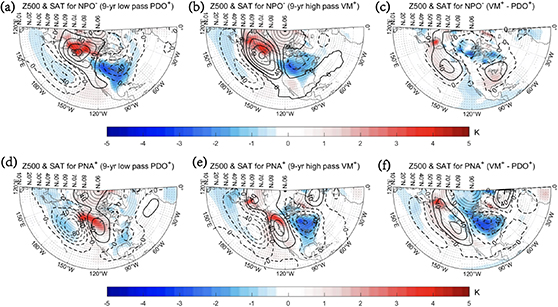
Figure 8. Time-mean fields of composite daily Z500 and SAT anomalies averaged from lag −10 to +10 d for (a) 34 and (b) 46 NPO− events as well as (d) 39 and (e) 27 PNA+ events (lag 0 denotes the peak day of the PNA+ or NPO− event) during the (a), (d) 20 PDO+ and (b), (e) 20 VM+ winters based on 9 yr low pass PDO index and 9 yr high pass VM index during 1950–2019 and (c), (f) VM+ minus PDO+ differences. The dots represent regressions being significant at the 95% confidence level based on a two-sided Student's t-test.
Download figure:
Standard image High-resolution image3.3. Physical mechanism of the Victoria mode and PDO influencing the positive PNA and negative NPO events
In fact, the NPO− pattern is similar to a North Pacific blocking (Luo et al 2020a). Thus, changes in the NPO− and PNA+ events induced by PDO+ and VM+ can be explained by the NMI theory of PNA (Luo et al 2020b) and atmospheric blocking (Luo and Zhang 2020) in terms of the magnitudes and spatial distributions of the winter background zonal wind and meridional potential vorticity gradient (PVy) (figure 9) calculated based on 30 d low-pass filtered fields. Here, a 30 d filter we used is to remove individual PNA and NPO events in order to obtain the winter background field by calculating the DJF average. It is seen that the winter 500 hPa background zonal wind (U500) or PVy is weak over the high latitude region (north of 45° N) of North Pacific (150° E–130° W), but strong in the North Pacific midlatitude region (20°–45° N) (figures 9(a), (b), (d) and (e)). Because PVy or U500 is smaller (larger) in the higher (lower) latitudes, the NPO− (PNA+) can have larger (smaller) amplitude, longer (shorter) lifetime, larger (smaller) zonal width and stronger retrogression (eastward movement). This explains why the NPO− can have a more important effect on the cold extremes or anomalies over the eastern North America than the PNA+. It is also noted that U500 or PVy in the latitudes 20°–50° N (50°–80° N) of North Pacific is weaker (stronger) during the VM+ winter than during the PDO+ winter (figures 9(c) and (f)). In addition, we can see that U500 and PVy are stronger in the latitudes (30°–60° N) of North America during the VM+ winter than during the PDO+ winter.
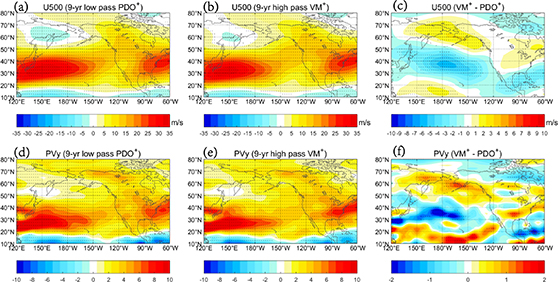
Figure 9. Composite DJF-mean 30-days low-pass U500 and PVy anomalies in the (a), (d) PDO+ winters and (b), (e) VM+ winters and (c), (f) their differences (VM+ minus PDO+) during 1950–2019 based on the 9 yr low pass PDO index and 9 yr high pass VM index. The dots represent the regions above 95% confidence level based on a two-sided Student's t-test.
Download figure:
Standard image High-resolution imageBecause the anticyclonic anomaly of the NPO− (PNA+) event is located in the high (middle) latitudes of North Pacific where PVy is small (large), the anticyclonic anomaly of the NPO− is inevitably more persistent, stronger and more moving westward and has larger zonal width than that of the PNA+ near the west coast of North America, which is more evident during the VM+ winter (figures 8(d) and (e)) than during the PDO+ winter (figures 8(a) and (b)). This feature can be further seen from figures 8(c) and (f). To understand the differences of the PNA+ and NPO− events between VM+ and PDO+, it is useful to show the longitude-time evolutions of the composite daily Z500 anomalies averaged over the latitudes (40°–60° N) for the PNA+ and over the latitudes (50°–70° N) for the NPO− in figure 10. The zonal movement of PNA+ or NPO− in figure 10 can be explained by  in terms of changes in
  ,
,  and
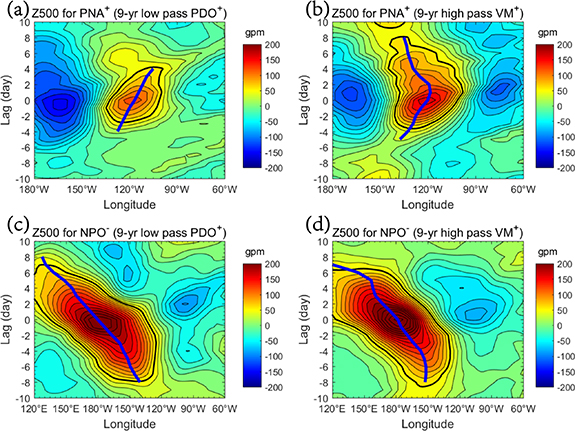
and  . It is found that the North American anticyclonic anomaly of the PNA+ shows small zonal width, which is weak, short-lived and moving eastward (figure 10(a)), so that its cyclonic anomaly leads to a weak cold anomaly over the eastern North America during the PDO+ winter (figure 8(a)). But during the VM+ winter, the eastward movement of the PNA+ anticyclonic anomaly is suppressed and it becomes more persistent and has larger zonal width (figure 10(b)) such that the cyclonic anomaly of the PNA+ is also more persistent and appears in the higher latitudes of the eastern North America. In such a case, the PNA+ also corresponds to a strong cold anomaly in the higher latitudes of the eastern North America during the VM+ winter (figure 8(e)). We further note that the anticyclonic anomaly of the NPO− has large zonal width and is moving westward and long-lived during VM+ (figure 10(d)) and PDO+ (figure 10(c)) winters, but its retrogression is suppressed due to larger U500 and PVy in the high latitudes of North Pacific during the VM+ winter (figure 10(d)). Because of the stronger retrogression of the anticyclonic anomaly of the NPO− during the PDO+ winter, its North American cyclonic anomaly also moves westward more rapidly across the North America and causes a widespread cold anomaly (figure 8(d)). Nevertheless, the cold anomaly of the NPO− seems to be located in higher latitudes of the eastern North America during the VM+ winter (figure 8(e)) than during the PDO+ winter (figure 8(d)). Because NPO− events are more frequent during the VM+ winter than during the PDO+ winter, VM+ favors the cold extremes in the higher latitudes of the eastern North America. On the other hand, we see that the anticyclonic anomaly of the NPO− (figures 10(c) and (d)) has larger zonal scale or width than the North American anticyclonic component of the PNA+ (figures 10(a) and (b)). The main cause of this difference is that the NPO− (PNA+) in the higher (lower) latitudes corresponds to a smaller (larger) PVy where the zonal scale of the anticyclonic anomaly of the NPO− (PNA+) is lengthened (shortened) according to the theoretical result of Zhang and Luo (2020). Thus, the PDO and VM can influence the NPO− and PNA+ to cause changes in the cold extremes over the eastern North America through changing PVy and basic zonal winds.
Figure 10. (a)–(d) Time–longitude evolution of the composite daily Z500 anomalies during the life cycles of (a), (b) PNA+ and (c), (d) NPO+ events averaged over the latitudes (40°–60° N) for the PNA+ and over the latitudes (50°–70° N) for the NPO− during the PDO+ and VM+ winters based on the 9 yr low pass PDO index and 9 yr high pass VM index. The black contour line is 60 gpm and the thick blue line represents the maximum position of the daily composite Z500 anomaly.
Download figure:
Standard image High-resolution image
4. Conclusion and discussion
In this paper, we have examined what leads to the interannual-to-decadal variability of winter cold extremes in the east part of North America during 1950–2019. It is found that both the PNA+ and NPO− patterns contribute to the winter cold extremes over the eastern North America. The winter cold extremes can exhibit a notable decadal variability with a decadal peak of 11 yr probably due to the combined effect of the PDO and VM through changing the PNA+ and NPO− events in frequency, movement, persistence, intensity, zonal width and spatial structure. The NPO− (PNA+) events are more frequent (infrequent) during the VM+ winter than during the PDO+ winter, thus indicating that NPO− (PNA+) events easily occur during the VM+ (PDO+) winter. The changes in the strength, zonal width and movement of NPO− and PNA+ events modulated by PDO and VM may be explained by the meridional potential vorticity gradient (PVy) theory of the NMI model (Luo et al 2019, 2020b, 2023, Luo and Zhang 2020). When PVy is small in a specified region and its adjacent region especially in the high latitudes, the blocking anticyclonic anomaly can show long lifetime, strong retrogression, large zonal width and large amplitude. This explains why the NPO− exhibits larger intensity, longer lifetime, larger zonal width and stronger retrogression than the PNA+. Thus, the phases of PDO and VM can significantly influence the NPO− and PNA+ through changing PVy and basic zonal winds.
Although the PNA+ (NPO−) events can produce sub-seasonal cold anomalies in the lower (higher) latitudes of the eastern North America, the PNA+ can also lead to a strong cold anomaly in the higher latitudes of the eastern North America due to increased persistence and weakened eastward movement under the VM+ condition. Thus, the PDO+ (VM+) is beneficial to the occurrence of winter cold extremes in the lower (higher) latitudes of the eastern North America through changing sub-seasonal cold anomalies associated with PNA+ and NPO− events. This leads us to infer that the interannual (decadal) variability of winter cold extremes occurring in the higher (lower) latitudes of the eastern North America is mainly caused by the positive phase of VM (PDO).
Our results also reveal that during the PDO+ (VM+) winter the PNA+ event can show a meridionally (zonally) oriented wave train structure and lead to a weak (strong) cold anomaly in the lower (higher) latitudes of the eastern North America. Compared to PDO+, the PNA+ and NPO− events, especially PNA+, can exhibit a more zonally oriented wave train structure during the VM+ winter (figures 8 (b) and (e)) mainly due to the intensification of the basic zonal wind and associated PVy in the North Pacific mid-high latitudes and in the North American sector (figure 9). Besides, the anticyclonic anomaly of NPO− or PNA+ event over the North Pacific is more easily maintained during the VM+ winter than during the PDO+ winter. The results clearly reveal that the phase of the PDO and VM can significantly influence PNA+ and NPO− events to result in a notable interannual-to-decadal variability of winter cold extremes in the east part of the North America due to changes in the strength and meridional distribution of the background zonal winds and PVy in the Pacific-North American sector.
It should be pointed out that in this paper we have ignored the impact of other factors (e.g. SST anomaly over North Atlantic, sea ice decline and warming over Tibetan plateau) on atmospheric circulation patterns in the Pacific-North American sector (Chen and Luo 2017). Some studies also noted that El Niño can produce sub-seasonal cold extremes in lower latitudes of the eastern North America via the PNA+ change (Ge and Luo 2022), even though VM is linked to El Niño–Southern Oscillation (ENSO) (Ding et al 2015). While El Niño can modulate North American cold anomalies via the PNA+ change, the impact of the PDO+ is mainly concentrated on decadal timescales. In addition, we have ignored the effect of ENSO in this paper. However, previous studies have mentioned that notable winter cold anomalies in the Pacific–North American sector do not originate directly from the tropics (Baxter and Nigam 2015). Nevertheless, whether ENSO strengthens or reduces the modulation of VM on NPO− is unclear. These issues deserve a further exploration.
Acknowledgments
This research is supported by the National Natural Science Foundation of China (42150204 and 42288101). The authors would like to thank two anonymous reviewers for their useful suggestions in improving this paper.
Data availability statement
The data that support the findings of this study are available upon reasonable request from the authors. The NCEP–NCAR data is publicly available at https://downloads.psl.noaa.gov/Datasets/ncep.reanalysis/.
Author contribution
Y Ge performed the analysis, plotted the figures and wrote the paper. D Luo conceived the research and revised the manuscript. This paper is a part of the first author's PhD thesis.
Conflict of interest
The authors declare that they have no competing interests.
Supplementary data (1.3 MB PDF)