


Abstract
The exceptional severity of recent climate extremes has raised the question of whether some events would have been impossible in the absence of global warming. This question is critical for climate adaptation, but is challenging to answer given the length and non-stationarity of the observational record. The large single-model ensemble climate simulations archived in the Coupled Model Intercomparison Project (CMIP6) offer a unique opportunity to explore whether the hottest temperatures of the current climate are more extreme than any that could have occurred in the absence of human forcings. We first analyze the one CMIP6 model that has daily data archived for large ensembles in both the historical all-forcings and historical natural forcings experiments. We find that, for large areas of the world, the maximum daily-, seasonal- and annual-scale thresholds of the large single-model ensemble with natural and human forcings ('all-forcings') are never reached in the large single-model ensemble with only natural forcings. However, we also identify widespread areas—notably in the northern hemisphere mid-latitudes—where the hottest thresholds of the all-forcings ensemble are frequently exceeded in the absence of human forcings. Further analysis suggests that human forcings other than greenhouse gases (GHGs) are a primary cause of this discrepancy. For example, when comparing the late and early periods of the CMIP6 historical all-forcings experiment, other large single-model ensembles exhibit similar muting of extremely warm years over northern-hemisphere mid-latitude regions. However, under GHG-only forcing, all years in the recent period are hotter than the hottest early-period year over most of the globe. These results suggest that, although the hottest possible events in the current climate may have been virtually impossible in the absence of historical GHG emissions, other non-GHG anthropogenic forcings have muted the emergence of previously impossible events.
Export citation and abstract BibTeX RIS

Original content from this work may be used under the terms of the Creative Commons Attribution 4.0 license. Any further distribution of this work must maintain attribution to the author(s) and the title of the work, journal citation and DOI.
1. Introduction
There are now numerous extreme event attribution approaches that have collectively confirmed the widespread influence of historical global warming on a range of climate extremes (e.g. (Trenberth et al 2015, NAS 2016, Shepherd 2016, Diffenbaugh et al 2017, Otto 2017, Stott et al 2017, Swain et al 2020, van Oldenborgh et al 2021)). The exceptional severity of some recent events has raised the question of whether they would have been impossible without global warming (Philip et al 2020, Fischer et al 2021, Gessner et al 2021, van Oldenborgh et al 2021). This question is not a mere curiosity. Recent research confirms that the impacts of intensifying extremes are already severe (IPCC 2012), including—but not limited to—large financial costs (e.g. (Coronese et al 2019, Davenport et al 2021, Diffenbaugh et al 2021, Strauss et al 2021)). Preparation for events that may have been deemed impossible at the time that existing resource- and risk-management systems were designed and built is thus an increasingly pressing adaptation challenge.
Despite its importance, the question of impossibility poses particular scientific barriers (Philip et al 2020, Gessner et al 2021, van Oldenborgh et al 2021). Apart from debates about whether the impossibility of a single event can be definitively proven (e.g. (Howson 1988, van Oldenborgh et al 2021)), quantification of historical changes in extreme event probability is inherently challenging (e.g. (Trenberth et al 2015, NAS 2016, Otto et al 2016, Shepherd 2016, Otto 2017, Philip et al 2020, Slater et al 2021, van Oldenborgh et al 2021)), particularly for events that fall outside of the observed distribution (Diffenbaugh et al 2017, 2018, Diffenbaugh 2020, Gessner et al 2021). Limitations of both the observational record and climate models contribute to these challenges (Peterson et al 2013, NAS 2016), and are even more acute for the impossibility question. For example, methods that compare early and late observational periods contain inadequate populations of events to draw definitive conclusions about impossibility (e.g. (Gessner et al 2021, van Oldenborgh et al 2021)). Indeed, given the limited length of the observational record and the limitations of parametric methods to extrapolate beyond the short observational period (e.g. (Sippel et al 2015, Diffenbaugh 2020)), the impossibility question cannot be robustly answered using observational data alone (Gessner et al 2021).
Large climate model ensembles can overcome some of these limitations by providing thousands of years of simulated climate within a given forcing regime. A particularly powerful innovation in recent years has been the advent of large single-model ensembles (e.g. (Deser et al 2012, 2020)), in which differences between the model realizations result only from internal climate variability (Hawkins and Sutton 2009, Deser et al 2012, 2020). Large single-model ensembles have greatly enhanced understanding of the probability of events that fall at the edge—or outside of—the observed historical range (e.g. (Swain et al 2014, 2020, Diffenbaugh et al 2017, Diffenbaugh 2020, Gessner et al 2021)).
Although climate model ensembles can help in overcoming the limitations of small sample sizes (e.g. (Sippel et al 2015, Diffenbaugh et al 2017, Gessner et al 2021)), a major remaining limitation has been the lack of large single-model ensembles that simulate the historical period in the absence of human forcing (e.g. (Diffenbaugh et al 2015, 2017, Gessner et al 2021)). As a result, studies that use single-model ensembles to analyze historically unprecedented events (e.g. (Diffenbaugh et al 2017, Gessner et al 2021)) have been unable to distinguish the roles of different human and natural forcings (though some studies have distinguished the effects of individual forcings such as greenhouse gases (GHGs), aerosols and land use on less severe extremes; e.g. (Thiery et al 2017, Chen and Dirmeyer 2019, Singh et al 2019, Westervelt et al 2020, Touma et al 2021)). In contrast, the many studies that use multi-model ensembles to separate the influence of human and natural forcings have generally been unable to disambiguate influences of model structure, internal variability, and individual human forcings.
The simulations archived in Phase 6 of the Coupled Model Intercomparison Project (CMIP6) (Eyring et al 2016) address a number of these limitations. First, multiple models have archived large single-model ensembles of the historical all-forcing experiment ('Historical'; table S1 available online at stacks.iop.org/ERL/16/115014/mmedia). Second, the Model for Interdisciplinary Research on Climate (MIROC6) has archived daily temperature data from 50 realizations of the Historical experiment and 50 realizations of the experiment with only natural forcings ('Natural'). Third, while MIROC6 is the only model in the CMIP6 archive with daily data from a large ensemble of both the Historical and Natural experiments, most of the models with large single-model ensembles in the Historical experiment also include additional realizations under individual forcings, such as GHGs ('Hist-GHG'). The CMIP6 large ensemble simulations thus present a unique opportunity to test whether the most extreme event thresholds of the current climate would be impossible in the absence of anthropogenic forcing.
2. Methods
2.1. CMIP6 global climate model archive
We analyze global climate model ("GCM") data from the CMIP6 archive (Eyring et al 2016). The primary analysis leverages output from the MIROC6 model (Tatebe et al 2019), which is unique in archiving daily data from large single-model ensembles for both the Historical and Natural experiments. We also evaluate the MIROC6 results within the context of the larger CMIP6 ensemble, including models that archive at least 30 realizations of the Historical forcing experiment along with results of the Hist-GHG experiment (table S1).
2.2. Global temperature analysis
Model biases in the response of global temperature to external forcings will limit insights about the possibility of extreme event thresholds at different levels of forcing. To explore potential biases, we compare the MIROC6 global temperature time series with the larger CMIP6 ensemble (table S1) and with global temperature observations from the NASA Goddard Institute for Space Studies Surface Temperature Analysis (GISTEMP v4) (Lenssen et al 2019, GISTEMP 2021) (figure 1). For each Historical climate model realization, we calculate the area-weighted annual-mean global temperature in each calendar year (i.e. from 1850 to 2014). Because the UN Paris Agreement identifies global warming thresholds 'above pre-industrial levels' (UNFCCC 2015), we express the annual global temperature anomalies relative to a late-19th century baseline. However, because the NASA GISTEMP data do not begin until 1880, we use 1880–1899 as the late-19th century baseline for the global temperature analysis.
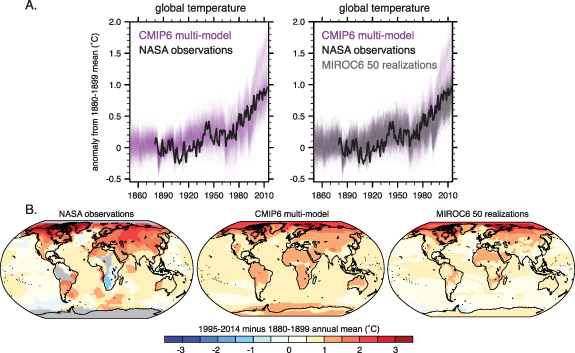
Figure 1. Historical change in mean annual temperature. (A) Time series of annual global temperature anomalies relative to the 1880–1899 baseline for the CMIP6 models and the NASA global temperature observations. Left panel shows the CMIP6 ensemble in purple (including the MIROC6 large single-model ensemble); right panel shows the MIROC6 realizations in grey. (B) Maps of the difference in mean annual temperature between the 1995–2014 and 1880–1899 periods. Left panel shows the NASA observations (with grey areas showing areas of missing data); center panel shows the CMIP6 Historical ensemble (including the MIROC6 large single-model ensemble); right panel shows the MIROC6 Historical realizations.
Download figure:
Standard image High-resolution imageFor each climate model realization, we calculate the difference between the annual global temperature in each year and that climate model realization's 1880–1899 mean global temperature. For the NASA GISTEMP observations, which are provided as annual global temperature anomalies relative to the 1951–1980 baseline, we re-scale the annual anomalies to the 1880–1899 baseline by calculating the difference between the anomaly in each year and the mean of the 1880–1899 anomalies. In this way, all global temperature time series are expressed as anomalies relative to the 1880–1899 baseline (figure 1).
2.3. Exploring the impossibility of extreme temperature thresholds using the MIROC6 large single-model ensemble
The MIROC6 large ensemble contains daily output from 50 realizations of the Historical experiment and 50 realizations of the Natural experiment. To test the impossibility of the most extreme hot events in the absence of anthropogenic forcing, we quantify the frequency and magnitude of daily-, seasonal- and annual-scale extreme temperature thresholds across the >8000 simulated years of each experiment.
First, for each grid point, we calculate the hottest consecutive 5-day, 3-month and 12-month period that occurs in any of the 50 realizations of the Historical experiment ('Historical grand maximum') and Natural experiment ('Natural grand maximum'). (To do so, for each grid point, we calculate the respective running mean across the time dimension of each realization, and then find the grid-point grand maximum across all of the respective 50 realizations.) Then, at each grid point, we calculate—for the 5-day, 3-month and 12-month periods, respectively—(a) the difference in magnitude between the Historical and Natural grand maxima, (b) the fraction of Natural realizations for which the hottest period exceeds the Historical grand maximum, and (c) the fraction of Historical realizations for which the hottest period exceeds the Natural grand maximum.
We complement this analysis of the ensemble grand maximum with a bootstrap comparis randomized pairs of Historical and Natural realizations. We first randomly select one Historical realization and one Natural realization. Then, at each grid point, we calculate—for the 5-day, 3-month and 12-month periods, respectively—whether the hottest period of the Historical realization exceeds the hottest period of the Natural realization. We repeat this randomized paired comparison for 1000 bootstrap iterations, and then calculate the fraction of bootstrapped pairings for which the hottest period of the Historical realization exceeds the hottest period of the Natural realization.
We also analyze the CMIP6 experiment in which the models are forced only by historical changes in GHG concentrations ('Hist-GHG'). We first focus on the central US (37 °N–50 °N, 263 °E–275 °E), over which the Natural grand maximum is hotter than the Historical grand maximum (figure 2). We select the three MIROC6 members that have results archived in the Historical, Natural and Hist-GHG experiments. Then, for each year of each realization, we identify the hottest 5-day, 3-month and 12-month periods that occur anywhere in the region. This yields 495 annual-maximum 5-day, 3-month and 12-month values for the 1850–2014 period across the three realizations in each experiment. We then create empirical quantile–quantile (Q–Q) plots for the Historical versus Natural experiments and Hist-GHG versus Natural experiments for the 495 annual-maximum 5-day, 3-month and 12-month temperatures within the region.

Figure 2. Difference in magnitude and frequency of extreme hot thresholds in the MIROC6 Historical and Natural large single-model ensembles. (A) Difference (Historical minus Natural) in the magnitude of the hottest 5-day, 3-month and 12-month period that occurs in any of the 50 realizations of the Historical experiment ('Historical grand maximum') and Natural experiment ('Natural grand maximum'). (B) The fraction of Natural realizations for which the hottest period exceeds the Historical grand maximum. Grey areas indicate zero exceedance. (C) The fraction of Historical realizations for which the hottest period exceeds the Natural grand maximum. Grey areas indicate zero exceedance. (D) The fraction of 1000 bootstrapped pairings for which the hottest period of the Historical realization exceeds the hottest period of the Natural realization (see section 2).
Download figure:
Standard image High-resolution image2.4. Evaluating MIROC6 results within the context of other CMIP6 large single-model ensembles
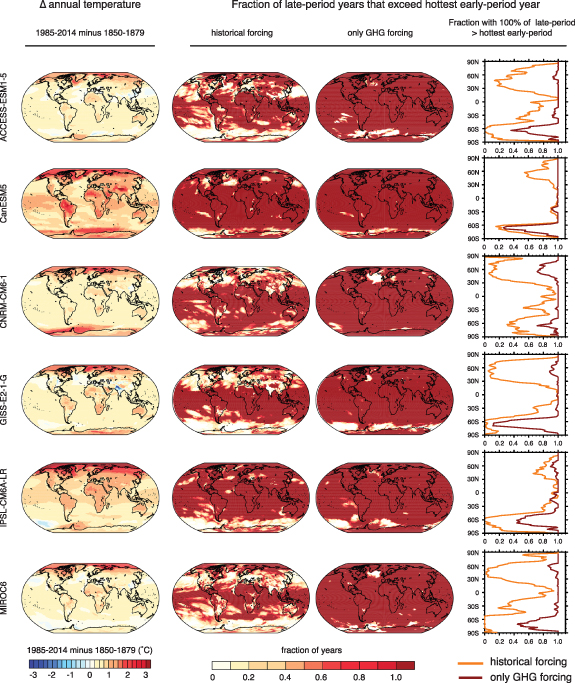
We test the robustness of the MIROC6 results by analyzing the CMIP6 models that have archived (a) at least 30 realizations of the Historical experiment and (b) results of the Hist-GHG experiment (table S1). For each of the large single-model ensembles, we first quantify the difference in mean annual temperature between the last three decades (1985–2014) and first three decades (1850–1879) of the Historical experiment. Then, for each grid point, we quantify the fraction of years in the 1985–2014 period that are hotter than the hottest year in the 1850–1879 period (calculated separately for the Historical and Hist-GHG experiments, respectively). Finally, we quantify the fraction of grid points in each latitude band for which 100% of years in the 1985–2014 period exceed the hottest year in the 1850–1879 period.
3. Results
Global temperature in the CMIP6 ensemble tracks the observed global temperature evolution, particularly over the past half-century (e.g. (IPCC 2021)) (figure 1(A)). Most of the MIROC6 ensemble simulates less global warming than has been observed (Tatebe et al 2019), although the MIROC6 range encompasses the observed warming (figure 1(A)). In contrast, numerous CMIP6 realizations simulate substantially more warming than both MIROC6 and the observations. As a result, the difference in mean annual temperature between the recent period and the late-19th century is generally larger in the CMIP6 multi-model ensemble than the MIROC6 single-model ensemble (figure 1(B)). The NASA observations show even greater warming than either ensemble over much of the globe, particularly northern hemisphere land areas (figure 1(B)).
Over most of the globe, the hottest periods achieved in >8000 years of the MIROC6 Historical ensemble exceed the hottest periods achieved in >8000 years of the MIROC6 Natural ensemble (figure 2(A)). This is most broadly true for the hottest 12-month period, but is also seen in the hottest 3-month and 5-day periods. Over many of the areas in which the Historical grand maximum is hotter than the Natural grand maximum, a large fraction of the Historical realizations are also hotter than the Natural grand maximum (figure 2(C)). For example, over broad areas of the tropics, the Natural grand maximum is exceeded in >99%, >75% and >50% of the Historical realizations for the hottest 12-month, 3-month and 5-day periods, respectively. Further, these areas exhibit high fractions of bootstrapped pairs in which the hottest Historical period exceeds the hottest Natural period, including >90% for most tropical ocean areas and >75% for most tropical land areas (figure 2(D)).
However, there are broad areas over which the MIROC6 Natural ensemble exhibits hotter periods than those achieved in the MIROC6 Historical ensemble, particularly over the northern-hemisphere mid-latitudes and the Southern Ocean (figure 2(A)). Many of these areas exhibit exceedance of the Historical grand maximum in a non-trivial percentage of the Natural realizations, including >50% over areas of the central US and >33% over areas of western Europe for the hottest 5-day period (figure 2(B)). These areas likewise exhibit relatively low fractions of bootstrapped pairs in which the hottest Historical period exceeds the hottest Natural period, including <10% over areas of the central US and <25% over areas of western Europe for the hottest 5-day period (figure 2(D)).
Given the documented influence of non-GHG anthropogenic forcings such as aerosols and land use on heat extremes (e.g. (Qian and Giorgi 2000, Bonan 2001, Diffenbaugh 2009, Mascioli et al 2016, Findell et al 2017, Thiery et al 2017, Samset et al 2018, Xu et al 2018, Chen and Dirmeyer 2019, Westervelt et al 2020)), we investigate whether the muting of extreme temperature in the Historical ensemble is caused by anthropogenic forcings other than GHGs. We begin by analyzing the MIROC6 simulations over the central US, which is one of the areas of most pronounced muting of extreme temperature (figure 2). In this region, we find that although the hottest events in the MIROC6 Natural simulations are hotter than the MIROC6 Historical simulations, the hottest events in the MIROC6 Hist-GHG simulations are consistently hotter than either the Natural or Historical simulations (figure 3).

Figure 3. Empirical Q–Q plots comparing the hottest regional temperatures over the central US (37 °N–50 °N, 263 °E–275 °E) in the MIROC6 Historical, Natural and Hist-GHG experiments. Q–Q plots are based on the three MIROC6 members that have results archived for the 1850–2014 period in all three experiments. For each year of each realization, we identify the hottest 5-day, 3-month and 12-month event that occurs anywhere in the region, yielding 495 annual-maximum values for each type of event (5-day, 3-month and 12-month) in each experiment (Historical, Natural and Hist-GHG). We then create empirical Q–Q plots for the Historical versus Natural experiments and Hist-GHG versus Natural experiments for the 495 annual-maximum 5-day, 3-month and 12-month temperatures within the region.
Download figure:
Standard image High-resolution imageWe test whether this discrepancy between GHG and non-GHG anthropogenic forcings is consistent across regions and climate models using the large numbers of years available in the other CMIP6 large single-model ensembles. In comparing the early and late periods of the Historical experiment, we find that multiple models (e.g. ACCESS-ESM1-5, CNRM-CM6-1, and GISS-E2-1 G) exhibit changes in mean annual temperature that are similar in magnitude to MIROC6 (figure 4). In addition, like MIROC6, these models also exhibit broad areas of the northern-hemisphere mid-latitudes where low fractions of late-period years exceed the hottest early-period year. However, in the Hist-GHG experiment, all of these models exhibit high fractions of late-period years that exceed the hottest early-period year, including 100% of late-period years over most of the tropics, sub-tropics and northern-hemisphere mid- and high-latitudes.
Figure 4. Comparison of the early and late periods of the Historical and Hist-GHG experiments for CMIP6 models that have archived at least 30 realizations for the Historical experiment and results for the Hist-GHG experiment. The left panel shows the difference in mean annual temperature between the last three decades (1985–2014) and first three decades (1850–1879) of the Historical experiment. The two center panels show the fraction of years in the 1985–2014 period that are hotter than the hottest year in the 1850–1879 period for the Historical and Hist-GHG experiments, respectively. The right panel shows the fraction of grid points in each latitude band for which 100% of years in the 1985–2014 period exceed the hottest year in the 1850–1879 period.
Download figure:
Standard image High-resolution image
4. Discussion
We use a subset of the CMIP6 climate model archive to explore whether the hottest events of the current climate would have been possible in the absence of global warming. This subset includes (a) large single-model ensembles of both the Historical and Natural forcing experiments from the MIROC6 climate model, (b) large single-model ensembles of the Historical forcing experiment from multiple climate models, and (c) ensembles of the historical GHG-only experiment from multiple climate models.
Together, these simulations suggest that many areas of the globe—particularly in the tropics, sub-tropics, and northern-hemisphere high latitudes—have already moved into a climate where the hottest daily-, seasonal- and annual-scale conditions would not have occurred in thousands of years without anthropogenic forcings. However, in much of the mid-latitudes, there is high probability that the hottest conditions in the current climate could have occurred in the absence of anthropogenic forcings. In analyzing these latter regions, we find a clear contrast between historical simulations that include all anthropogenic forcings and those that include only historical increases in GHG concentrations, with the GHG-only simulations exhibiting a high prevalence of conditions hotter than any achieved with natural forcings alone.
Our results agree with previous findings of earliest historical emergence of unprecedented heat in the low latitudes (e.g. (Diffenbaugh and Scherer 2011, Mahlstein et al 2011, Diffenbaugh et al 2017)), and previous findings that additional warming is highly likely to cause widespread emergence of hot extremes that fall well outside of the historical envelope (Battisti and Naylor 2009, Diffenbaugh and Scherer 2011, Diffenbaugh and Giorgi 2012, Hawkins et al 2014, Fischer and Knutti 2015, Seneviratne et al 2016, Diffenbaugh et al 2018, Fischer et al 2021). This global pattern of unprecedented heat emergence is strongly influenced by the pattern of internal climate variability, with lower-latitude areas exhibiting more rapid emergence due to lower interannual variability, despite lower-magnitude warming signal in many areas (e.g. (Hawkins et al 2014, Diffenbaugh and Charland 2016)). This critical role of variability is also indicated in our results for emergence of previously impossible events, with both lower-latitude regions and longer time-scale events exhibiting stronger emergence (figures 2 and 3). For example, the area of the northern-hemisphere mid-latitudes over which the MIROC6 Natural grand maximum is warmer than the MIROC6 Historical grand maximum is larger for the hottest 5-day period than the hottest 12-month period (figures 2(A) and (B)). A similar contrast is seen over the Southern Ocean (figures 2(A) and (B)) where internal variability has a strong influence on historical temperature trends (e.g. (Zhang et al 2019)), although it should be noted that muted warming of the Southern Ocean is consistent with the Southern Ocean response to greenhouse forcing (e.g. (Armour et al 2016)), and figure 4)). The role of ocean variability in shaping the pattern of emergence of previously impossible temperature thresholds requires further investigation, such as analysis of atmospheric initial-conditions large ensembles (e.g. (Deser et al 2020)) and benchmark GCM simulations with prescribed ocean conditions (e.g. (Stone and Pall 2021)).
Our results also agree with previous findings of muting of hot extremes by anthropogenic aerosols (e.g. (Qian and Giorgi 2000, Mascioli et al 2016, Samset et al 2018, Xu et al 2018, Westervelt et al 2020)). For example, Westervelt et al recently reported substantial warming of the 200 year return-interval temperature in response to removal of early 21st-century anthropogenic aerosol emissions (both globally and over northern hemisphere mid-latitudes) (Westervelt et al 2020). Likewise, our results also agree with previous findings of muting of hot extremes by historical anthropogenic land use change, particularly over land areas of the northern-hemisphere mid-latitudes (e.g. (Thiery et al 2017, Chen and Dirmeyer 2019)).
Our analysis builds on these previous studies by analyzing a much larger population of historical realizations, thereby including events with much longer return intervals. A key advantage is that the large population sizes from multiple climate models mean that we do not have to employ parametric methods, whose assumptions about the underlying statistical distribution introduce substantial uncertainty when analyzing the most extreme events in a non-stationary climate (e.g. (Diffenbaugh et al 2017)). Our analysis thus both complements and extends previous studies.
Our approach could be readily applied to other kinds of extremes. As with extreme event attribution more broadly, the clearest impact of global warming on previously impossible events is likely to be via thermodynamic influences (Trenberth et al 2015), and hence the clearest emergence is likely to occur for events associated with high temperature, heavy precipitation, storm surge flooding, and low sea ice and snowpack. However, each of these types of events will require in-depth analysis to test the emergence of previously impossible thresholds. In addition, it will also be critical to evaluate not just the extreme event outcomes, but also the underlying physical ingredients (e.g. (Singh et al 2014, 2016, Swain et al 2014, 2016, Wang et al 2014, Horton et al 2015, Diffenbaugh et al 2017, Trenberth et al 2018, Davenport and Diffenbaugh 2021)).
We note a number of caveats and areas for improvement. First and foremost, while our framework has the advantage of not requiring parametric approaches, a disadvantage is the potential for climate model biases to affect the calculation of whether a particular event threshold would have been impossible without global warming. Specifically, our framework is subject to two types of bias: bias in the simulation of internal climate variability, and bias in the response to external climate forcing. While the MIROC6 GCM offers a unique opportunity to analyze daily-scale extremes in a large single-model ensemble of both the Historical and Natural experiments, having only one climate model that meets these criteria means that the conclusions could be influenced by systematic biases in that model. While we have sought to compare the MIROC6 results with results of other large single-model ensembles, further verification of the robustness of our conclusions will require multiple models to also archive daily output from large ensembles of both the Historical and Natural forcing experiments.
In addition, while we have attempted to use the Hist-GHG simulations to distinguish the influence of anthropogenic GHG forcing from the influence of other human forcings and internal variability, there are at least two caveats to this part of our analysis. The first is that, in most cases, the size of the Hist-GHG ensemble is only a fraction of the size of the Historical ensemble (table S1). For those models, the Hist-GHG ensemble likely does not capture the full range of internal variability—a limitation that is particularly pronounced in MIROC6, for which the Hist-GHG ensemble is less than 10% of the size of the Historical ensemble. The second caveat is that there are a number of historical anthropogenic forcings in addition to GHGs, including land use/land cover change and multiple types of aerosols. Previous studies have used GCM ensembles to compare the relative effects of different anthropogenic forcings on heat extremes, and found that both land use and ozone/aerosols can account for local cooling of 0.5 °C–1.0 °C in the climatology of the warmest day (Chen and Dirmeyer 2019). However, those analyses used smaller ensembles to analyze heat extremes that are less rare than the impossibility standard analyzed here. Robustly isolating the influence of individual human forcings on the most extreme hot events in different parts of the world will require large single-model ensembles in each single-forcing experiment.
5. Conclusions
Our analyses suggest both that (a) we are now in a climate that is capable of generating hot conditions that would have been extremely unlikely without global warming, and (b) although the hottest events in the current climate may have been virtually impossible in the absence of historical GHG emissions, other non-GHG anthropogenic forcings have muted the magnitude of the hottest events over many areas of the globe.
The question of whether global warming is already causing extreme events that were previously impossible is critical for climate change adaptation, both now and in the future. Climate impacts continue to intensify, driven largely by intensifying extremes (e.g. (IPCC 2012, 2014)). Given the non-linearity of many climate impacts (e.g. (Schlenker and Roberts 2009, Burke et al 2015, Carleton and Hsiang 2016, Deryugina and Hsiang 2017, Hsiang et al 2017, Davenport et al 2021, Diffenbaugh et al 2021)), there are pronounced adaptation challenges associated with events that are more extreme than any for which societies have prepared. The potential for previously impossible events to emerge at higher levels of warming has long been known (e.g. (IPCC 2012)). Our results support the notion that such events are already emerging over much of the globe, and that further warming will accelerate those risks.
Acknowledgments
This paper is dedicated to Dr. Geert Jan van Oldenborgh (1961-2021), whose work inspired this and many other studies. We thank two anonymous reviewers for insightful and constructive feedback. We acknowledge the World Climate Research Programme, which, through its Working Group on Coupled Modelling, coordinated and promoted CMIP6. We thank the climate modeling groups for producing and making available their model output, the Earth System Grid Federation (ESGF) for archiving the data and providing access, and the multiple funding agencies who support CMIP6 and ESGF. Computational resources were provided by Stanford's Center for Computational Earth and Environmental Sciences and the Stanford Center for Research Computing. This research was supported by Stanford University.
Data availability statement
All data that support the findings of this study are included within the article (and any supplementary files).