

Abstract
We use atmospheric observations to quantify methane (CH4) emissions from Mexico's most important onshore and offshore oil and gas production regions which account for 95% of oil production and 78% of gas production. We use aircraft-based top-down measurements at the regional and facility-levels to determine emissions. Satellite data (TROPOMI CH4 data and VIIRS night-time flare data) provide independent estimates of emissions over 2 years. Our airborne estimate of the offshore region's emissions is 2800 kg CH4 h−1 (95% confidence interval (CI): 1700–3900 kg CH4 h−1), more than an order of magnitude lower than the Mexican national greenhouse gas inventory estimate. In contrast, emissions from the onshore study region are 29 000 kg CH4 h−1 (95% CI: 19 000–39 000 kg CH4 h−1), more than an order of magnitude higher than the inventory. One single facility—a gas processing complex that receives offshore associated gas—emits 5700 kg CH4 h−1 (CI: 3500–7900 kg CH4 h−1), with the majority of those emissions related to inefficient flaring and representing as much as half of Mexico's residential gas consumption. This facility was responsible for greater emissions than the entirety of the largest offshore production region, suggesting that offshore-produced associated gas is being transported onshore where it is burned and in the process some released to the atmosphere. The satellite-based data suggest even higher emissions for the onshore region than did the temporally constrained aircraft data (>20 times higher than the inventory). If the onshore production region examined is representative of Mexican production generally, then total CH4 emissions from Mexico's oil and gas production would be similar to, or higher than, the official inventory, despite the large overestimate of offshore emissions. The main driver of inaccuracies in the inventory is the use of generic, non-Mexican specific emission factors. Our work highlights the need for local empirical characterization of emissions if effective emissions mitigation is to be undertaken.
Export citation and abstract BibTeX RIS

Original content from this work may be used under the terms of the Creative Commons Attribution 4.0 license. Any further distribution of this work must maintain attribution to the author(s) and the title of the work, journal citation and DOI.
1. Introduction
Methane (CH4) is a powerful greenhouse gas (GHG), with an >80 times higher global warming potential than carbon dioxide over 20 years after it is released [1], and is responsible for at least 25% of current anthropogenic global warming [2]. The Intergovernmental Panel on Climate Change (IPCC) has underscored the importance of rapid CH4 emission reductions—in addition to carbon dioxide mitigation—if there is any effective possibility of staying below the 2 °C target, let alone 1.5 °C [3].
While there are numerous anthropogenic sources of CH4 emissions (i.e. enteric fermentation, rice production, agricultural and urban waste, fossil fuel production and distribution), the oil and gas supply chain presents the largest readily available and low cost mitigation opportunities: with technically feasible, cost-effective emission reduction solutions [4, 5]. Additionally, the number of commercial and government entities responsible for oil and gas infrastructure is relatively limited, facilitating the implementation of mitigation strategies that can yield substantive reductions in the rate of global temperature increases within a decade of implementation of emissions reductions.
Governments at national (e.g. Canada, Colombia, Mexico, US) [6, 7] and subnational levels (e.g. Alberta, British Columbia in Canada, and Colorado, California, in the US) [8–11], have made commitments to significantly reduce CH4 emissions from the oil and gas supply chain, as have portions of the oil and gas industry (e.g. the Oil and Gas Climate Initiative's companies establishing a CH4 intensity target) [12].
For these regulations and mitigation strategies to be effective—and to be able to track progress towards reduction targets—we need to quantify current emissions and their key characteristics, e.g. sources and spatial and temporal distributions. Empirically based assessments in the US, Canada, and to some extent in Europe [13–19] have already provided critical information to reduce uncertainty in the scale and location of CH4 emissions from oil and gas infrastructure. Despite this progress, few measurements have been made in other parts of the world, leaving emissions from roughly three quarters of global oil and gas production unconstrained by actual measurements.
Mexico was the 11th largest oil producer in the world in 2019, with an average oil production of 1.7 million barrels per day (MMbbl d−1) and an average gas production (mainly associated gas) of 4.9 billion cubic feet per day (Bcf d−1) [20]. Roughly 80% of oil production and 60% of gas production is from offshore shallow water wells. While recent energy reforms opened the market to international oil and gas operators, PEMEX—Mexico's national oil company—remains the major producer with >95% of production [20]. During the past decade, the country has experienced a significant decline in oil and gas production: between 2010 and 2019 oil production decreased by 35% and gas production decreased by 31% (see SM1).
Mexico reported 2015 CH4 emissions of 760 Gg yr−1 for the oil and gas sector in 2018 to the United Nations Framework Convention on Climate Change (UNFCCC) as part of the 6th National Communication [21]. This represents a loss rate of roughly 2.6% (CH4 emissions divided by gross natural gas production). Oil and gas emissions accounted for 15% of total national CH4 emissions in 2015, with enteric fermentation being the largest source at 38%. There has been significant variability in official oil and gas CH4 emission estimates over the last decade: Mexico's 5th National Communication to UNFCCC (2010 emissions, submitted 2012) reported 3600 Gg CH4 yr−1 [22]—almost five times higher than the current inventory and equivalent to a loss rate of 11%. Similarly, the national GHG emissions inventory for 2014 (published in 2016) reported 500 Gg CH4 yr−1 [23]—34% lower than the 2015 inventory. This discrepancy in estimates is a consequence of methodological changes in the estimation of emissions: from simple IPCC (i.e. Tier 1) emission factors [24], to refinements based on more specific emissions factors generated for other regions of the world and applied to the Mexican context [21, 25]. In all cases the updates were not based on direct measurements of CH4 emissions within the country.
In 2018, Mexico published an ambitious set of federal regulations targeting CH4 emission reductions across its oil and gas supply chain [26, 27]. These regulations become the basis for Mexico's inclusion of CH4 emission mitigation as part of its Nationally Determined Contributions submitted as required by the Paris Climate Accord under the UNFCCC [28] as well as the Mexico–Canada–US trilateral agreement to reduce oil and gas CH4 emissions by 40%–45% by 2025 [6]. As evidenced by the large shifts in recent emission inventory estimates for the Mexican oil and gas supply chain, assessing the current level of necessary reductions, identifying key sources/regions where mitigation should happen, and understanding if such reductions are actually taking place, requires empirically based estimates if such determinations are to have integrity.
2. Methods
In this work, we present airborne-based measurements used to estimate CH4 emissions from major offshore and onshore production basins in Mexico. These measurements were carried out at both regional and facility scale. We compare our empirical estimates of emissions to spatially resolved inventories in order to identify the key drivers of any discrepancies. We also quantify emissions for the onshore region using satellite data, allowing us to independently assess the representativeness of our temporally discrete airborne sampling with respect to annualized emission rates.
2.1. Sampling regions, sampling strategy
We focused on the Sureste basin, which is responsible for the majority of the production in the country (96% of oil production and 78% of gas production) (see figure SM4, which is available online at stacks.iop.org/ERL/16/024019/mmedia). We selected a 17 000 km2 offshore study region accounting for roughly 67% of national oil production and 46% of natural gas production (80% and 76% of national offshore oil and gas production, respectively) in 2018. We also selected an 8300 km2 onshore study region that accounted for 9.4% of national oil production and 11% of national gas production (55% and 27% of national onshore oil and gas production, respectively) in 2018 (figure 1).
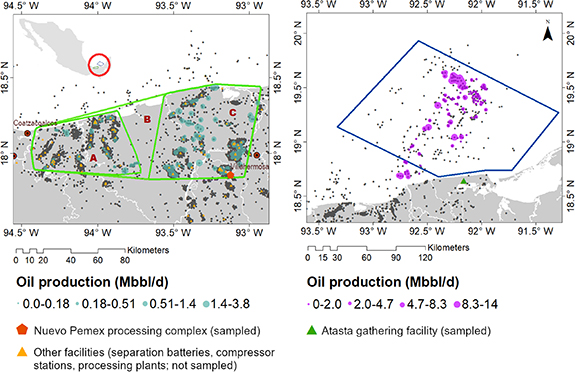
Figure 1. Maps illustrating location of study regions. (Left) Onshore study region (green lines), sampling took place over the states of Veracruz, Tabasco, and Chiapas (between the cities of Coatzacoalcos in Veracruz and Villahermosa in Tabasco, denoted by dark red circles). The aircraft sampled sub-regions A and C on different days (sub-region B was not sampled by the aircraft). (Right) Offshore study region (blue line): the sampling took place off the coast of Campeche. Dark grey dots represent all production wells in the study regions (active and inactive), with concentric purple and light blue circles illustrating oil production volumes in thousand barrels per day (Mbbl d−1) (note different scale between panels). The green triangle indicates sampled gathering facility (Atasta) and the orange pentagon indicates sampled gas processing complex (Nuevo Pemex). We show additional oil and gas facilities in yellow.
Download figure:
Standard image High-resolution image2.2. Airborne-based measurements
Regional and facility-level emission estimates were based on a set of flights conducted from 4 February to 18 February 2018. Measurement platform, emission quantification, and uncertainty estimation have been previously described in detail [29] and several studies have used this approach to estimate oil and gas emissions [14, 15, 18, 30–32] (see SM2). Our aircraft measured mixing ratios of CH4, carbon dioxide, carbon monoxide, and water vapor at a frequency of 0.33–0.50 Hz. We also measured wind speed and direction, GPS location, ambient temperature, and pressure.
For the offshore study region our regional flux estimation is based on the mass balance approach that has been successfully used to quantify emissions from both onshore [31–33] and offshore [18] oil and gas regions.
For the onshore study region and for the facility-level estimates, the aircraft flies a series of concentric horizontal loops at different altitudes around the facility or region of interest. The flights start at an altitude of roughly 150 m and keep ascending until the aircraft is above the plume as indicated by the measurement instrument in real-time. We then used Gauss's Theorem to estimate the horizontal flux for each loop and a total emission rate by incorporating a mass trend [29].
2.3. Satellite-based quantification
The TROPOspheric Monitoring Instrument (TROPOMI) provides observations of atmospheric CH4 at an unprecedented combination of moderately high spatial resolution (7 km × 7 km at nadir, 7 km × 5.5 km at nadir starting August 2019) and daily global coverage [34]. These observations enable us to detect and quantify emission sources of CH4 [19, 35–37]. Here we estimated regional CH4 emissions from the onshore study region (figure 1), thus providing an independent estimate that can be compared to the airborne-based quantification. The offshore region is excluded from the TROPOMI characterization because of the absence of column CH4 data retrievals over the sea (i.e. sun glint CH4 retrieval data over oceans was not available at the time of this study).
We used 24 months of column-averaged dry air mole fractions of CH4 (XCH4) observations from TROPOMI—December 2017 through November 2019 (figure SM20). We used a fast data-driven mass-balance method as described in Buchwitz et al [38], to quantify CH4 emissions over the onshore study region (see SM3).
We also supported our characterization of emissions from the study regions with estimation of flaring activity based on nighttime observations from the visible infrared imaging radiometer suite (VIIRS) instrument onboard the Suomi National Polar-Orbiting Partnership satellite [39] (see SM4).
2.4. Spatial allocation of oil and gas emissions from national GHG inventory
One of the challenges of characterizing CH4 emissions from Mexican oil and gas infrastructure is the acknowledged lack of spatial resolution of the national GHG emissions inventory, and the limited specificity with respect to infrastructure type [21]. All federal industries operating in Mexico are required to submit the Cédulas de operación anual (COA): facility-level annual report of emissions. We used the spatially explicit information from the COA to provide inventory-based estimates of GHG emissions for the study regions (see SM5).
3. Results
3.1. Offshore emissions
Figures SM5 and SM6 show the six flights where we targeted the offshore region. We summarize results from each flight in table 1 (see additional details from each flight in SM2). During the first four flights (4–7 February) the flight area was significantly restricted by air traffic control, allowing us to perform downwind legs 105–130 km away from main producing platforms (figure SM5). For the final two flights (16 February 2018) we were granted permission by air traffic control to enter restricted airspace and get closer to the offshore study region.
Table 1. Summary of airborne-based emission estimates for the offshore study region. For each flight, we show estimated emissions (with 95% confidence interval), number of transects, mean wind direction and wind speed. We show the six estimated downwind fluxes, the three upwind fluxes and the net flux which represents our central estimate for the offshore study region.
| Date | Estimated emissions (kg CH4 h−1) | Number of flight transects | Mean wind direction, wind speed (m s−1) | Distance from downwind transects to main producing platforms (km) |
|---|---|---|---|---|
| Downwind fluxes | ||||
| 4 February 2018 | 1100 (550–1700) | 4 | ESE, 3.1 | 110 |
| 5 February 2018 | 3000 (1800–4200) | 2 | E, 6.0 | 105 |
| 6 February 2018 | 4400 (3400–5400) | 4 | ESE, 10 | 105 |
| 7 February 2018 | 5000 (2300–7700) | 2 | E, 8.3 | 130 |
| 16 February 2018 | 4400 (3200–5600) | 3 | ESE, 7.9 | 45 |
| 18 February 2018 | 4300 (3000–5600) | 3 | E, 7.9 | 50 and <1 a |
| Mean downwind flux | 3700 (2700–4700) | |||
| Upwind fluxes | ||||
| 4 February 2018 | 1000 (140–1900) | 2 | ESE, 2.8 | — |
| 16 February 2018 | 1100 (710–1500) | 1 | ESE, 7.5 | — |
| 18 February 2018 | 690 (400–980) | 2 | ESE, 7.1 | — |
| Mean upwind flux | 930 (730–1100) | |||
| Central estimate offshore study region | 2800 (1700–3900) | |||
a On 18 February we were able to perform two sets of downwind transects at different distances from the sources (<1 km and ∼50 km away from main producing platforms, respectively) (see figure SM6)—this allowed us to further characterize the emissions within the offshore study region.
To account for the influence of upwind sources [18, 32, 33], we estimate the net flux for the offshore study region by subtracting the upwind flux from the downwind flux. For both the upwind and downwind fluxes we used the lateral edges of the plume as background. We completed upwind transects on three flight days (4, 16, 18 February) with a mean flux of 930 kg CH4 h−1 (95% confidence interval (CI): 730–1100 kg CH4 h−1) which we subtract from the mean downwind flux from the six flights, 3700 kg CH4 h−1 (95% CI: 2700–4700 kg CH4 h−1).
Our central estimate for the offshore region is 2800 kg CH4 h−1 (95% CI: 1700–3900 kg CH4 h−1). This estimate is more than an order of magnitude lower than the national GHG emissions inventory estimate of 58 000 kg CH4 h−1, or five times lower than the PEMEX reported 2018 estimate of 15 000 kg CH4 h−1. For comparing our measurements with the national inventory and PEMEX reported numbers, we used the spatially explicit data from the COA to attribute 79% of national CH4 emissions from oil and gas to the offshore study region. In the case of the national inventory estimate, we scaled from 2015 to 2018 by considering the 16% decrease in oil production and 12% decrease in gas production in the offshore study region [20].
Our estimate can also be compared to 18 000 kg CH4 h−1 from EDGAR v5.o [40] and 27 000 kg CH4 h−1 from the gridded inventory developed by Scarpelli et al [41]. In both cases we also adjusted emissions to account for decrease in production from 2015 to 2018. Our empirical estimate is 5 to >10 times lower than available bottom-up estimates and official inventories.
The high level of integration of Mexican offshore production could be a plausible explanation for the relatively low emissions from the offshore study region. Production is concentrated in a small number of platforms that have staff onsite 24/7. These operational conditions allow a high degree of attention, control of processes, and prevention of leaks. Additional airborne-based, site-level measurements would provide a more granular characterization of emissions and sources from the offshore platforms [18].
Based on the information in the COA, roughly 70% of CH4 emissions in the offshore study region are related to flaring, with the other 30% classified as venting. The PEMEX emissions report as well as the national GHG emissions inventory mention in their methodology the use of a combustion efficiency of 84% to estimate CH4 emissions due to incomplete combustion from flaring [21, 25, 42]. This combustion efficiency factor is based on Chambers et al [43] field study of six flares in Alberta, Canada, where efficiencies ranged 55%–98%.
Using VIIRS nighttime flared data, we estimate 150 MMcf d−1 of flared gas from the offshore study region for February 2018. This volume of flared gas is not significantly different from the average flared gas volume of 130 MMcf d−1 for the period of 2018–2019 (see figure 2 and SM4).

Figure 2. Characterization of flaring emissions from the study regions based on VIIRS nighttime flare data. (Top-left) Monthly trend in flared gas volume (MMcf d−1) (2018–2019) for the offshore study region. (Top-middle) Spatial distribution of gas flaring radiant heat (in MW) for offshore study region (0.1° × 0.1° grid resolution). (Top-right) Satellite imagery (Sentinel-2 visible imagery) over one of the offshore platforms with flaring activity during the sampling period. (Bottom-left) Monthly trend in flared gas volume (MMcf d−1) (2018–2019) for the onshore study region. The different lines show total for the region (ABC), total for the A, C sub-regions (including the Nuevo Pemex and Cactus facilities), and individual estimates for Nuevo Pemex and Cactus. (Bottom-middle) Spatial distribution of gas flaring radiant heat (in MW) for onshore study regions. We only show the grid cells with >50 observations per year. Note the two gas flaring hotspots in the southeast corner of sub-region C, which correspond to the Cactus and Nuevo Pemex (highest gas flaring radiant heat in the map) processing complexes. The aircraft sampled sub-regions A and C on different days (sub region B was not sampled by the aircraft). (Bottom-right) Satellite imagery (Map data: Google, CNES/ Airbus) for the Nuevo Pemex processing complex.
Download figure:
Standard image High-resolution imageOur VIIRS-based flared volume estimate for the offshore study region is 2× what was reported by CNH (National Hydrocarbons Commission) for February 2018 (75 MMcf d−1) and 55% higher than the average for 2018–2019 (84 MMcf d−1) [44].
From the map in figure 2 we also see that the majority of flaring is related to a small number of platforms—which also corresponds to the region where our downwind transects from the airborne-base measurements showed the highest enhancement in CH4 concentrations (see figure SM6).
If we assume a flaring combustion efficiency of 96%–98% (for an average CH4 content of 48% for the offshore study region [45]), total emissions from flaring within the offshore study region are 1100–2200 kg CH4 h−1 based on VIIRS flaring data (see SM4). This estimate confirms that a large fraction of the emissions in the offshore study region are indeed related to flaring and that the expected flaring efficiency for the offshore region is likely higher than the one used in the inventories—unmasking one of the major factors contributing to the overestimation in Mexican offshore emissions. Due to the limited empirical data available on incomplete combustion emissions in Mexico and around the world, targeted sampling (i.e. airborne-based measurements) to specifically characterize emissions from flares is a key next step [46, 47].
3.2. Onshore emissions: facility-level emission estimates
We estimate emissions from two different onshore midstream facilities: Atasta gathering facility in Campeche and Nuevo Pemex gas processing complex in Tabasco (see SM2 for additional details). These two facilities are relevant to our study because they collect and process a significant fraction of the associated gas produced in the offshore region. The Atasta gathering facility collects gas from offshore production platforms, compresses the gas and discharges it into a first gas processing complex: Ciudad Pemex in Tabasco (not measured in this work), from here the gas flows into Nuevo Pemex gas processing complex. In addition to processing associated gas from offshore production, Nuevo Pemex also receives associated gas from onshore production regions via the Cactus processing complex (see figure SM15).
Total measured emissions from Atasta (measured in 10 February 2018) are 370 kg CH4 h−1 (95% CI: 220–520 kg CH4 h−1) (based on the aircraft completing 30 concentric laps around the facility) (table 2). Our empirical estimate is >80 times higher than the 4.2 kg CH4 h−1 reported to the COA (adjusted for 2018), and five times higher than the measurement-based central estimate of emissions from US gathering and compression stations (64 kg CH4 h−1) [48, 49].
Table 2. Summary of airborne-based emission estimates for the onshore study region. For each flight, we show total estimated emissions from all sources (with 95% confidence interval), number of laps, mean wind direction and wind speed. Table summarizes regional-level estimates as well as facility-level estimates.
| Sub-region or facility, sampling date | Total emissions (kg CH4 h−1) | Number of flight laps | Mean wind direction, wind speed (m s−1) |
|---|---|---|---|
| Sub-region A: 15 February 2018 | 25 000 (18 000–32 000) | 4 | N, 5.2 |
| Sub-region C -: 14 February 2018 (excluding Nuevo Pemex processing plant) | 6700 (−700–14 000) | 4 | ENE, 5.9 |
| Nuevo Pemex processing plant: 14–15 February 2018 | Excluding flare: 1600 (820–2400) | 16 | E, 7.2 |
| With flare: 5700 (3500–7900) | 15 | ESE, 5.1 | |
| Total estimate ABC a | 37 000 (27 000–47 000) | ||
| Atasta compressor station: 10 February 2018 | 370 (220–520) | 30 | SE, 6.6 |
a Note that we did not sample the small wedge (B) (see figure 1). Sub region B has zero active wells, thus emissions are not expected to be significant. Also note that the Nuevo Pemex processing plant on the periphery of sub region C is estimated separately as an individual point-source, and excluded from the regional-level quantification of sub region C.
We measured emissions from Nuevo Pemex over two consecutive days (14–15 February, 2018). During the first day we excluded the flare pits at the south end of the facility, and on the second day we sampled the entire facility (see figure SM17). The difference in the flux estimates from these two consecutive days allowed us to estimate what fraction of emissions is attributed to flaring.
We estimate 1600 kg CH4 h−1 (95% CI: 820–2400 kg CH4 h−1) (based on the aircraft competing 16 concentric laps around the facility) from the first day (excluding flares). Once we included the flares on the second day, total measured emissions are 5700 kg CH4 h−1 (95% CI: 3500–7900 kg CH4 h−1) (based on the aircraft competing 15 concentric laps around the facility). Thus, 72% of emissions (4100 kg CH4 h−1) from this facility are attributed to gas flaring. Our empirical estimate is roughly 300 times higher than the 20 kg CH4 h−1 reported in the COA (adjusted for 2018). This estimate is also 30 times higher than the measurement-based central estimate of emissions from US processing plants (200 kg CH4 h−1) [48, 49].
Based on the flight data from 15 February we estimate a combustion efficiency from Nuevo Pemex flares based on the approach described in Gvakharia et al [46] and Caulton et al [47]. We integrated peaks from transects where the R2 between CH4 and CO2 is ⩾0.8. We used data from the Mexican Petroleum Institute to estimate gas composition of gas before combustion (CH4 content of 65% (volume) and carbon fraction of CH4 in the total fuel gas before combustion of 0.53 for this facility) [25]. These data suggest a flaring combustion efficiency of ∼94%. The significant amount of gas flared from this facility indicates a substantial waste of gas, enough to cover half the natural gas consumption for the national residential sector during 2018. In addition, improving the efficiency of the flares to ∼98% would cut total emissions from the facility roughly in half.
Based on the VIIRS nighttime flare data, we estimate 45 MMcf d−1 of gas was flared at the Nuevo Pemex facility in February 2018 (average for 2018–2019 is 44 MMcf d−1)—indicating that this facility remained a high flaring hotspot past the temporally discrete airborne-based measurements (figure 2 and SM4). Even at the low end price of $2/Mcf, this amounts to a potential revenue loss of roughly 30 million USD per year.
These results highlight the importance of inefficient flaring as a key source of emissions that should be included in monitoring programs (i.e. a comprehensive leak detection and repair program) as well as technical standards supporting regulatory action.
3.3. Onshore emissions: regional-level emission estimates
Total estimated emissions from the combined region based on the flight data are 37 000 kg CH4 h−1 (95% CI: 27 000–47 000 kg CH4 h−1), which includes emissions from Nuevo Pemex (see table 2). We estimate a total of 7100 kg CH4 h−1 from anthropogenic non-oil and gas sources based on the national GHG inventory [21, 41] (see SM6) as well as 140 kg CH4 h−1 (95% CI: 110–170 kg CH4 h−1) from wetlands and 500 kg CH4 h−1 from geologic seeps, yielding 29 000 kg CH4 h−1 (95% CI: 19 000–39 000 kg CH4 h−1) from oil and gas production and processing. Using EDGAR v5.0 [40] instead of the national GHG emissions inventory for the attribution of oil and gas emissions results in a very similar estimate, with total oil and gas emissions ∼5% higher, well within the uncertainty of the analysis (See SM7 for more details about the emissions from the two onshore sub-regions).
Our central estimate of emissions from the onshore study region is more than an order of magnitude higher than the 2018 national GHG emissions inventory estimate of 1900 kg CH4 h−1, or ∼40 times higher than the 750 kg CH4 h−1 reported by the operator. For both inventory-based estimates we used the spatially explicit data from the COA to derive that 4.0% of total national CH4 emissions from oil and gas should be attributed to the onshore study region. For the national inventory-based estimate, we reduced the 2015 emissions proportional to the 40% and 30% decrease in oil and gas production in the study region in 2018.
Our estimate of emissions from the onshore region is also significantly higher than the 13 000 kg CH4 h−1 derived from Scarpelli et al [41] and the 20 000 kg CH4 h−1 from EDGAR v 5.0 [40], when they are similarly adjusted to account for the production decline from 2015 to 2018.
Based on the VIIRS data we estimate 140 MMcf d−1 of gas was flared in February 2018 (compared to an average of 130 MMcf d−1 for the period of 2018–2019) in the onshore study region. There are two flaring hotspots in sub-region C—see figure 2. The largest corresponds to the location of the Nuevo Pemex gas processing complex, flare pits south of the facility. The second largest flaring hotspot corresponds to Cactus—another gas processing complex that we did not sample with the aircraft. The two gas processing complexes are responsible for almost half of the flaring for the onshore study region based on the VIIRS data. Conversely, flaring in sub-region A appears to be spatially diffuse.
3.4. TROPOMI-based quantification of onshore emissions
Based on the TROPOMI satellite data we estimate an average emission rate of 57 000 kg CH4 h−1 (95% CI: 29 000–86 000 kg CH4 h−1) for the 2 year-period of December 2017 through November 2019 for the onshore study region (figure SM20;  6.5 ppb (95% CI: 3.7–9.3 ppb) and ECMWF wind field data, V = 2.5 m s−1 (95% CI: 1.7–3.3 m s−1); see SM3).
The TROPOMI-based estimate of total CH4 is broadly comparable with the GOSAT XCH4 inversion-based estimate of 36 000 kg CH4 h−1 (range of inversion ensemble 24 000–50 000 kg CH4 h−1) for 2010–2015 from Maasakkers et al [50], even though the two time periods are different and there are likely differences in sampling between the two satellite datasets.
Using the same attribution approach of non-oil and gas emissions as previously described for the airborne-based estimates as well as the production decline between 2015 and 2018–2019 (see SM6), the TROPOMI data suggest total oil and gas emissions in the onshore study region in 2018–2019 of 49 000 kg CH4 h−1 (95% CI: 20 000–78 000 kg CH4 h−1). This compares to 29 000 kg CH4 h−1 (95% CI: 19 000–39 000 kg CH4 h−1) from the airborne-based quantification.
The comparison of the aircraft and satellite-based estimates suggest that the aircraft-based estimation might be a lower bound, reflecting the small number of observations. While the mass balance method used to estimate emissions from TROPOMI data is associated with larger uncertainty, the satellite-based approach does include a temporally robust record, which would integrate variation more effectively than the snap shot provided by the aircraft-based measurements.
Applying an inverse modelling approach using the TROPOMI data would reduce uncertainty in the emissions estimate and provide additional information about the spatial distribution of emissions, as was demonstrated in a recent study involving full inverse analysis of TROPOMI data in the Permian Basin in the US [19].
4. Discussion
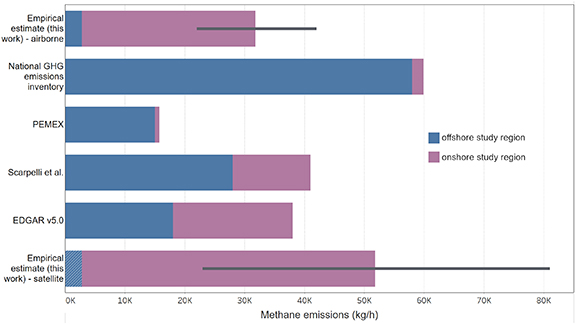
The results illustrate the scale of the overestimate of offshore CH4 emissions and underestimate of onshore emissions in our study regions as reported in the Mexican inventory (figure 3). Our results characterized 80% of offshore and 55% of onshore national oil production (76% of offshore and 27% of onshore national gas production). While our results do not address emissions from the remaining production regions—and empirical characterization of those emissions is a key next step—it is reasonable to expect similar patterns in emissions from those facilities as they are under management by the same operator and the infrastructure is very similar. If we use oil production, gas production and number of active wells as proxies to derive a first order estimate of national emissions based on our measurements, we estimate 320–940 kg CH4 h−1 from the non-measured offshore region and 19 000–140 000 kg CH4 h−1 from the non-measured onshore regions (see SM8). This estimate results in total oil and gas emissions of 51 000–170 000 kg CH4 h−1—compared to 70 000 kg CH4 h−1 from the national GHG inventory scaled for 2018. It is possible that total CH4 emissions from oil and gas in Mexico are higher than the national GHG inventory despite offshore emissions being significantly overestimated.
Figure 3. Summary of 2018 emissions estimates for the onshore and offshore study regions. The bar chart shows the relative contribution from the offshore (blue), onshore (purple) study regions from the different inventories as well as our empirical estimates based on the airborne and satellite-based measurements. Bars representing our empirical estimates include 95% confidence interval error bars. For the bar representing emissions from the satellite-based measurements, offshore region is based on airborne-based estimate (shown with diagonal lines). In addition to the estimate from the national GHG emissions inventory [21] and the emissions reported by the operator (PEMEX sustainability report [42]), we also show emissions from the Scarpelli et al [41] and EDGAR v5.0 [40] gridded inventories. For all inventories we show emissions allocated to the study regions, and we adjusted estimates to account for the production decline from 2015 to 2018.
Download figure:
Standard image High-resolution image
Our work highlights the limitations of making emission estimates based on emission factors developed in geographies other than the one of interest (i.e. Tier 1, IPCC), pointing to the importance of collecting empirical data to more accurately estimate emissions and in turn guide effective emission reductions. In the case of Mexico, it shows that while most production still happens offshore (and emission reductions are still desirable and possible), by far most of the CH4 emissions are occurring at onshore facilities contrary to what any of the emission inventories suggest. Improvement of inventories based on empirical data collected within the region of interest is critical to tracking progress in meeting commitments to emissions reductions, such as those taken by Mexico.
We show that the large overestimation in offshore emissions is likely driven by the large contribution of flaring to the emissions, and inventories that assume a relatively low combustion efficiency (∼80%). Zhang et al [51] used multipollutant satellite data to track flaring activity in offshore Mexico for >10 years, showing how the introduction of flaring reduction policies led to reduced offshore flaring after 2008.
This reduction in offshore flaring was possible as a result of increased pipeline infrastructure to transport associated gas onshore for processing. Our results suggest that a significant fraction of the offshore associated gas is now being flared in onshore midstream facilities, versus the older practice of flaring it directly at the offshore facilities. Remarkably, the total emissions we estimate for the Nuevo Pemex gas processing complex—which is processing offshore gas—are higher than all of the emissions that occur offshore. While offshore flaring was reduced in the 2000's it seems unlikely that the relative rate of CH4 emissions concomitantly decreased, rather the location of those emissions has shifted.
Additional work is needed to characterize CH4 emission patterns at a more granular scale in the onshore study region [13, 52, 53]. In addition to the CH4 emissions associated with high flaring volumes from several point sources that were observed, there are most likely other key contributors to emissions. Previous work has found that super-emitters related to the presence of abnormal process conditions (e.g. malfunctions) are a major cause of high emissions in other onshore regions in North America. Ground-based measurements that characterize the emissions distributions of sites and facilities in the different onshore production regions can be expected to shed light into whether similar patterns of site level emissions are found among Mexican infrastructure [15, 52, 54].
There are environmental and health impacts of air pollution from oil and gas operations, in addition to the climate implications of CH4. Several studies have examined the impacts of emissions of ozone precursors and air toxics that are co-emitted by oil and gas infrastructure [55–58]. The presence of communities in proximity to Mexican onshore production regions raises health concerns about the potential effects of high emissions, and underscores the need to reduce them. For example, a recent study in the US suggested that frequent exposure to flaring was associated with increased risk of preterm births [59]. The Nuevo Pemex facility is less than 5 km away from the city of Reforma, Chiapas, and roughly 25 km away from Villahermosa, Tabasco. The large volume of flared gas with relatively low combustion efficiency can be a source of volatile organic compounds, polycyclic aromatic hydrocarbons, carbon monoxide, nitrogen oxides, sulfur oxides, and soot, in addition to the CH4 emissions measured as part of this study [46, 60, 61].
5. Conclusion
Mexico is at a crossroads in terms of an energy transition and increased energy efficiency: the federal government has clearly signaled a prioritization of energy security through increased national production and decreased reliance on imported fuels [62]. However, between 2015 and 2018 the decrease in gas production in Mexico has been accompanied by a >50% increase in natural gas imports. In addition to the climate benefits of CH4 mitigation of oil and gas supply chain emissions, an effective strategy to reduce emissions could yield a significant reduction in wasted gas, thus meeting a higher proportion of the nation's demand.
The Mexican federal CH4 regulations provide a framework in which such emissions reductions can happen. Our work highlights the role of empirical estimates in the design, implementation, and tracking of efficient mitigation policies and indirectly the social benefits of doing so.
Acknowledgments
Data collection and analysis was funded under the Climate and Clean Air Coalition (CCAC) Oil and Gas Methane Science Studies, hosted by the United Nations Environment Programme. Funding was provided by the Environmental Defense Fund, Oil and Gas Climate Initiative, European Commission, and CCAC. Further sampling, analysis and writing was supported by Catena foundation. Information on the Cedula de operación Anual (COA) provided by the Dirección de Gestión de Calidad del Aire y Registro de Emisiones y Transferencia de Contaminantes (DGCARETC) of the Secretaría del Medio Ambiente y Recursos Naturales (SEMARNAT) was gratefully acknowledged. Authors would like to thank Adelina Gómez and the team at Universal Aviation for their logistical support for the airborne-based measurements. SP is supported through the GALES project (Grant No. 15597) by the Dutch Technology Foundation, which is part of the Netherlands Organisation for Scientific research (NWO). This research contains Copernicus Sentinel data 2017–2019. D.Z.-A., M.O., R.G., S.S., and S. P. H. were funded by the Robertson Foundation.
Data availability statement
Datasets used in this work are available from the authors upon request.