

Abstract
Given their historic emissions and economic capability, we analyze a leadership role for representative industrialized regions (EU, US, Japan, and Australia) in the global climate mitigation effort. Using the global integrated assessment model REMIND, we systematically compare region-specific mitigation strategies and challenges of reaching domestic net-zero carbon emissions in 2050. Embarking from different emission profiles and trends, we find that all of the regions have technological options and mitigation strategies to reach carbon neutrality by 2050. Regional characteristics are mostly related to different land availability, population density and population trends: While Japan is resource limited with respect to onshore wind and solar power and has constrained options for carbon dioxide removal (CDR), their declining population significantly decreases future energy demand. In contrast, Australia and the US benefit from abundant renewable resources, but face challenges to curb industry and transport emissions given increasing populations and high per-capita energy use. In the EU, lack of social acceptance or EU-wide cooperation might endanger the ongoing transition to a renewable-based power system. CDR technologies are necessary for all regions, as residual emissions cannot be fully avoided by 2050. For Australia and the US, in particular, CDR could reduce the required transition pace, depth and costs. At the same time, this creates the risk of a carbon lock-in, if decarbonization ambition is scaled down in anticipation of CDR technologies that fail to deliver. Our results suggest that industrialized economies can benefit from cooperation based on common themes and complementary strengths. This may include trade of electricity-based fuels and materials as well as the exchange of regional experience on technology scale-up and policy implementation.
Export citation and abstract BibTeX RIS

Original content from this work may be used under the terms of the Creative Commons Attribution 4.0 license. Any further distribution of this work must maintain attribution to the author(s) and the title of the work, journal citation and DOI.
1. Introduction
With the Paris Agreement, 195 signatory states commit to achieve the goal of limiting global warming to 1.5 °C–2 °C under the principle of 'common but differentiated responsibilities' (UNFCCC 201). This refers, in particular, to the responsibility of industrialized countries who reached economic prosperity and contributed significantly to historic emissions.
The total carbon budget for climate stabilization at 1.5 °C–2 °C is estimated to be 2900–3600 Gt CO2 of which 2300 Gt CO2 have already been emitted (IPCC. 2018). The US and the EU28 alone contributed more than a third of cumulative historic emissions (Suppl. Figure 1 available online at stacks.iop.org/ERL/15/114016/mmedia). Acknowledging that current generations benefit from a history of fossil-fueled development, the role of industrialized countries becomes even more significant. Dividing historic emissions by current population, the US, Canada, Australia, the EU, Russia and Japan stand out, while the rest of the world is responsible only for minor contributions on a per-capita basis (figure 1(a)).
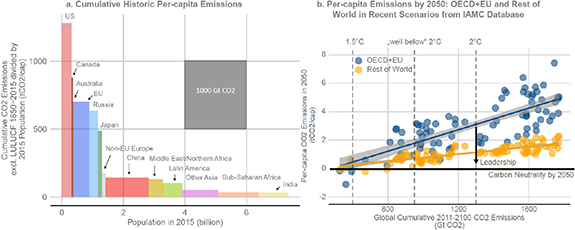
Figure 1. Left panel (a) World regions ordered by cumulative historic carbon emissions between 1850 and 2015 (excluding emissions from land-use change) divided by population (y-axis). The x-axes shows population in 2015. Historic emission data are from Gütschow et al (2016, 2017, 2019). Right panel (b) Per-capita net CO2 emissions by 2050 in EU + OECD countries (blue dots) and the Rest of World (yellow dots) against global cumulative 2010–2100 CO2 emissions in selected scenarios from the EMF33, CD-Links and ADVANCE integrated assessment modeling intercomparison projects (Huppmann et al 2018, for details on selected scenario see Suppl. S18). Global 2011–2100 CO2 budgets of 600/900/1300 Gt CO2 represent 1.5 °C/"well below" 2 °C/2 °C scenarios respectively (Table 2.2 in IPCC (2018), column for 67% probability, subtract about 100 Gt CO2 for end-of-century budget to account for Earth System feedbacks and add 290 GtCO2 for 2011–2018 emissions).
Download figure:
Standard image High-resolution imageLimiting global warming to 2 °C requires global carbon neutrality by 2070, while a 1.5 °C target requires global carbon neutrality by 2050 (IPCC, 2018). Global modeling scenarios usually apply uniform carbon pricing which leads to cost-optimal abatement across regions. However, under a 2 °C scenario, this approach still generates a significant gap in domestic per-capita emissions by 2050 between industrialized countries and the rest of the world (figure 1(b)). In the absence of burden-sharing mechanisms, this conflicts with standards of global equity as convergence of domestic per-capita emissions is postponed. Carbon neutrality by 2050 can serve as a sensible focal point for industrialized economies in the Paris context of 1.5 °C–2 °C stabilization that is aware of global disparities.
Our study explicitly investigates mitigation strategies and challenges to reach domestic net-zero CO2 emissions by 2050 in four representative industrialized economies: Australia, the US, Japan and the EU28. Industrialized economies take leadership roles abating emissions earlier and deeper by mid-century compared to both (i) the rest of the world and (ii) their emissions trajectories in uniform carbon pricing scenarios (figure 1(b)).
On the federal level, current climate policy signals towards 2050 targets differ across the four industrialized economies. As of July 2020, the EU, Japan and the US have submitted Midcentury-Strategies (MCS) to the UNFCCC to outline their mitigation ambition towards 2050 in respect of the Paris long-term goals. Driven by recently proposed European Green Deal, the European MCS aims at net-zero greenhouse gas (GHG) emissions by 2050 (EU Commission 2018, EU UNFCCC submission, 2020). Japan has been more cautious about its long-term commitments given its history of energy import dependence and the Fukushima accident. The Japanese Government (2019) submitted an MCS with a 2050 target of 80% GHG reductions, albeit without specifying a base year. On the federal level, Australia and the US lack ambitious climate policies or long-term targets (Climate Action Tracker 2019) and Australia has not submitted a MCS so far. The US MCS by the Obama Administration considered pathways for an 80% GHG reduction to (The White House 2016), yet the current government plans to withdraw from the Paris Agreement completely.
Despite mixed signals from the governments in office, we observe that the national and state-level climate policy discourse in the industrialized economies increasingly leans towards the idea of a net-zero CO2 or even net-zero GHG emissions target by 2050. The latter is more ambitious, yet the distinction between CO2 and GHG targets is in the policy discourse not always clear. All Australian states have a net-zero (CO2 or GHG) target by 2050 or earlier and the recent unprecedented scale of bushfires has raised public awareness about climate change (Hope, 2020; Mazengarb, 2020). In the US, parts of the Democratic Party proposed the Green New Deal, an ambitious climate policy program with a net-zero GHG target for 2050 (Ocasio-Cortez, 2019). Several states including California declared the intention to go net-zero (CO2 or GHG) by midcentury (Podesta et al 2019). In Japan, too, a number of subnational actors, including the Tokyo Metropolitan government, proclaim net-zero CO2 targets for 2050 (MOE Japan, 2020; Tokyo Metropolitan Government 2019). Although current mitigation efforts of industrialized economies are insufficient to reach Paris-compatible long-term goals (den Elzen et al 2019; Rogelj et al 2016), carbon or GHG neutrality by 2050 has become a focal point for ambitious national actors.
For our analysis, we focus on domestic carbon neutrality in 2050 for four selected regions that represent a range of industrialized economies. With respect to the differing characteristics (e.g. land availability and energy demand profile), we ask how their transformation pathways compare. We focus on the energy system and do not analyze abatement of non-CO2 GHGs such as CH4 and N2O in agriculture and industry. Specifically, we carve out regional mitigation strategies and challenges across three dimensions of a net-zero transformation: electricity decarbonization, energy demand-side decarbonization and carbon dioxide removal (CDR) options. While electricity decarbonization is the key-step of the supply-side transformation, it needs to be complemented by a demand-side transformation across sectors (buildings, industry, transport). Finally, CDR options can serve to compensate for any residual carbon emissions.
There is a myriad of national modeling studies to analyze economy-wide mitigation pathways up to 2050 in one of the four regions and we only mention a few here. For Australia, ClimateWorks et al (2014) provide an illustrative scenario for net-zero GHG emissions in Australia by 2050, analyzing detailed sectoral transitions and CDR options with a suite of harmonized modeling tools and bottom-up assessments. In addition to the MCS study, Lempert et al (2019) present 80% GHG reduction pathways to 2050 for the US economy based on the GCAM-USA model. Moreover, there are several bottom-up energy system studies with a focus on renewable electricity (e.g. Jacobson et al 2015, Steinberg et al 2017). A rich national literature on integrated assessment exists for Japan (e.g. Oshiro et al 2018, 2019, Kato and Kurosawa 2019, Sugiyama et al 2019). They find significant challenges for reaching net-zero carbon by 2050 (Oshiro et al 2018) and highlight the importance of industry (relative to transport) decarbonization in Japan (Sugiyama et al 2019). Next to the MCS study (EU Commission 2018), there are further EU-focused integrated assessment analyses based on the PRIMES framework (Fragkos et al 2017, Vrontisi et al 2019). They come with significant technological detail and focus on the aggregate GDP cost of the transformation. Finally, the Deep Decarbonization Pathways Projects (DDPP) provides a comprehensive collection of national modeling studies (incl. US, Australia, Japan) under a harmonized framework (Bataille et al 2016).
This study takes a different perspective by providing a cross-regional comparison of transformation pathways for net-zero CO2 using a global integrated assessment model (IAM). It has the advantage of treating all regions within one consistent modeling framework, yet it cannot provide the regional detail of dedicated national models. Previous IAM studies focus on a broader set of regions and investigate scenarios with a globally harmonized carbon price (Van Sluisveld et al 2013, Tavoni et al Tavoni, 2015, Marcucci and Fragkos 2015, van Soest et al 2017). Here, we concentrate on four regions and analyze scenarios with domestic regional net-zero carbon targets for 2050, which are not globally cost-optimal yet more meaningful to national and international policy debates. A challenge to our single-model study is that IAMs can have different approaches to represent the complex energy-economy dynamics and are subject to structural uncertainty. This is why the IAM literature usually conducts multi-model studies to increase the robustness of model results. Notwithstanding, we see our single-model perspective as an opportunity to discuss and explain our results in detail and provide a deeper insight into the underlying mechanisms, which would be more difficult to disentangle from methodological differences in a multi-model picture. After presenting scenarios and modeling framework (section 2), we provide an overview of the regional pathways (section 3.1). We then dive into cross-regional comparisons of electricity decarbonization (section 3.2), energy demand-side decarbonization (section 3.3) and CDR options (section 3.4) and summarize our conclusions (section 4).
Table 1. Overview of scenarios analyzed in our study.
| Scenario | Climate target | Regional sensitivities (applied to Australia, US, EU, Japan) |
|---|---|---|
| Current Policies (Reference Scenario) |
|
|
| Net-zero (standard full-option) |
|
|
| Net-zero Nuc. out |
| |
| Net-zero Nuc. out + low VRE Pot. |
| |
| Net-zero No Land-Use CDR |
| |
| Net-zero No Land-Use + CCS CDR 15% |
|
2. Methods
We analyze scenarios using the IAM framework REMIND that models pathways of a coupled energy-economy system subject to climate targets (Luderer et al 2015, Kriegler et al 2017). We use a regionally-adapted version of REMIND 2.1.2 (Luderer et al 2020) with 13 world regions, among them, the European Union, and six individual countries (China, India, Japan, United States of America, Russia and Australia). Each region optimizes intertemporal welfare based on a Ramsey-type macro-economic growth model and is subject to a budget constraint including consumption, capital investment, primary energy trade and energy system cost. REMIND brings together the capacities of bottom-up and top-down approaches by linking the macroeconomic production function to a technology-rich energy system model (see Suppl. S2 for details on the model).
We analyze a suite of scenarios with a net-zero CO2 emissions target for the EU, Australia, Japan and the US and a common carbon price for the remaining regions (table ). The model adjusts regional carbon prices iteratively until the regional and global emission targets are met (Suppl. S3). The carbon price of the industrialized economies is determined by the 2050 net-zero target, while for the remaining regions it is determined such that a 2011–2100 global carbon budget of 1300 GtCO2 is respected. To contrast regional properties and dependences of net-zero pathways, we run a number of sensitivity scenarios on electricity technology and CDR deployment.
3. Results and discussion
3.1. Overview
To summarize similarities and differences of our net-zero scenario across the four industrialized economies, figure 2 provides an overview of current emissions and the respective pathways to carbon neutrality by 2050. It shows an emission decomposition across sectors (emissions bars, figure 2(b)) and abatement contributions between the reference scenario (Current Policies) and the Net-zero scenario of different mitigation strategies (colored areas between thick and dashed line, figure 2(a)).
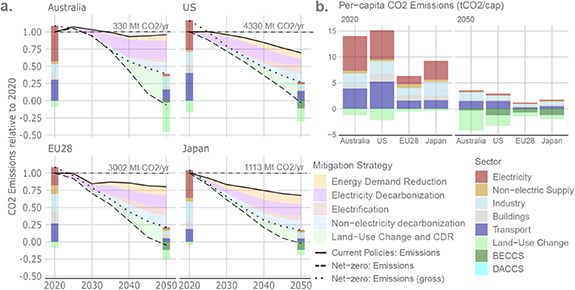
Figure 2. Overview of net-zero decarbonization pathways for the four industrialized economies in REMIND. Left panel (a) Net CO2 Emissions relative to (modeled) 2020 levels in reference (Current Policies) scenario (black line) and the Net-zero scenario (dashed line). The dotted line represents gross emissions in the Net-zero scenario. Bars show the sectoral composition of CO2 emissions in 2020 and 2050 respectively. The emission abatement between the reference scenario and Net-zero scenario is attributed to different mitigation strategies (see Suppl. S17 for decomposition method). The reference 2020 emissions can be seen in absolute numbers above the vertical line of the 2020 level. Right panel (b) Per-capita CO2 emissions per sector in 2020 and 2050.
Download figure:
Standard image High-resolution imageWe find that all of the four regions have technological options and mitigation strategies to reach net-zero carbon emissions by 2050, although they embark from historically different emissions profiles and trends. The point of departure for the low-carbon transformation differs across the four regions mainly for two reasons.
First, regional characteristics such as population density, geography and historic developments in energy and industry infrastructure shape regional energy demand structures. Current per-capita CO2 emissions in Australia and the US are almost double the levels of the EU and Japan (figure 2(b)). The main reason is their high per-capita energy demand in the transport, industry, and (in the case of the US) buildings sector. The European and especially the Japanese economy have historically been less energy intensive (per unit of GDP) than the Australian and the US American economy and still are today (Suppl. Figure 4, Schandl and West 2012; Warr et al 2010). In Japan, this is the result of a history of energy dependence, limited resources and high energy prices (Steward 2009).
Second, the four regions are at different stages of a transition to low-carbon electricity (figure 3(a)). Australia still generates about 60% of its electricity from coal and started renewable expansion only recently (Ueckerdt et al 2019). The EU, in contrast, has experienced a partial shift from coal to gas and nuclear power in the late 20th century and, over the past two decades, a significant growth of renewables to about 30% of total electricity generation. The US cut its electricity emissions over the past years by rapidly replacing coal with gas power, while Japan's power sector is on an upward emissions trend since the Fukushima accident seeing nuclear power replaced by coal and gas (figure 3(a), Suppl. Figure 5).

Figure 3. Left panel (a) Electricity mix in 2020, 2030 and 2050 in Net-zero scenario (bars, left y-axis) and 15-year moving average cost of electricity (white dots, right y-axis). Right panel (b) Electricity mixes (bars) and cost of electricity (white dots) for 2050 across different scenarios: net-zero scenario with regional nuclear phase-out by 2040 (left), net-zero scenario with nuclear phase-out and limited wind and solar potentials (center) and Current Policies scenario (right).
Download figure:
Standard image High-resolution imageEmissions decrease across all regions in the Current Policies scenario and, most notably, in the US and Japan (figure 2(a)). This is driven mainly by the US phase-out of coal electricity (figure 3(a)) and declining populations in Japan (Suppl. Figure 13). Relative to the Current Policies scenario, electricity decarbonization in the Net-zero scenario contributes about one third of total gross abatement. Respective contributions are even larger in Australia due to its continued reliance on cheap coal electricity under Current Policies (figure 3(b)). Remaining gross reductions come from energy efficiency improvements, the increase of the electricity share in final energy (electrification) and non-electricity decarbonization. The latter includes a switch to low-carbon fuels (biofuels, hydrogen) on the demand-side and reducing emissions from district heating and refineries (non-electric supply emissions).
In the standard Net-zero scenario, residual emissions from the demand-side sectors (buildings, industry, transport) remain by 2050 and are compensated by CDR. Those emissions occur on site of energy use, such as from combustion in vehicle engines or industrial boilers excluding upstream emissions from energy production. We confirm earlier global modeling findings that it is cost-efficient to only partially decarbonize non-electric energy by 2050 and use CDR options for compensation (Bauer et al 2018, Luderer et al 2018, Strefler et al 2018, IPCC. 2018). However, we find that the optimal trade-off level between gross and CDR abatement is region-specific due to differences in (a) CDR potentials and (b) non-electric decarbonization challenges. While Australia compensates for residual fossil emissions of about 40% relative to 2020 through CDR (4 tCO2/cap), in Japan, CDR compensates for about 15% (1.5 tCO2/cap, figure 2(a), Suppl. Figure 10).
3.2. Electricity Decarbonization
In the Net-zero scenario, electricity generation is completely decarbonized in 2040 by scaling up (onshore) wind and solar PV generation to shares of up to 80% in the power mix (figure 3(a), Suppl. Figure 10). An exception is Japan where limited potentials of variable renewables (VREs) lead to a wind and solar share of only 50% that is complemented by the deployment of nuclear and biomass technologies (see Suppl. S10 for assumptions on nuclear power in Japan). If nuclear power is not available in Japan or, in addition, VRE potentials are more limited, the model chooses biomass and fossil CCS technologies to fill the resulting gap (figure 3(b)).
The dominance of wind and solar technologies is driven by several factors: First, steep recent cost reductions have made current new onshore wind and solar PV plants (at low VRE shares) competitive with fossil generation (IRENA 2019). Assuming learning-by-doing, the downward trend of wind and solar generation cost continues in our scenarios. Second, integration challenges concerning high VRE shares are manageable, both technologically and economically and refined power sector representations in IAMs tend to show low integration cost (see Suppl. S7 for details). With the exception of Japan, this also leads to significant 2050 VRE shares in our Current Policies scenario.
In the 2020s and 2030s, the average specific cost of electricity increase across all four regions, while by 2050 they return to levels similar to today (figure 3(a), white dots scaled on right axis). High cost of electricity in the transition period are due to the rapid scale-up of VREs, storage and transmission, complementing early retirement of coal and gas generators. Transition cost are particularly high in Japan due to higher VRE capital costs in line with current trends (Mizuno 2014, IRENA 2019) and low capacity factors.
Average 2050 cost of electricity in the Net-zero scenario are only slightly lower in Australia and the US relative to Japan and the EU (figure 3(b)). In the case of Japan however, a nuclear phase out by 2040 increases cost of electricity. If, in addition, only a fraction of the VRE potential is accessible due to social concerns regarding land availability and grid expansion both, Japan and the EU, face higher cost of electricity than Australia and the US who have access to large VRE resources (figure 3(b), Suppl. Figure 13). Aggregate cost metrics like GDP losses and energy system cost are relatively insensitive to these power sector constraints, yet given limitations of sector coupling in our model we are likely to underestimate those cost effects in an economy-wide picture (see Suppl. S8 for discussion).
Our regional differences in average cost of electricity are driven by generation cost (investment cost, capacity factors, fuel cost, see Suppl. S11 for details). If VRE capacity factors are low or VRE potentials limited such that other low-carbon technologies are required, the cost of electricity increase. Our model only includes a simple regional differentiation of aggregated integration costs which does not reflect regional heterogeneities in network layout or matching between temporal profiles for demand and supply. In general, large VRE-based power grids as in Australia benefit from more balanced VRE supply profiles as they integrate regions with differing weather patterns, while simultaneously requiring more transmission infrastructure.
Our results suggest that regional differences in low-carbon electricity cost depend significantly on the social acceptability of nuclear power or VRE expansion. In Japan, nuclear power policy has to navigate between public opposition, corporate lobbies and concerns about (low-carbon) energy security (Vivoda 2012). The recent example of the slowdown of wind energy deployment in Germany shows the vulnerability of VRE expansion in densely populated parts of Europe as public resistance against new wind parks or transmission lines forms (Kędzierski 2019). Underground transmission lines can promote social acceptability but increase the cost of VRE expansion. Although there have been attempts to assess socially acceptable VRE potentials (Harper et al 2019), the effectively realizable VRE potential remains a key uncertainty for densely populated regions like Japan and parts of the EU such as Germany or the Netherlands.
3.3. Demand-side transformation
Final energy consumption declines in the Net-zero scenario across all regions. However, Japan almost halves energy use by 2050 relative to 2020, while Australia hardly reduces energy consumption by 2050 (Suppl. Figure 14). This is driven by population trends and per-capita energy demand patterns. While Australia and the US face high per-capita demands and increasing populations, Japan and the EU use less energy per-capita and expect declining populations (Suppl. Figures 13 and 15).
Reaching net-zero carbon by 2050 requires substantial cuts in direct emissions from the buildings, industry and transport sector. Figure 4 summarizes indicators for the main options of the model to reduce demand-side emissions by energy demand reduction, electrification or the use of biofuels. As electricity and bioenergy shares increase rather homogenously across regions, persisting high per-capita energy demand in Australia and the US translates into high per-capita demand-side emissions by 2050. The EU and Japan show slightly higher electricity shares in transport driven by our assumption of high (non-carbon) taxes on transport fuels that promote a shift to electrification. However, the model does not consider regionally different structures of energy service demand within the sectors, which may well outweigh this effect (e.g. Australia has a large aluminum sector, which is less challenging to electrify than the significant Japanese steel sector, JISF 2019, Madeddu et al under review). Australia uses less transport biofuels as they are competitive mostly in combination with carbon capture and storage, which Australia does not need due to large CDR potentials from land-use change (LUC).
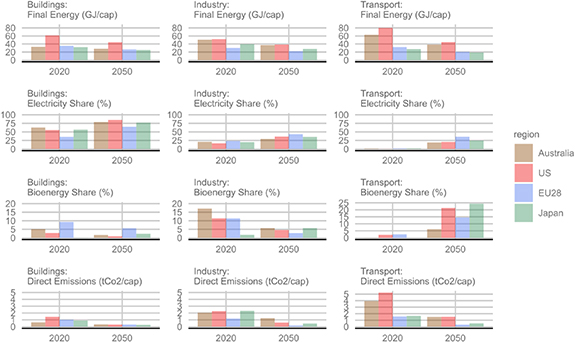
Figure 4. Indicators of demand-side decarbonization across energy end-use sectors in the Net-zero scenario in 2020 and 2050: Final energy consumption per-capita, electricity share of final energy, bioenergy share of final energy and direct demand-side emissions (emissions occurring on site of the energy use excl. emissions from upstream energy production).
Download figure:
Standard image High-resolution imageCurrent per-capita energy use in Australia and the US is almost double relative to Japan and the EU across the three sectors (Suppl. Figure 15). Besides regional differences in energy efficiency (Warr et al 2010, Honma and Hu 2014), this is driven by different energy demand structures due to infrastructural, cultural and geographic factors, which will likely remain. This is most relevant in transport. Australia and the US are more dependent on road transport and have limited public bus and rail infrastructure (Buehler 2011, Lipscy and Schipper 2013). Moreover, they have a higher per-capita demand for domestic aviation and freight transport (Suppl. Figure 15). Given these structural differences in energy demand, we chose modeling assumptions such that the gap in per-capita final energy use between the regions decreases but does not fully close.
As with other IAMs, our model sees lower electrification potentials than indicated by bottom-up studies (Lechtenböhmer et al 2016, Madeddu et al under review). This is because of the way we represent electrification in a macroeconomic production function which tends to reproduce historic fuel shares. In addition, our model does not include carbon capture and utilization (CCU) technologies. Specifically, the use of (carbon-neutral) synthetic fuels could be a missing but relevant option to mitigate (net) emissions in the chemical industry, shipping or aviation. However, the cost of deep electrification or CCU could potentially be high and are an active field of research (Fasihi et al 2016, Hepburn et al 2019, Madeddu et al under review). While we underestimate the maximum potential of demand-side mitigation, it is not clear whether we underestimate its cost-optimal deployment in our scenario relative to CDR.
3.4. Carbon dioxide removal options
CDR by LUC and bioenergy with carbon capture and storage (BECCS) is essential for all regions to reach carbon neutrality by 2050. Reducing gross emissions beyond 90% relative to 2020 levels in each of the four regions is infeasible in our model as residual emissions in the industry and transport sector cannot be avoided.
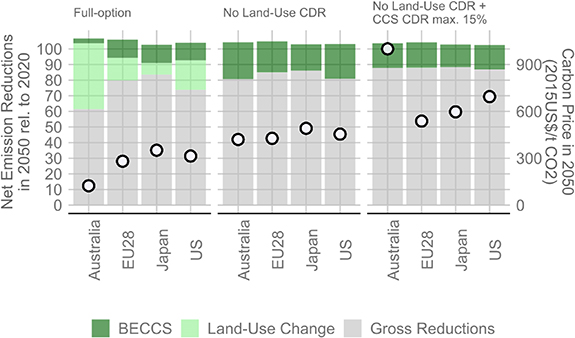
With full CDR options, Australia offsets an amount of 40% of its 2020 emissions by CDR in 2050, while Japan offsets only 15% (figure 5). The carbon price in 2050 (white dots) reflects the marginal cost of abating the last ton of net emissions. Australia requires relatively low carbon prices as it benefits from a large land carbon sequestration potential. Afforestation is generally a low-cost CDR option relative to BECCS and direct air capture with carbon capture and storage (DACCS) (Fuss et al 2018) but is restricted mostly to tropical regions as in mid and high-latitude albedo effects tend to neutralize or even outweigh the cooling effect from sequestered carbon (Bala et al 2007, Kreidenweis et al 2016). Japan, in contrast, faces high carbon prices due to limited land-based CDR options and high bioenergy prices.
Figure 5. Gross abatement and CDR in 2050 (relative to 2020 net emissions) across net-zero scenarios with different CDR contributions (colored bars, left axis) and corresponding carbon prices in 2050 (white dots, right axis). Full-option is the standard net-zero scenario with all CDR options shown in the previous Figures, 'No Land-Use CDR' excludes negative emissions from land-use change but allows for CO2 capture and storage technologies. The 'No Land-Use CDR + CCS CDR max. 15%' scenario, moreover, limits CO2 storage to 15% such that at least 85% gross emission reductions relative to 2020 have to be reached.
Download figure:
Standard image High-resolution image
When constraining the availability of CDR options, we find a shift in the carbon price pattern across the four regions (figure 5). If LUC CDR is not available, carbon prices increase and converge to similar levels across regions since they use BECCS as a more expensive CDR option. However, if in addition CO2 storage is restricted such that gross emission reductions must reach 85% (relative to 2020), Australian and US carbon prices soar, while carbon prices in the EU and Japan hardly increase. Note that here, the carbon price reflects the marginal cost of gross abatement and is not identical to the marginal cost of net abatement as the potential for CDR is limited and fully deployed. The elevated carbon prices of deep gross reductions in Australia and the US result from high energy demand in the industry and transport sector driven by increasing populations and high per-capita energy use (Suppl. Figures 13–15). A similar shift of other cost metrics like GDP loss and energy system cost can be observed across the CDR sensitivity scenarios (see Suppl. S8). The availability of CDR moreover significantly affects emission trajectories after 2050 (see Suppl. S15).
The net-zero scenario assumes full deployment of regional land carbon potentials based on literature values (Suppl. S2). However, there is considerable uncertainty regarding LUC CDR potentials as estimates depend on assumptions on land availability and management practices (Bryan et al 2014, Fuss et al 2018). Moreover, differing accounting methods exist for LUC emissions which has raised the question of whether they should be reported separately or even excluded from national targets (Fyson and Jeffery 2019). In addition to sustainability concerns of bioenergy expansion, BECCS faces challenges of technological scale-up as well as public acceptance (Nemet et al 2018). Furthermore, both geological and land carbon storage are not necessarily permanent and require management of leakage and disturbances (Galik et al 2016, Fuss et al 2018). DACCS is still too expensive to contribute to carbon neutrality by 2050 in our scenarios. It requires cheap electricity input and is highly land intensive. In case of a significant DACCS cost reduction Australia and the US, in particular, could benefit from its adoption, given their high VRE potential and low population density that facilitates public acceptance.
4. Conclusions and outlook
Given their economic capability and historic emissions, there is a normative case for industrialized economies to take leadership roles in global climate change mitigation. Using the modeling tool REMIND, we present corresponding scenarios for representative industrialized regions (EU, US, Japan, and Australia) that achieve domestic net-zero carbon emissions by 2050.
Embarking from different emission profiles and trends, we find that all of the regions have technological options and mitigation strategies to reach carbon neutrality by 2050. Common strategies are a complete power sector decarbonization in 2040, a partial decarbonization of energy demand emissions and a rapid scale-up of CDR technologies. Zooming in, we find a number of region-specific challenges and strengths: While Japan encounters difficulties in the power sector transition due to limited potential for onshore wind and solar power, Australia and the US face challenges to curb industry and transport emissions given increasing populations and high per-capita energy use. The latter regions benefit from large VRE potentials that allow for low-cost renewable electricity generation beyond domestic demand. The role of CDR is particularly important for Australia as the pressure of a fast phase-out of fossil fuels in the growing transport and industry sectors decreases. A large-scale CDR deployment there could significantly alter the required pace, depth and cost of the transition. However, postponing the transition by anticipating future CDR creates serious risks of a carbon lock-in since the scale of available CDR is uncertain. This uncertainty calls for sensible tools of CDR governance where possible remedies such as separating gross emission from negative emission targets and markets have been suggested (Mclaren et al 2019).
Industrialized economies can take a leadership role in the global mitigation effort as the first regions to explore key technologies and policies required for reaching domestic carbon neutrality in 2050. Contributing only about 15% of the cumulative 2011–2100 emissions, their mitigation effort does not significantly affect the remaining 2 °C carbon budget of the rest of the world (Suppl. Figure 17). However, there are a number of channels through which such leadership incentivizes followership in climate mitigation (Schwerhoff et al 2018): First, technological development and diffusion pushes down learning curves globally and makes abatement for followers cheaper. Second, followers may learn from leaders about best-practice policies, for example, from experience on carbon pricing. Third, leaders resolve uncertainty about abatement options and cost where the followers can learn from their experience. Considering deep decarbonization, this may include region-specific experience on power systems with high VRE shares or the cost-optimal interplay of direct electrification, low-carbon fuels and CDR in hart-to-abate sectors.
This study does not reflect national societal and political circumstances sufficiently to provide region-specific policy advice on how to implement and operate a regional net-zero transition. Due to its global scope, REMIND2.1.2 cannot resolve sub-regional detail as in national models since this would be numerically very demanding (e.g. no explicit representation of power grids or gas infrastructure). Moreover, the representation of national policies and short-term trends remains focused on the most important aspects. IAMs typically take a techno-economic perspective and an improved representation of behavioral and socio-technical aspects is an active area of research (Mccollum et al 2017, Trutnevyte et al 2019). The strength of our global IAM approach lies in revealing strategic aspects on a comparative cross-regional level: We carve out a number of common and complementary regional patterns of net-zero pathways, which have implications for the international climate policy discourse.
Our findings suggest that it will be crucial for each of the regions to strategically address their respective challenges and uncertainties: Australia and the US may adopt energy efficiency technologies established in the other industrialized economies and invest into their land and agricultural sectors for exploring the feasibility of CDR options. Japan may push for the scale-up of offshore wind technologies while seeking partners to import low-carbon fuels (biofuels, hydrogen, synthetic fuels). As a union of states, the EU faces the challenge of inter-state coordination of VRE-based power systems and power markets. This challenge is less a technological or economic one, but rather one of political cooperation and social acceptance. To what extent the technical VRE potentials in densely populated regions like Europe or Japan can be effectively realized will remain one of the key questions to determine the success of the low-carbon transformation.
Given these regional characteristics, the role of industrialized economies could be one of common but differentiated leadership. They each may lead on different aspects of the low-carbon transition and, if faced with region-specific obstacles, also at different speeds. This has implications for evaluating the MCS submitted to the UNFCCC in the post-Paris global stocktake process. Japan's cautious MCS relative to the European MCS, for example, can be justified by techno-economic hurdles the island state faces. Similarly, as long as there is the prospect of CDR, the MCS of Australia and the US should not stay behind the European one.
Finally, a joint leadership effort mindful of regional characteristics gives rise to cooperation potentials and synergies. There are cooperation potentials and synergies of two kinds. First, common challenges can be tackled by mutual learning about technology and policy implementations. Japan and the EU may cooperate in advancing electric rail systems to replace short-distance flights. In contrast, finding the cost-optimal trade-off between transforming long-distance passenger and freight transport and potential CDR compensations is a more pressing issue for Australia and the US. Second, industrialized economies could link their complementary transition challenges and strengths. Given their large VRE resource and economic stability, Australia or the US may export electricity-based fuels or materials like hydrogen-based steel to resource constraint countries such as Japan. While there has been exploratory work (Fasihi et al 2016, Chapman et al 2017, Gulagi et al 2017), the jury on VRE-based trade patterns is still out and would require an integrated assessment of entire supply chains. Although, in theory, a joint carbon market can be beneficial, too, there are serious risks involved in such mechanisms as the focus is shifted away from domestic abatement. For example, if each region bet on buying uncertain negative emissions from Australia in the future, they could have an incentive to postpone the near-term transition.
Building a stable leadership coalition that incentivizes followers to join and that minimizes free-riding is subject to extensive literature on international cooperation in climate policy (e.g. Keohane and Victor 2016, Schwerhoff et al 2018). For example, the formation of climate clubs has been suggested with few members who would be enticed to participate by exclusive benefits like facilitated trade and investment regulations or joint research and development (Hovi et al 2016, Victor 2018). Such strategies can help to set up a leadership coalition as well as to incentivize potential followers to join in. Embarking from groups of industrialized economies to cooperate on specific joint challenges as outlined above could foster coalition building in international climate policy.
Future research should expand the cross-country analysis to total GHG emission abatement including non-CO2 emissions and deepen the assessment of the Mid-century Strategies. Moreover, it could add detail to regional transformation profiles and further explore potential economic and strategic partnerships beyond the categories and regions we analyzed. While this study takes an integrated assessment perspective up to 2050, identifying common themes and synergies is relevant also for short-term entry points and policy design. Such research would provide insight into newly emerging geopolitical and economic trade patterns in a low-carbon world.
Data availability statement
The data that support the findings of this study are available upon reasonable request from the authors.
Acknowledgments
We would like to thank the REMIND team for their personal, technical and intellectual support. We would like to thank Jordan Everall for proofreading the manuscript and providing valuable comments. Our research was supported by a variety of funding sources: FS and FU gratefully acknowledge funding from the German Federal Ministry of Education and Research (BMBF) in the START project (03EK3046A) of the Australian-German Energy Transition Hub. The contributions by RP and RR were funded by the EU Horizon 2020 research and innovation programme under Grant Agreement No. 730403 (INNOPATHS). MS was supported by the Environment Research and Technology Development Fund 2-1704 of the Environmental Restoration and Conservation Agency. RJB was supported by the EU Horizon 2020 Marie-Curie Fellowship Program H2020-MSCA-IF-2018 (Proposal No. 838667 - INTERACTION).