

Abstract
Technologies for carbon dioxide removal (CDR) from the atmosphere have been recognized as an important part of limiting warming to well below 2 °C called for in the Paris Agreement. However, many scenarios so far rely on bioenergy in combination with carbon capture and storage as the only CDR technology. Various other options have been proposed, but have scarcely been taken up in an integrated assessment of mitigation pathways. In this study we analyze a comprehensive portfolio of CDR options in terms of their regional and temporal deployment patterns in climate change mitigation pathways and the resulting challenges. We show that any CDR option with sufficient potential can reduce the economic costs of achieving the 1.5 °C target substantially without increasing the temperature overshoot. CDR helps to reduce net CO2 emissions faster and achieve carbon neutrality earlier. The regional distribution of CDR deployment in cost-effective mitigation pathways depends on which options are available. If only enhanced weathering of rocks on croplands or re- and afforestation are available, Latin America and Asia cover nearly all of global CDR deployment. Besides fairness and sustainability concerns, such a regional concentration would require large international transfers and thus strong international institutions. In our study, the full portfolio scenario is the most balanced from a regional perspective. This indicates that different CDR options should be developed such that all regions can contribute according to their regional potentials.
Export citation and abstract BibTeX RIS

Original content from this work may be used under the terms of the Creative Commons Attribution 4.0 license. Any further distribution of this work must maintain attribution to the author(s) and the title of the work, journal citation and DOI.
1. Introduction
With global CO2 emissions still at high levels, technologies for carbon dioxide removal (CDR) from the atmosphere become ever more important to achieve the ambitious climate target laid out in the Paris Agreement. For global mean warming to remain well below 2 °C above pre-industrial times, the absence of CDR would require unprecedented emission reduction rates associated with high economic costs (Strefler et al 2018b). The vast majority of the 2 °C scenarios and all 1.5 °C scenarios assessed in the special report on 1.5 °C of the IPCC (SR1.5) required CDR to achieve the target (Rogelj et al 2018). These scenarios relied mainly on bioenergy in combination with carbon capture and storage (BECCS) (Obersteiner 2001) as the only CDR technology, which probably has overstated its importance, with a limited number of scenarios also including afforestation and reforestation (AR) (Rogelj et al 2018). More recently, alternative CDR options such as direct air capture have started to be considered (Realmonte et al 2019, Fuhrman et al 2020).
There has been widespread criticism on CDR, mainly based on concerns about environmental sustainability (Smith et al 2015) but also relating to finance requirements (Bednar et al 2019). Some of these arguments are reduced when peak warming instead of end-of-century warming is constrained which avoids large-scale net-negative emissions (Rogelj et al 2019b, Strefler et al 2021). We therefore base our study on a peak warming formulation. Many arguments were related specifically to BECCS and based on sustainability concerns regarding the supply of vast amounts of bioenergy or on technological readiness and upscaling (Lomax et al 2015, Bui et al 2018). However, one has to note that bioenergy is a valuable low-carbon energy carrier, particularly for non-electric energy supply, which is in high demand in ambitious mitigation pathways even without the availability of BECCS (Bauer et al 2020). Various other options have been proposed already, e.g. enhanced weathering of rocks (EW) (Hartmann et al 2013, Stler et al 2018a) and direct air capture with geological carbon storage (DACCS) (Keith et al 2006). Their carbon removal potential and environmental side-effects have been analyzed (Smith et al 2015, Fuss et al 2018), but few scenarios are including these options. Research on other land-based options as biochar and soil carbon sequestration has progressed (Smith 2016, Griscom et al 2017), but data on costs and global and regional potential is still uncertain.
With more and more CDR options being discussed, an understanding of the consequences of their deployment not only for sustainability, but also for climate change mitigation efficiency, governance and institutional requirements, and potential political challenges is crucial. In this study, we undertake a comparative analysis of different CDR options that has so far been lacking. We analyze scenarios with either a portfolio of CDR options available, namely BECCS, AR, EW on croplands, and DACCS and scenarios where only one or none of these options is available. We study the implications for achieving carbon neutrality including the timing of CDR, efficiency for climate change mitigation, as well as regional deployment patterns and the resulting institutional and political challenges.
2. Methods
In this study, we use the global multi-regional energy-economy-land-climate model REMIND–MAgPIE 2.1.1–4.2.1 (Dietrich et al 2020, Luderer et al 2020) to determine cost-efficient emission and technology pathways. In the model, the four options BECCS (Klein et al 2014), DACCS (Broehm et al 2015), AR (Humpenöder et al 2014), and EW on croplands (Stler et al 2018a) are available as CDR technologies. BECCS is the CDR technology most widely used in the SR1.5 scenarios and the only CDR technology that provides energy instead of consuming it. It is based on the assumption that bioenergy can be turned carbon negative by capturing the emissions arising during combustion or the refinery process. The economics of BECCS deployment depends on (a) techno-economic assumptions such as investment costs, conversion efficiency and CO2 capture rate (see table S1 available online at stacks.iop.org/ERL/16/074021/mmedia) and (b) the price for biomass. Bioenergy prices depend on biomass availability determined by various biophysical and economic factors including land availability, crop yields (which can be increased by productivity growth), food and feed demand, production costs, and trade (see SI for more details). In addition, the pricing of CO2 emissions from deforestation and conversion of other natural land has repercussion on the biomass price. An additional tax on bioenergy of 100% of the bioenergy price is imposed to account for sustainability issues not included in the model, e.g. biodiversity loss. Costs depend on the technology and the bioenergy price, with the cost markup of BECCS technologies being only 20–50 $t CO2 −1 with respect to the costs of the same bioenergy technology without CCS. As BECCS is only used in small demonstration plants, there are still large uncertainties regarding the amount of biomass that can be supplied sustainably (Fuss et al 2018) as well as the amount of CCS available.
DACCS captures CO2 from ambient air, which requires large amounts of heat and electricity (table S2), and carbon storage. In the model, we consider high-temperature DACCS where natural gas or H2 can be used to generate the required heat. If natural gas is used, the resulting CO2 emissions are assumed to be captured with a capture rate of 90%. Costs are at least around 200 $ tCO2 −1 (Broehm et al 2015), but may be significantly higher depending on energy prices. This makes DACCS a rather expensive option compared to both BECCS and AR. On the upside, DACCS can be deployed in any region with enough carbon storage space, and requires only little land.
AR policies include targets laid out in nationally determined contributions (NDCs) to the Paris Agreement and economic incentives. The economic incentive for AR (Humpenöder et al 2014, Kreidenweis et al 2016) in the model is provided by the expected average annual reward for carbon sequestration in regrowing forests. The average annual reward reflects the annuitized present value of future cash flows over a 50 year time horizon, based on annual carbon uptake times CO2 price (see SI for details). Costs for AR include direct costs, such as costs for land conversion, forest management and monitoring, and indirect costs, like costs for yield-increasing technological change and reallocation of agricultural production (Humpenöder et al 2014). Therefore costs depend strongly on the region, time and scenario, but tend to start around 30 $ tCO2−1 and increase with deployment. Re- and afforestation is implemented as managed regrowth of natural vegetation which grows substantially slower than plantation forest (Braakhekke et al 2019). However, with respect to biodiversity naturally regrown vegetation usually has substantially higher species richness than plantation forest (Barlow et al 2007). Moreover, AR requires about 2–3 times the land needed for BECCS per unit of CDR (Smith et al 2015). AR in the boreal zone might result in local warming due to albedo effects, which might offset the cooling from carbon sequestration (Bright et al 2015). Therefore, we restrict AR to the temperate and tropical zone (Kreidenweis et al 2016). Main uncertainties relate to the resilience of terrestrial carbon storage to climate extremes and to estimates of potential carbon sequestration from dynamic global vegetation models (Krause et al 2018, Seneviratne et al 2018).
Chemical rock weathering is an integral part of the global carbon cycle and removes about 1.1 Gt CO2 yr−1 from the atmosphere (Ciais et al 2013). The natural weathering process can be enhanced by grinding selected rocks to small grain sizes to increase the specific surface area, and spreading them on croplands in warm and humid regions (Hartmann et al 2013, Taylor et al 2015). The rock material dissolves in the presence of water and CO2 and dissolution products are transported via rivers towards the ocean, where they are stored at millennial time scales (Garrels et al 1976). To minimize negative side-effects due to trace elements (Amann et al 2020), we assume only basalt to be used for EW. The cropland area in warm and temperate humid climate zones determines the regional potential of EW (see SI for details). This potential is still highly uncertain and depends on the amount of basalt than can be spread on fields without compromising soil quality and the weathering speed. Applying EW not only on croplands as assumed here but also on woodlands would increase the potential, but also the costs as spreading would become more difficult. All uncertainties could change the total amount of EW, but would not have much impact on regional distributions as warm and humid regions would remain favorable. Costs consist of mining, grinding, transport and spreading, which add up to about 200 $ tCO2 −1 (Stler et al 2018a).BECCS and AR compete for land with each other and with food and feed production, which limits the total CDR potential for these two options. BECCS, DACCS, and fossil CCS compete for geological storage. In REMIND, regional annual CCS is limited to 0.5% of the total available geological storage in that region. This limits total global CCS use to 20 Gt CO2 yr−1. CCS costs include the costs for CO2 transport and storage, the costs for carbon capture are included in the respective technologies, e.g. BECCS and DACCS. To reflect the risk of leakage and the associated possible costs, costs of improved safety criteria related to monitoring, reporting, and verification, and difficulties due to public acceptance, which are all likely to increase with deployment, the best estimate of costs for geological carbon storage is increased linearly such that costs are about 100% or 30 $ tCO2 −1 higher at maximum deployment. In all regions, an additional tax of 50% of the current carbon price is imposed on net-negative CO2 emissions, i.e. on the share of CDR that exceeds the remaining emissions. This deduction of the revenues accounts for climate damages due to the associated temperature overshoot and governance and finance risks of net-negative CO2 emissions. In line with earlier studies using the REMIND-MAgPIE IAM framework, impacts of climate change, such as impacts on crop yields or labor productivity, are not accounted for (Popp et al 2017, Bertram et al 2018). However, we are looking here at ambitious transformation pathways towards 1.5 °C, which are expected to limit climate change impacts to moderate levels. It has been shown that accounting for climate change impacts in a 2 °C compatible scenario would create an additional terrestrial carbon sink at the global level, while afforestation pattern would only slightly change (Humpenöder et al 2015).
We analyze six scenarios with different CDR availabilities: one scenario including all CDR options (full portfolio), four scenarios including each one option only (BECCS only, DACCS only, AR only, EW only), and one scenario with only minimal amounts of CDR from current policies and industry BECCS (min CDR). As biomass may be used in the industry sector, allowing for industry CCS leads to 33 Gt CO2 of industry BECCS cumulatively in the 21st century. All scenarios follow current trends in socio-economic development (SSP2) and allow for fossil and industry CCS, and AR already planned under current policies which leads to 17 Gt CO2 removed cumulatively in the 21st century. All scenarios assume current policies until 2020. In 2025, all regions introduce a carbon price on all sectors, but at different levels reflecting their different abilities to pay (figure S13). The carbon prices in all regions increase and converge to a uniform level in 2045, which is held constant thereafter. The carbon prices are adapted to limit global cumulative CO2 emissions to a peak budget (Rogelj et al 2019a, 2019b) of 920 Gt CO2 from 2011 onwards (i.e. around 650 Gt CO2 from 2018 onwards) (Rogelj et al 2018). This leads to emission trajectories consistent with at least a 50% chance of low overshoot (<0.1 °C) of 1.5 °C. Scenarios where a constant carbon price after 2045 is sufficient to obtain net-negative emissions in the second half of the century (i.e. full portfolio and BECCS only) also have at least a 50% chance of limiting global mean temperature increase to 1.5 °C by the end of the century. In the SI we also analyze scenarios that follow more sustainable socio-economic trends (SSP1) and scenarios with global cumulative CO2 emissions of 1320 Gt CO2 from 2011 onwards (i.e. 1050 from 2018 onwards) that are consistent with a 67% chance of limiting global mean temperature increase to 2 °C by the end of the century.
3. Results
3.1. Achieving carbon neutrality
Due to the choice of a peak CO2 budget constraint, all scenarios achieve about the same peak temperature, but differ in their post-peak temperature developments. The varying CDR availability leads to large differences in carbon price trajectories required to meet the peak budget constraint which induces differences in CO2 emissions profiles (figure 1). Notably, the time of reaching global carbon neutrality is pushed back from 2050 to 2070 between the full portfolio and min CDR case, highlighting the fact that the availability of CDR allows to reach net zero targets earlier. In cases with more limited CDR availability, near-term CO2 emissions until 2030 drop faster and long-term CO2 emissions stay around net zero in the second half of the century. This leads to almost stable global mean temperatures, as opposed to scenarios with BECCS or full CDR availability, where global mean temperatures decline after the peak due to net-negative emissions in the second half of the century and come closer to a 67% probability of staying below 1.5 °C in 2100 (Figure 1(D)).
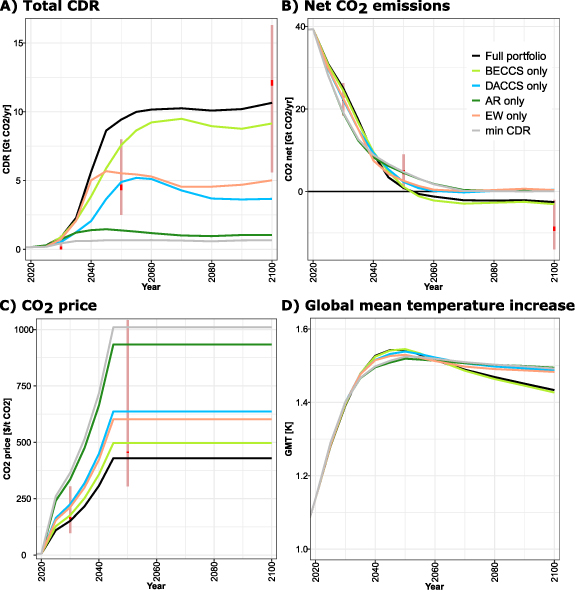
Figure 1. (A) CDR deployment, (B) net CO2 emissions (incl. international bunkers), (C) carbon price, and (D) global mean temperature increase (calculated using the MAGICC model (Meinshausen et al 2011), see SI for more details) for the full portfolio (black), BECCS only (light green), DACCS only (blue), AR only (dark green), EW only (orange), and min CDR (gray) scenarios. The red circles and bars show the median and the interquartile range of the SR1.5 1.5 °C scenarios with low overshoot.
Download figure:
Standard image High-resolution imageThe amount and timing of CDR deployment differs between the options (figure 1(A)). AR contributes less than 1 Gt CO2 yr−1 removal, indicating a very limited potential for additional AR beyond current plans in our scenarios based on current socio-economic trends (SSP2). The potential for AR critically depends on land availability, which is limited given the assumption that current trends for the development of socio-economic drivers as population and lifestyles are sustained, resulting in increasing food demand until around 2050 (SSP2) (Fricko et al 2017, O'Neill et al 2017, Riahi et al 2017, Bodirsky et al 2020). Lower population growth and more sustainable lifestyles could increase the potential for AR (SSP1, Van Vuuren et al 2017, figure S9(a) in SI). DACCS is only limited by energy and CCS availability and has therefore the highest theoretical potential. Due to the high costs, however, deployment starts the latest and the theoretical potential is never fully exploited. Bioenergy supply is the main limiting factor for BECCS, but it is still the option deployed at largest scale (10 Gt CO2 yr−1). EW reaches only about half the maximum deployment of BECCS, but can be ramped up quickly. The full portfolio scenario shows the most CDR deployment, though far less than the sum of all options. This is due to the lower carbon price, which would reduce deployment of all options, but also due to the competition for land and carbon storage between the options.
Both the min CDR and the AR only scenarios reduce gross CO2 emissions faster and to lower 2050 levels than all other scenarios, by 86% and 85%, respectively (figures 2(A) and S11). Yet since there is not much CDR available to offset remaining emissions, the reductions in net CO2 emissions in 2050 are lower and therefore the net emissions are higher than in the other scenarios. Carbon neutrality in 2050 is only achieved in our scenarios, if BECCS is available, i.e. a cost competitive CDR option with sufficient potential. Gross emissions are reduced by 74% and 78% in the full portfolio and BECCS only scenario, respectively. The remaining emissions are compensated, with BECCS being the largest CDR contribution in the full portfolio scenario. Higher CDR availability thus takes pressure off emission reductions, but leads to lower levels of net CO2 in 2050. Note that the largest share of CDR is deployed in the second half of the century (figure 2(B)). About 7% and 14% of cumulative CDR is used for net-negative emissions in the full portfolio and the BECCS only scenarios, respectively, while there are no net-negative emissions in the other scenarios. This share of CDR is not needed for climate stabilization but leads to further declining global mean temperature. Though this may be beneficial in terms of climate damages, these benefits would have to be weighed carefully against the potential side-effects of CDR.
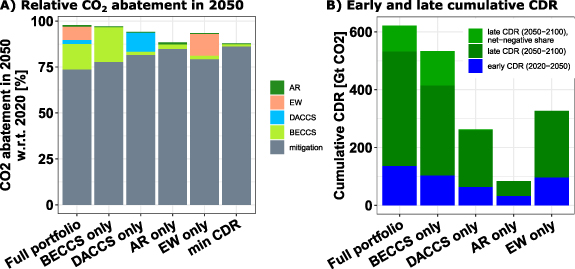
Figure 2. (A) Relative reduction of net CO2 emissions (incl. international bunkers) in 2050 with respect to 2020, disaggregated into mitigation of gross emissions (grey) and offsets via AR (dark green), EW (orange), DACCS (blue), and BECCS (light green). (B) Early (until 2050, blue) and late (2050–2100, green) cumulative CDR, with the light green area representing the net-negative part of late CDR.
Download figure:
Standard image High-resolution image3.2. Impacts on climate change mitigation challenges
We find that the availability of CDR strongly affects the mitigation challenges of ambitious climate protection scenarios (Luderer et al 2013, Stler et al 2018b). We look at two indicators for mitigation challenges: average annual CO2 emission reduction rates between 2020 and 2050 as an indicator for transitional challenges, and cumulative discounted GDP loss (with respect to a scenario with continued current policies, discount rate 5%) as an indicator for overall economic efficiency. In our scenarios, transitional challenges are reduced by up to 35% (figure 3(A)) with respect to a scenario with only minimal CDR. The ability of CDR options to reduce climate change mitigation challenges depends on the two factors of costs and potential. Costs need to be low enough to make deployment economic in the next decades. DACCS has the highest costs with a large fraction expended on energy, followed by high costs for EW, intermediate costs for BECCS and low costs for AR. Potential needs to be high enough to have a significant impact on the climate. DACCS and BECCS have the highest potentials, followed by intermediate EW and low AR potentials. The low AR potential leads to negligible reductions of transitional challenges in the AR only scenario. The reduction of transitional challenges of the other three options are ranked by their costs, with the cheapest option BECCS having the highest reductions. This implies that having CDR available at sufficient potential is more important to reduce transitional challenges than the exact choice of technology. However, CDR costs still have a considerable effect, with a combination of several options being economically most beneficial. The picture for economic efficiency looks very similar (figure 3(B)). Changes in socio-economic assumptions that make emission reduction easier (SSP1) or a less stringent climate target can reduce the reliance on CDR and therefore the difference between options (figure S10).

Figure 3. Indicators for economic challenges. (A) Indicator for transitional costs: average annual gross CO2 emission reduction rate 2020–2050. (B) Indicator for overall economic efficiency: Cumulative discounted GDP losses 2020–2100 with respect to a scenario with continued current policies (discount rate 5%).
Download figure:
Standard image High-resolution image3.3. Regional deployment
The different regional potentials of the four options lead to quite different regional distributions of emission reduction efforts (figure 4) and CDR deployments by 2050 (figure 5). We compare the regional net CO2 emissions to the amount of regional emissions allowances that would result from two commonly used equity measures for emission reductions (Robiou Du Pont et al 2016, 2017): Capability (high mitigation for countries with high GDP per capita) and equal per capita, where every person would be allowed the same amount of emissions in that year (figure 4). In the min CDR scenario, emissions in Asia and Latin America are slightly and in Sub-Saharan Africa significantly lower than emissions allowances under equity considerations, while emissions are higher in OECD countries, Reforming Economies, and Middle East and North Africa (see SI for definitions of native model regions and region mapping). This is due to the assumptions of a global policy framework with globally uniform carbon prices. Regionally differentiated carbon prices could change the distribution of emissions and the scale and pattern of carbon removals regarding technology and region (Bauer et al 2020). The picture looks similar in the AR only scenario, while the EW only scenario even increases this imbalance. In this scenario, Latin America is the only region with large net-negative emissions already in 2050. The DACCS only, BECCS only, and full portfolio scenarios turns things around, with the OECD and Reforming Economies reducing their emissions more instead of less than their fair share. Latin America and Sub-Saharan Africa contribute more than their fair share in all scenarios, except for the full portfolio and BECCS only scenarios for Sub-Saharan Africa. Across all regions, the distribution of net emissions appears most balanced in the full portfolio scenario. In this case, all regions have enough CDR potential to offset or even overcompensate their residual emissions, i.e. net CO2 emissions are close to zero in all regions.
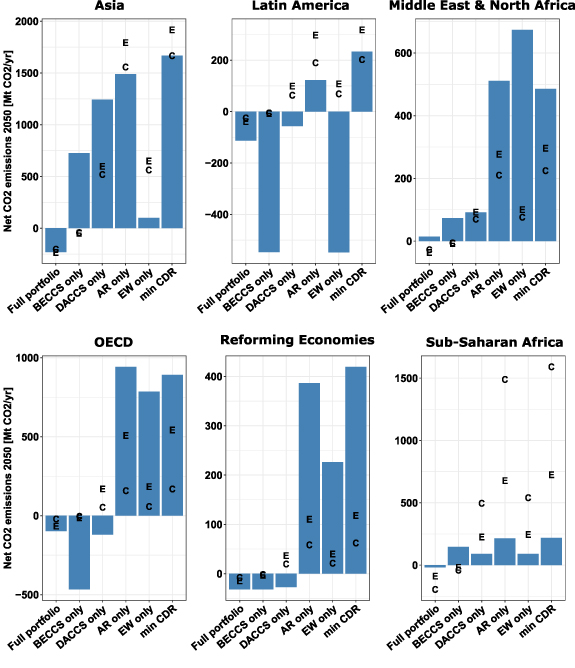
Figure 4. Regional net CO2 emissions in 2050 (excluding international bunkers). Blue bars show the net emissions from the scenarios, the black letters indicate net emissions resulting from two different equity measures based on capability (C) and equity (E) (Robiou Du Pont et al 2017).
Download figure:
Standard image High-resolution image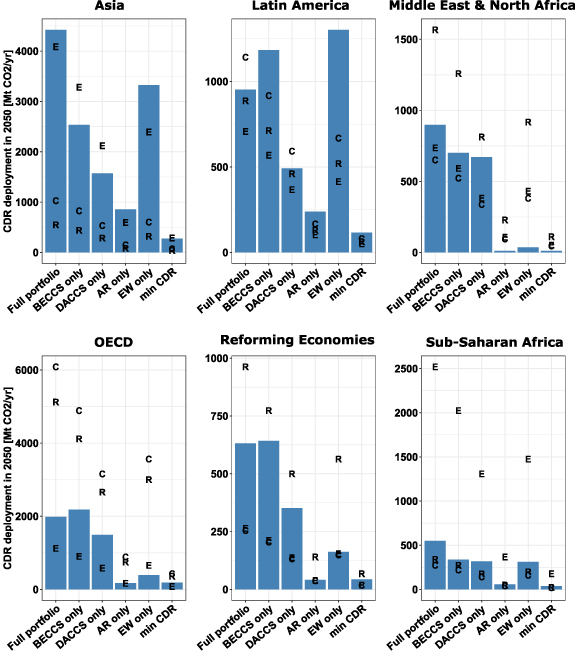
Figure 5. Regional CDR in 2050. Blue bars show CDR deployment in the scenarios, the black letters indicate CDR contributions resulting from three different equity measures based on responsibility (R), capability (C) and equity (E) (Pozo et al 2020).
Download figure:
Standard image High-resolution image
CDR deployment is distributed differently across regions depending on the available options (figure 5). We compare regional CDR deployment in our scenarios to the distribution of global CDR according to three equity measures based on Pozo et al (2020): responsibility (based on cumulative emissions since 1850), capability (based on GDP per capita), and equality (equal per capita CDR). We see a strong regional concentration of CDR deployment if either only AR or only EW is available.
AR shows significant potential only in Latin America. This result is due the exclusion of the boreal zone (north of 50° N) for AR (see SI), the higher potential carbon sequestration in the tropical zone as compared to the temperate zone (Humpenöder et al 2014), and land availability, which in turn depends on a variety of socio-economic factors such as population, income and the share of animal-based protein in human diets (Popp et al 2017). Land availability is the limiting factor for AR in Sub-Saharan Africa and Asia because the available land is largely needed to fulfill the increasing food demand, in particular livestock products, of a rising population. Similarly, EW potential is concentrated in the tropical regions of Latin America and Asia, with some potential also in OECD countries and Sub-Saharan Africa. This is due to faster weathering rates in warm and humid regions and thus higher carbon sequestration potential per area.
The picture looks very different for the CCS-based options DACCS and BECCS. Both technologies are deployed in all regions. While DACCS can in principle be used all over the world, regions with large storage capacities, high renewable energy potential, and subject to restrictions such as limited bioenergy potentials like the Reforming Economies and Middle East and North Africa, but also OECD countries, have the highest incentives for deployment. With DACCS and BECCS, the OECD countries, Reforming Economies, and Middle East and North Africa come closest to the shares defined by the equity measures. The DACCS only scenario is the only one where the OECD and Middle East & North Africa come at least close to contributing CDR shares based on responsibility. When looking at responsibility and capability, the most balanced picture emerges in the DACCS only scenario. When looking at equity, the AR only seems to be the most balanced, but this is mainly due to the low overall potential in our scenarios.
4. Discussion and conclusion
Carbon neutrality can only be achieved when CO2 emissions are reduced substantially, but CDR is still vital. Sufficient CDR availability can at the same time take some pressure off emission reductions, and lead to lower levels of net CO2, which makes carbon neutrality in 2050 achievable. Higher CDR availability leads to earlier carbon neutrality. Our results show that sufficient early CDR availability (∼5 Gt CO2 yr−1 by 2050) can reduce the transitional as well as long-term economic costs of achieving the 1.5 °C target by about one third, even when the target is formulated as a constraint on peak warming. The choice of CDR option only affects mitigation challenges to the extent it leads to different near- to medium term CDR potential and costs. An end-of-century target would likely increase the value of CDR and could lead to more differentiated results with respect to the various CDR options, but would also lead to different levels of temperature overshoot.
CDR deployment shifts regionally depending on which option is available. Latin America is almost solely responsible for CDR deployment if only AR is available. Latin America and Asia deploy the most EW in absolute numbers, leading to a much higher emission reduction effort in these regions than in the min CDR scenario and the equity schemes, and to large net-negative emissions already in 2050 in Latin America. BECCS and DACCS are not as concentrated, but BECCS is still disproportionally deployed in Latin America, leading to large net-negative emissions in this region and also in the OECD already in 2050. From the four CDR options considered, DACCS is the most evenly distributed. On the one hand, a regional concentration could lead to higher social and environmental concerns in the affected regions due to possible negative side-effects. For AR these concerns relate mainly to the amount of land needed and the resulting effect on food prices. BECCS faces similar land competition challenges and might enhance water scarcity and nitrogen pollution. However, as bioenergy can be traded across regions, the side-effects due to bioenergy production may occur in regions other than those who deploy BECCS (figure S5 in SI). For DACCS the main issue is the additional energy demand. EW might lead to health problems due to fine dust and requires mining and transport of large amounts of stones and possibly large amounts of water to create a slurry.
On the other hand, a well-functioning international emission permit trade could lead to high financial transfers and therefore economic benefits for these regions. However, these large international transfers would require strong international institutions, leading to additional challenges for CDR deployment. As the regional concentration is strongest if only AR or only EW is available, the technologically simplest options have the highest challenges in terms of international institutions. To some extent, these institutional challenges also apply to BECCS, as the net-negative emissions in Latin America in 2050 could also lead to high financial transfers. If there was no international emission permit trade, a regional distribution of net emissions as in the BECCS only scenario with substantial net-negative emissions in 2050 in the OECD could also reduce challenges in international negotiations, as the OECD would then carry a larger share of the emission reductions, benefiting regions like Asia and Sub-Saharan Africa.
Monitoring and verification are additional challenges that are likely to be higher for AR and EW, as here carbon sequestration potentials are hard to measure and the carbon storage in forests is subject to issues of storage permanency due to fire, degradation or deforestation. Beside the institutional challenges it is also at least questionable whether it would be ethically acceptable if some regions compensate the excess emissions of others, especially if the compensating regions have lower incomes and/or lower historic emissions. These concerns can be alleviated when different CDR options are available. In our study, the full portfolio scenario is the most balanced from a regional perspective. This indicates, that different CDR options should be developed such that all regions can contribute according to their regional potentials.
However, CDR needs to be financed. An obvious source would be the revenues gained from carbon pricing. Yet carbon revenues are also important to mitigate regressive distributional effects from carbon pricing and for investments into infrastructure or low-carbon technology development. CDR reduces these revenues in two ways: First, higher CDR availability reduces the carbon price, and second a larger share of these revenues is needed to finance CDR. Scenarios with less CDR have higher carbon prices, but also more carbon revenues available to mitigate the economic and social impacts. Carbon neutrality implies that all carbon revenues are needed to finance CDR, if CDR is rewarded at the carbon price. However, governments could also aim to reduce the rents of CDR suppliers and reward CDR with prices that are closer to the actual costs.
With this study, we provided a diagnosis of the economic and temporal and regional distributional effects of different CDR options and the resulting challenges. We included an exemplary set of CDR options and showed how the results depend on their total and regional potential and costs. However, we assume a first best solution with global uniform carbon prices and no market failures. Global and regional CDR deployment could look very different in reality depending on regional policies, e.g. differentiated timing and level of carbon pricing (Bauer et al 2020), or public acceptance, e.g. of CCS. In particular, the deployment of the land-demanding CDR options BECCS and AR strongly depends on socio-economic factors, which influence the availability of land (e.g. population, income and human diets).
For CDR to emerge at all, policy makers would have to set strong incentives that lead to an economic viability of these technologies. As a prerequisite, policy makers would have to establish public acceptance, monitoring and verification, and provide the necessary infrastructure e.g. for CCS. A deeper analysis of the institutional challenges and possibly resulting limitations or facilitation of different CDR options and an analysis of other CDR options such as soil carbon sequestration or biochar would be the next step. Further research is necessary to integrate these insights into short- and long-term climate policies. Our results indicate that the temporal and regional profiles and the corresponding political, social and institutional challenges of different CDR options need to be taken into account when evaluating these options.
Acknowledgments
The research leading to these results has received funding from the German Research Foundation (DFG) Priority Programme (SPP) 1689 (CEMICS2) and from the German Federal Ministry of Education and Research (BMBF, Grant No. 01LA1809A, DIPOL project).
Data availability statement
The datasets generated and analysed in this study and the plot routines are available in zenodo with the identifier doi: 10.5281/zenodo.4313059.
Code availability
REMIND is open source and available on GitHub. The model version used in this study is 2.1.1, which can be downloaded at https://github.com/remindmodel/remind/releases/tag/v2.1.1. MAgPIE is open source and available on GitHub. The model version used in this study is 4.2.1, which can be downloaded at https://github.com/magpiemodel/magpie/releases/tag/v4.2.1. Documentation can be found at https://rse.pik-potsdam.de/doc/magpie/4.2.1/
Author contributions
Jessica Strefler produced and analyzed the scenarios, produced the figures, and was the lead author. Jessica Strefler and Elmar Kriegler designed the scenarios. All authors contributed to the development of the models, the presented ideas, the figure design, and to the text.
Conflict of interest
The authors declare no competing interests.