

Abstract
The global trade of energy allows for the distribution of the world's collective energy resources and, therefore, an increase in energy access. However, this network of trade also generates a network of virtually traded resources that have been used to produce energy commodities. An integrated database of energy trade water footprints is necessary to capture interrelated energy and water concerns of a globalized economy,and is also motivated by current climate and population trends. Here, we quantify and present the virtual water embedded in energy trade across the globe from 2012 to 2018, building on previous water footprinting and energy virtual water trade studies to create an integrated database. We use data from the United Nations Comtrade database and combine several literature estimates of water consumption of energy commodities to generate the global virtual water trade network. Results include a comprehensive database of virtual water trade for energy at the country level, greatly expanding the literature availability on virtual water trade. The total volume of virtual water trade increased 35% from 157 km3 in 2012 to 211 km3 in 2018. The global trade of oil and fuelwood are consistent drivers of virtual water trade over time, whereas coal, hydrocarbons, and charcoal collectively contribute less than 4% of total virtual water trade between 2012 and 2018. Electricity, despite a less dense trade network constrained by infrastructure, contributes notably to virtual water trade, driven largely by water use for hydroelectricity. This study develops an integrated assessment of previous virtual water studies to estimate global virtual water trade of energy, creating a platform for future global studies.
Export citation and abstract BibTeX RIS

Original content from this work may be used under the terms of the Creative Commons Attribution 4.0 license. Any further distribution of this work must maintain attribution to the author(s) and the title of the work, journal citation and DOI.
1. Introduction
Westernized society today relies on resources such as clean water, reliable electricity, and readily available energy. Without these resources, much of what we experience in our lives today would not be possible. As the global push to mitigate climate change manifests in energy transitions, the ways in which we consume electricity, fuels, and water will change. The intersection of water and energy resources, the energy-water nexus, provides an important lens for understanding resource consumption. In this study, we build upon previous research in the energy-water nexus and water footprinting to assess the virtual water trade of eleven different energy commodities between countries, creating an integrated global perspective on energy and water resources.
The energy-water nexus identifies the dependence of water and energy systems on one another. Water systems rely upon energy for the supply, treatment, and distribution of water resources [1, 2]. Conversely, energy systems rely upon water resources for the extraction and refining of fuels and the generation of electricity. There have been several studies that have identified the water consumption of fuels [3–5], the operational water demands of thermoelectric power generation [6–9], and the water consumption from evaporation at hydroelectric dams [10, 11]. Further, there have been several studies that have identified the full life-cycle water impacts of energy systems [12–14]. Macknick et al [7] provide a review on the operational water intensities of electricity generating technologies including both withdrawal and consumption. This study provided the foundation for future investigation on the limits and opportunities of water-for-electricity consumption based on fuel source, cooling type, and technology. Grubert [11] analyzes the regional differences of water footprints of hydrelectricity within the United States, identifying regional clusters with similar consumption patterns for use in local-scale water footprint analysis. Importantly, the water requirements of energy systems create potential vulnerabilities for energy production that are expected to be exacerbated under climate change [15].
The concept of a water footprint was first introduced by Hoekstra [16] to represent a nation's use of global water resources more accurately. A water footprint calculates both the consumptive use of green (i.e. rainwater), blue (i.e. surface and ground water), and/or grey (i.e. polluted water) water for a particular commodity or sector, as well as the net water used for exporting and importing [17–19]. The exported or imported water footprint is often termed 'virtual water', where virtual water refers to the volume of water used to produce any given resource [20]. Water footprints or virtual water offer opportunities to assess the indirect impacts that the consumption of goods has on water resources that are often geographically distant. A globalization of the economy coupled with these estimates of water footprints create what is known as a virtual water trade network.
A majority of the existing research on virtual water trade networks focuses on food trade, stemming from work in water footprinting of the agricultural sector [19, 21]. These studies have been completed at the global [22–24], national [25, 26], and sub-national scales [27, 28]. For example, Konar et al [23] provided one of the seminal virtual water trade papers, discussing the blue and green water footprints of traded grain crops and livestock products. Konar et al [23] also identified a power relationship between node strength (traded virtual water) and node degree (number of connections), which is important for identifying scaling properties of trade networks. A limited, but growing, number of studies have investigated the virtual water trade properties of energy resources. These resource networks have also been evaluated at various scales, including sub-national [29], national [30], and continental scales [31]. A recent study investigated embodied water flows of energy at an international scale, but excluded biofuels, with the analysis ending in 2010 [32]. Therefore, there are opportunities to advance the understanding of global virtual water trade of energy through a more integrated approach that applies the same methodology to a multitude of energy sources.
In this study, we build on previous estimates of virtual water trade to investigate the implications of global energy demand from 2012 to 2018. We utilize existing research on the water demands of energy to identify the global water impacts of the trade of coal, natural gas, electricity, and wood products. This work provides an integrated database of virtual water trade values across seven years and eleven commodity groups. Aggregating these data and presenting a uniform methodology is an important step in addressing global energy-water nexus concerns.
2. Methods
2.1. Water footprints of energy
We rely on a combination of literature values and technical reports to determine the water intensities of energy. Country- and temporally-specific values are assigned when data are available. Datasets S1-S6 provide the water footprints of energy by country, when available, for all fuels except electricity. Water footprints of electricity are published, separately, in an online repository [33].
2.1.1. Electricity
Consumption of water in the production of electricity is predicated upon fuel source, cooling system type, and other climatic factors [34]. There are a multitude of studies that utilize empirical data to calculate these water demands, particularly in the United States [7, 9, 35, e.g.]. Here, we leverage data from Davies et al [36] and water use rates from Macknick et al [7] to determine the water footprint of electricity for each country based on their electricity generation portfolio. By nature, this assumption generates uncertainty, firstly, from using US-specific water consumption rates and secondly, because in larger countries, specific subgrids dictate electricity exchange across borders [13, 30]. However, these assumptions are necessary for a global study, given there are few examples of country-specific data. We adopt a static approach to water footprints of electricity and rely upon shifting electricity portfolios to dictate changes in this virtual water trade, similar to previous work on virtual water for electricity [31]. Electricity generation portfolios are gathered from the International Energy Agency (IEA) for each year [37] and a weighted average of water intensity by fuel source is utilized to determine the water intensity of the country's electricity mix. In several instances, specific country values were not available from the IEA and generation mixes were manually determined (see Text S2 for specific details).
We assume the water footprint of renewable electricity technologies, such as solar photovoltaics or wind, is negligible. Hydroelectricity presents a unique challenge as operational water consumption occurs from reservoir evaporation and is based on unique climate and reservoir conditions. Further, many dams are multi-purpose, complicating the attribution of water consumption to electricity production [38]. As a result, many studies of water-for-electricity choose to neglect hydroelectricity in their calculations (e.g. [31, 39]). However, the evaporation from hydroelectric reservoirs is a significant contributor to water footprints of electricity [13, 26, 40] and recent studies have provided more insight on the water intensity of hydroelectricity [11, 41]. In this study, we apply hydroelectricity water footprints from Mekonnen et al [41] developed at the country scale based on proportions of reservoir use and potential evaporation.
2.1.2. Coal and lignite
The water footprint of bituminous coal and lignite has been evaluated in multiple different forums. The supporting information of Grubert & Sanders [12] highlights the large spatial heterogeneity of consumptive water demands of coal production across the United States based on practice, extraction process, geology, and other factors. Additionally, there is relatively little information on country-to-country variations in water intensity for coal and lignite. Therefore, we utilize a standard global factor, recognizing the limitations and large uncertainty that this imparts on the study. For bituminous coal we assume an average water consumption intensity value of 0.36 m3/1000 kg [42] with a range of 0.18–4.2 m3/1000 kg [41]. For lignite, we assume the same mean water intensity, but with a smaller range of 0.10–0.72 m3/1000 kg [41].
2.1.3. Oil
Our study distinguishes between crude and not-crude oil based on commodity trade aggregations. Similar to coal and lignite, we are limited by data availability and utilize global values for estimating water intensity. We assign a water consumption intensity range of 0.002–0.048 m3/ kg of crude oil with an average value of 0.011 m3/ kg [42, 43]. Refining crude oil consumes additional water resources, between 1.2×10⁻³ and 2.2×10⁻³ m3/kg, with an average of 1.7×10⁻³ m3/kg [42]. Adding this refining water intensity to crude oil, yields a water consumption intensity range of 3.2×10⁻³ to 5.0×10⁻² m3/ kg for not-crude oil.
2.1.4. Natural gas and other hydrocarbons
The water consumption of natural gas varies widely depending on the extraction method. Conventional natural gas extraction has a water intensity of approximately 7.6×10⁻⁴ m3/MMBtu [44]. Shale gas water intensity estimates range from 0.003 to 0.221 m3/MMBtu with an average value of 0.017 m3/MMBtu [35]. However, there are only a few countries that produce shale gas commercially. Approximately 50% of natural gas production in the United States is from shale gas, 4% in China, 25% in Canada, and 2% in Argentina [45]. Therefore, we define a weighted average of conventional and shale gas extraction water intensity for these countries. For other countries, we assume the water intensities of conventional natural gas extraction with an average value of 0.004 m3/MMBtu from Spang et al [35].
In the process of extracting and processing natural gas, other hydrocarbons such as ethane, propane, butane, or pentanes are produced. Using production factors from the United States, we estimate the ratio of butane and propane production versus natural gas production [46]. Using these ratios, we estimate water footprints of these fuels assuming similar water footprints to natural gas. For example, assuming mean water consumption intensity for natural gas is 0.004 m3/MMBtu [35], we estimate the water consumption intensity of propane to be 4.9×10⁻⁴ m3/MMBtu.
2.1.5. Biodiesel
To calculate the temporal and spatial differences in water footprints for biodiesel, we combine water footprint estimates from Gerbens-Leenes et al [47] and Mekonnen & Hoekstra [48] with biofuel reports from the US Department of Agriculture (USDA) and EIA. The USDA Foreign Agriculture Service provides annual reports for many of the large biofuel producing countries; see Supporting Information Text S1 (stacks.iop.org/ERL/15/114015/mmedia). Using these estimates, we determine a weighted water footprint based on produced volume of each fuel source. We compute estimated biodiesel yield based on feedstock from Mekonnen and Hoekstra [48]. When country-specific estimates were not available, we estimate the major sources of biodiesel from the regional estimates in Lienden et al [49]. In many countries, animal fat is a key source for biodiesel production. We estimate the water consumption intensity for animal fat-derived biodiesel is 217 m3/GJ, average from meat products [21]. Another common component of biodiesel production is used cooking oil, which we assume to have a water footprint of zero as it is a waste product.
Per the UN trade definition, the biodiesel category must contain less than 70% petroleum based fuels. This creates a wide range of uncertainty in the actual biodiesel content of the trade. To account for this uncertainty, we set the mean value to be 50% biodiesel, the minimum to be 30% biodiesel, and the maximum to be 70% biodiesel. The remainder of the mix is made up with petroleum based diesel with an estimated average water footprint of 0.08 m3/kg of fuel (0.038 m3/MMBtu).
2.1.6. Firewood and charcoal
For firewood and charcoal, we rely on the recent study by Schyns et al [50] to inform the water footprint of wood-based products. Schyns et al [50] attributes the water consumption of forests based on an economic evaluation of the wood product relative to other forest products. These values include both the green and blue water footprints of wood products, on a globally gridded scale for 2010. We aggregate the values to the country-scale to determine the average, minimum, and maximum water footprint values. Using values from Speight [51], we assume a roundwood volume to tonne of firewood of 2.08 green m3/tonne, averaging between soft and hardwood. Additionally, we assign a value of 5.92 green m3 per tonne of charcoal, assuming that a majority of the charcoal is wood-based [51]. For country values not included in the computed dataset, we use averaged values from neighboring countries.
2.2. Creating the virtual trade networks
The United Nations Commodity Trade (UN Comtrade) data provide the basis for the analysis [52]. Import and export data were downloaded for all countries from the year 2012 to 2018 for eleven different energy commodities including liquid fuels, solid fuels, and electricity. For this analysis each country is considered a node and each commodity trade between two nodes (countries) is a link. Dataset S8 provides a list of all the countries included in the analysis. Although these data are readily available, the UN does not guarantee data quality and there are many issues with these data requiring additional attention. A list of assumptions to clean the data are provided in Text S3. While these methods introduce some bias into the results, they were necessary assumptions to avoid extreme values skewing the results of the analysis.
3. Results
3.1. The changing global virtual water trade
From 2012 to 2018, the global traded water footprint of energy increased nearly 35%, from 157 to 211 km3 (figure 1). Values for figure 1 are provided in the Supporting Information, table S1. The largest contributors to virtual water trade are fuelwood, oil, biodiesel, and electricity. Charcoal, hydrocarbons (liquified natural gas, propane, and butane), and coal make up less than 4% of the total virtual water trade from 2012 to 2018. Prior to 2018, biodiesel virtual water trade varied between 30 and 40 km3 per year; however, in 2018, the virtual water trade from biodiesel increased to over 50 km3. While representing a relatively insignificant portion of the total, virtual water trade for hydrocarbons increased an order of magnitude from an average of 0.06 km3 in 2012–2013 to an average of 0.65 km3 from 2014–2018, largely driven by liquified natural gas transport. Despite the growth in total virtual water trade for energy over the time period, the share of virtual water trade for electricity remained relatively consistent, around 7.5% of the total.

Figure 1. Increases in global water footprint were largely driven by increases in fuelwood and biodiesel virtual water trade. Panel (a) shows the volume of virtual water trade for energy for each commodity from 2012 to 2018. The percent changes in virtual water trade, water intensity of energy, global energy consumption, global energy trade, as well as nodes and links in the virtual water trade network relative to 2012 values are shown in panel (b).
Download figure:
Standard image High-resolution imageThe number of components (nodes and links) of the virtual water trade network remained relatively consistent across the study; see figure 1(b). However, both the amount of energy, in gigajoules, traded between countries (GJ Trade) and the total virtual water (VW) trade volume increased. The result is such that the virtual water intensity (m3/GJ) of energy trade has increased steadily since 2012, from 0.26 to 0.32 m3/GJ. Interestingly, the changes in total traded energy and virtual water increased at a faster rate than the total global energy consumption. This trend suggests an increasingly globalized market of energy resources as a primary driver of changes in virtual water trade.
3.2. The virtual water trade network
Using chord diagrams, we visualize the virtual water trade networks for 2012 and 2018 and commodity specific components of the 2018 virtual water trade network (figure 2). These virtual water flows are aggregated at the regional level as defined by the United Nations [53]. Although regional proportions of the global virtual water trade remained relatively constant between years, the volume of virtual water trade changed substantially.

Figure 2. The structure of the trade network as visualized by the largest chord diagrams, remained relatively constant between 2012 and 2018 between regions. The network properties of individual commodities (in 2018) show the dominance of biodiesel and fuelwood in few regions and minimal inter-continental electricity trade. Global regions and subregions are defined by the United Nations [53]. Chord diagrams are not to scale relative to each other. Chords connected to the outer ring represent exporting region and disconnecting arrows show imports. Color schemes are grouped by UN region, see figure S1. Chord diagrams were developed in conjunction with the iGraph [54] and circlize packages [55] in R.
Download figure:
Standard image High-resolution imageBiodiesel has a large virtual water trade with a majority of its commodities exported from either South America (mostly Argentina and Brazil) or Western Europe. A majority of the virtual water for biodiesel is consumed within Europe. Similarly, for fuelwood, Europe operates as both a major importer and exporter of virtual water. North America also exports a significant portion of the virtual water associated with fuelwood. For example, in 2018, the largest link of virtual water trade was between the USA and the United Kingdom of Great Britain and Northern Ireland (North America and Northern Europe) with over 99% of the water volume attributed to fuelwood (table 1). Both biodiesel and fuelwood are water-intensive energy sources and their imports and exports are generally concentrated in developed countries in North America and Europe. Oil has the most homogeneous commodity trade with more regions participating in a denser trade network. Finally, electricity represents an interesting case study as it is bound by infrastructure limitations (transmission lines). As one would expect, there is minimal inter-region trade with the exception of the large combined European network. There are some small inter-region transfers from Western Asia to Eastern Europe and Eastern Europe (Russian Federation) to Eastern Asia.
Table 1. The ten largest links in 2012 and 2018 comprised 22% and 20% of the total global virtual water (VW) trade, respectively. European countries, USA, Canada, and Argentina are partners in most of the largest virtual water trades.
| 2012 | ||||
|---|---|---|---|---|
| Ranking | VW Trade (km3) | Origin | Destination | Main commodity (%) |
| 1 | 8.46 | USA | Canada | Fuelwood (72%) |
| 2 | 5.75 | Argentina | Spain | Biodiesel (99%) |
| 3 | 3.67 | Argentina | Netherlands | Biodiesel (99%) |
| 4 | 3.00 | Canada | USA | Crude Oil (43%) |
| 5 | 2.95 | Chile | Japan | Fuelwood (100%) |
| 6 | 2.31 | Russian Federation | Finland | Fuelwood (90%) |
| 7 | 2.18 | Netherlands | Germany | Biofuel (55%) |
| 8 | 2.11 | USA | Turkey | Fuelwood (99%) |
| 9 | 1.91 | Germany | Austria | Fuelwood (69%) |
| 10 | 1.90 | Netherlands | Belgium | Biodiesel (42%) |
| 2018 | ||||
| 1 | 7.78 | USA | United Kingdom | Fuelwood (98%) |
| 2 | 5.39 | Argentina | Netherlands | Biodiesel (99%) |
| 3 | 5.05 | USA | Canada | Fuelwood (56%) |
| 4 | 4.61 | Canada | USA | Crude Oil (48%) |
| 5 | 4.25 | USA | Japan | Fuelwood (98%) |
| 6 | 3.86 | Argentina | Spain | Biodiesel (99%) |
| 7 | 3.05 | Argentina | Belgium | Biodiesel (99%) |
| 8 | 2.77 | Netherlands | Germany | Biodiesel (64%) |
| 9 | 2.61 | Netherlands | Belgium | Biodiesel (65%) |
| 10 | 2.60 | Argentina | Malta | Biodiesel (100%) |
Table 1 illustrates the important roles that fuelwood and biodiesel play in the global virtual water trade, especially in the largest links. This impact is due to biofuels' comparatively large water footprint, as total traded energy (GJ) for fuelwood and biodiesel is equivalent to roughly 1.5–2% of the traded energy of oil. In all but one of the largest ten links for both years, the two commodities were the major contributor of virtual water trade along the link. The largest exporter of virtual water for both 2012 and 2018 was the United States (USA) with 18.4 and 26.0 km3 exported, respectively. Argentina was the second largest exporter in both years. In 2012, the Netherlands and Italy were the largest importers of virtual water with 12.2 and 11.4 km3 imported, respectively. The Netherlands remained the largest importer of virtual water in 2018, but the United Kingdom of Great Britain and Northern Ireland was a close second, largely driven by fuelwood imports from the United States. Text S4 and figure S2 provide further discussion of the structure of the virtual water trade network.
3.3. Uncertainty
The coupled uncertainty of integrating multiple databases and estimates of water intensity for energy resources results in a large range of variability surrounding our estimates. In 2018, the estimated minimum and maximum values for virtual water trade value were 100 and 450 km3, respectively, compared to the mean estimation of 211 km3. This range is mostly driven by the estimates of water intensity for oil extraction and refining (figure 3). Additionally, there is notable uncertainty surrounding fuelwood water use estimates. The small uncertainty range for electricity is a reflection of our static treatment of hydroelectricity, despite inclusion of a range of water intensity estimates for all other electricity generating technologies. We acknowledge these values would vary both intra- and inter-annually with a plausible range of estimates not accounted for in this study. There is additional uncertainty in using averages and ratios in the calculation of the water footprint of energy, which are, at present, unavoidable due to data availability. While the uncertainty in our estimations is large, there is great value in knowing even the order of magnitude of global virtual water trade as our most recent estimate prior to this work is for 2010 and excludes biofuels. Despite this, we acknowledge that this study would be greatly improved through a better understanding of regional oil extraction and water use practices as well as increased understanding of temporal changes to hydroelectric water intensities.

Figure 3. The largest sources of uncertainty in the analysis are estimates of oil and fuelwood water use. The bounds of the estimates for electricity are small compared to other commodities because the uncertainty in water consumption from hydroelectricity is not included. A static value (i.e., no range) was applied for each country across the years.
Download figure:
Standard image High-resolution image4. Discussion
4.1. Contextualizing the virtual water trade volume
A volume of over 200 km3 is difficult to conceptualize. This section provides comparisons to the hydrologic cycle and other aspects of the food-energy-water nexus to help put the virtual water trade of energy in context. For example, the total discharge of the Mississippi River in 2018 was approximately 471.6 km3 (USGS gauge 07 374 525); total global virtual water trade for energy for the same year is equivalent to about 45% of this volume. Total virtual water trade across the globe is estimated between 2.33 and 3.11×10³ km3 per year [56]. Our estimates for virtual water trade of energy in 2018 represent approximately 6.8-9.1% of that total. As part of the broader food-energy-water nexus, global blue and green virtual water trade for food was estimated to be 672 km3 in 2008 [24]. Our results suggests that, while the water footprint for food is larger, the virtual water trade of energy is not insignificant on the global scale when considering indirect redistribution of water resources.
The total water demand of energy resources has been quantified at multiple spatial scales. One study estimated global water use for electricity and heat to be 378 km3 per year [41]. While our analysis includes other commodities such as primary fuels for electricity and transportation fuels, the results suggest a significant portion of total global water-for-energy is traded outside the borders of the country of origin. Previous studies of biofuel virtual water trade, including blue and green water resources, estimate a total virtual water flow of 7.31 km3/year [57]. Comparatively, our analysis suggests that this volume is greater at approximately 38.8 km3/year. Another study estimates the virtual water trade at a sub-country scale for the United States, using electric grid balancing authorities, to be 9.21 km3 in 2016 [30]. Globally, in that same year, we estimate that 14 km3 of virtual water was traded between countries for electricity, with 1.15 km3 between countries in North America. Studies assessing the provincial virtual water trade of electricity in China suggest varying numbers from 0.6 km3 in 2011 [58] to 5.6 km3 in 2015 [59]. For comparison, we calculate that China's exports of virtual water to other countries (mostly Southeast Asia) were less than 0.08 km3 in 2015. The relative scale of these sub-country estimations versus their inter-country counterparts suggests the importance of understanding both intra- and inter-country virtual water trade of electricity.
4.2. The impact of hydroelectricity on electricity virtual water
In a previous estimate of country-level virtual water trade, Chini and Stillwell [31] evaluated the country-to-country virtual water trade of the European electric grid. In 2017, the last year of the study, an estimated 0.49 km3 was traded between countries, not accounting for hydroelectric generation. In this study, we estimate 4.5 km3 of virtual water for electricity originating from European countries for the same year, illustrating the large impact of hydropower generation on water footprints for electricity.
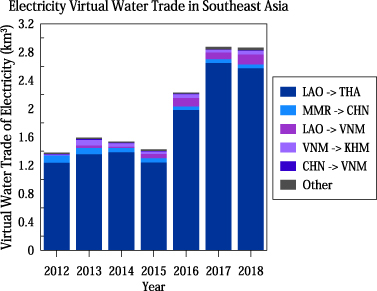
Additionally, virtual water trade of electricity in Southeast Asia doubled from 2012–2018; see figure 4. A majority of this virtual water trade is associated with electricity trade between Laos (LAO) and Thailand (THA). Laos' electric grid is predominantly comprised of hydroelectricity, 72% in 2017 [60], with its dams situated in the Mekong river basin [61]. Laos has championed itself to become a hub of electricity production and sale in the region, working on agreements to extend its electricity exports beyond its bordering countries through their neighbor's grids [62]. The expansion of Laos's electricity exports has implications for both virtual water trade and ecosystem health, with many concerns surrounding the increased number of dams in the Mekong River Basin.
Figure 4. The five largest virtual water trade links for electricity in Southeast Asia involve Laos (LAO), Thailand (THA), Myanmar (MMR), China (CHN), Vietnam (VNM), and Cambodia (KHM). The largest of these links is between Laos and Thailand.
Download figure:
Standard image High-resolution image
4.3. Biofuels and fuelwood
Biomass fuel sources such as firewood and charcoal are important fuel sources in developing countries [63, 64] where access to more advanced energy sources, such as electricity, is unreliable or unavailable. Interestingly, however, a majority of the fuelwood trade occurs between developed regions, such as North America or Europe, and to a lesser extent in Eastern Asia (figure 2). African regions are underrepresented in the virtual water trade. Therefore, it is possible that there is underestimation of this category through unreported fuelwood trade in less-developed countries. Additionally, in underdeveloped countries, the majority of fuelwood could be sourced locally as opposed to through international trade.
According to the International Energy Agency, global production of biofuels is projected to expand at 4% annually from 2018 to 2030 [65], increasing from 3.7 million TJ to 10.6 million TJ. However, biofuels can be water intensive [43] and compete with food security concerns [66].
4.4. Limitations
Limitations to this study are predicated on assumptions in the methodology and data availability. These assumptions, however, were necessary to construct the global virtual water trade network. First, the UN Comtrade data had several data errors that needed to be addressed. Utilizing monetary unit values based on expected trade value per unit to fill gaps induces some bias in our results as not all commodity trade values are equal. Additionally, there is a significant range of water intensity values in the literature for many of the energy commodities, specifically oil, fuelwood, and biodiesel. An assumption made in this study was that oil refining occurred in the country of origin; that is, not-crude oil exports had an assumed water intensity of the summed crude oil extraction and refining process. This assumption could cause double counting of the water footprint in cases where crude oil is imported into a country before being refined and then re-exported. Acknowledging this, we chose to conservatively overestimate the water footprint of oil given the lack of literature and other sources detailing country-level refining practices. With respect to fossil fuels, we also exclude the water footprint of 'production' linked to ancient water consumption [67]. Finally, while we include estimates of biodiesel in the virtual water trade network, we do not account for bioethanol trade. Bioethanol is not specified as an individual commodity in the UN Comtrade database and is instead blended into refined fuel oils, accounting for 0–15% of total volume. It is not practical to disaggregate these values from refined oil transports due to varying global and region-specific policies on fuel mixes. We acknowledge that not accounting for bioethanol has the potential to underestimates the total value of global virtual water trade given the high water-intensity of the fuel [43].
5. Conclusion
In this study, we build on previous water footprint and energy-water nexus studies to create an integrated virtual water trade network across seven years and eleven energy commodities. The trade network remains stable over time, with the number of nodes (countries) and links (trade) changing minimally. However, the volume of virtual water trade increased 35% from 2012 (157 km3) to 2018 (211 km3). The water intensity of these trade links also increased steadily between 2012 (0.26 m3/GJ) and 2018 (0.32 m3/GJ). The largest contributor to virtual water trade is fuelwood, with a trade network concentrated in Europe and North America. Biodiesel is another significant contributor to virtual water trade with exports mainly from South America and Western Europe and imports across Europe. Biodiesel and fuelwood both have large water consumption per unit energy and their contribution to total energy provided is small compared to other energy sources (e.g., oil).
The virtual water trade network for oil is the most dense and homogeneous with commodity trade across all regions of the globe. However, this network also has the largest uncertainty. The virtual water trade network of electricity is limited by infrastructure (e.g., transmission lines), but still contributes notably to the total virtual water trade of energy. We highlight that the electricity water footprint is influenced greatly by the water footprint of hydroelectricity. Coal and lignite, charcoal, and hydrocarbons collectively contribute less than 4% of the total virtual water trade. The contribution of hydrocarbons to the global water trade network is relatively small, but increasing. As non-conventional extraction methods become more prevalent globally, they will continue to compete with other water demands, potentially exacerbating water scarcity concerns in arid locations [68].
Despite the significant contribution of this estimate of global virtual water for energy trade, there are many areas of future investigation that would dramatically improve the results presented here. For example, establishing regional- or country-specific oil water footprints would greatly reduce the uncertainty in our estimates, given its large contribution to total virtual water trade for energy (∼ 22–25%). A better understanding of the inter- and intra-annual variability of water consumption for hydroelectricity would also reduce uncertainty considerably. However, given the current data availability, we feel confident that this work can contribute, at a minimum, a comprehensive first-order estimate of global virtual water trade for energy, and provide a platform for future expansion on this body of work in global water trade and water scarcity analyses.