

Abstract
A stronger than global mean warming trend is projected over Central Asia in the coming century. Based on the historical simulations and projections under four combined scenarios of the Shared Socioeconomic Pathways and the Representative Concentration Pathways (SSP1-2.6, SSP2-4.5, SSP3-7.0 and SSP5-8.5) provided by 15 models from the Sixth Phase of Coupled Model Intercomparison Project (CMIP6), we show a comprehensive picture of the future changes in precipitation over Central Asia under rapid warming and investigate possible mechanisms. At the end of the twenty-first century, robust increase of annual mean precipitation under all the scenarios is found (4.23 [2.60 to 7.36] %, 10.52 [5.05 to 13.36] %, 14.51 [8.11 to 16.91] %, 14.41 [9.58 to 21.26] % relative to the present-day for SSP1-2.6, SSP2-4.5, SSP3-7.0 and SSP5-8.5, respectively). The response of precipitation to increasing global mean temperature shows similar spatial patterns for the four scenarios with stronger changes over Tianshan mountain and the northern part of Central Asia. Further analysis reveals a wetting trend in spring and a drying trend in summer in both the north of Central Asia (NCA) and south of Central Asia (SCA). The wetting trend in spring is balanced by the increase of evaporation, while the drying trend in summer is mainly contributed by the decrease of vertical moisture advection. The thermodynamic effects associated with humidity changes contribute to the drying trends in both the two domains, while the dynamic effects favor for the drying trend in NCA and offset the drying trend in SCA. The response of precipitation to increasing temperature results in enhanced seasonalities for SCA and NCA, and an advancing of the first peak from summer to spring in the NCA.
Export citation and abstract BibTeX RIS

Original content from this work may be used under the terms of the Creative Commons Attribution 4.0 license. Any further distribution of this work must maintain attribution to the author(s) and the title of the work, journal citation and DOI.
1. Introduction
Central Asia is one of the largest semi-arid to arid region in the word located in the hinterland of Eurasian continent (Lioubimtseva and Cole 2006). The term 'Central Asia' including five Asian republics of the former Soviet Union, viz. Kazakhstan, Uzbekistan, Turkmenistan, Kyrgyzstan and Tajikistan (Lioubimtseva and Henebry 2009). This region is characterized by typical continental climate with scarce precipitation compared with surrounding areas (figure 1(a); Lioubimtseva and Cole 2006; Schiemann et al 2008). The relatively infertile soil and sparse vegetation cover in Central Asia can lead to fragile ecosystem, which is sensitive to global climate change (Li et al 2015, Hu et al 2016, Yuan et al 2017). In addition, Central Asian economies still rely on primary industries including agriculture which is highly sensitive to the changes in local hydrological cycle (Gessner et al 2013, Varis 2014). The changes in precipitation strongly affect the people's livelihood and fragile environment in Central Asia.
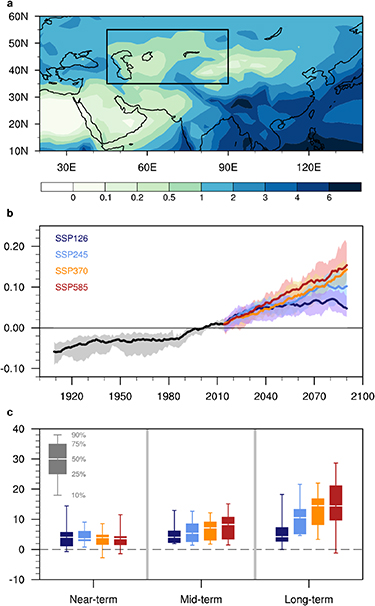
Figure 1. (a) Multimodel medians of climatological annual mean precipitation (mm day−1) derived from historical simulation in 1995–2014. (b) Time series of annual mean precipitation anomalies (mm day−1; 20-year running mean) relative to the present-day average (1995–2014) over Central Asia (black box in figure a). Historical (black), SSP1-2.6 (dark blue), SSP2-4.5 (light blue), SSP3-7.0 (yellow), and SSP5-8.5 (red) simulations by 15 CMIP6 model ensembles are shown in 25th and 75th (shading), and 50th (thick line) percentiles. (c) Projected changes for the near-term (2021–2040), mid-term (2041–2060) and long-term (2081–2100) relative to the present-day average (1995–2014) in averaged Central Asian precipitation (%) under SSP1-2.6 (dark blue), SSP2-4.5 (light blue), SSP3-7.0 (yellow), and SSP5-8.5 (red) scenarios. Bow-whisker plots show the 10th, 25th, 50th, 75th and 90th percentiles.
Download figure:
Standard image High-resolution imageA warming of 0.85 [0.65 to 1.06]°C is observed in global mean temperature during 1880–2012 and has enormous impacts on global and regional climate changes (Hartmann et al 2013). As one of the hot spots of global warming, Central Asia warms with a rate of 0.18 °C decade−1 in last century twice as large as the global mean rate (Giorgi 2006, Chen et al 2009). The human influence can be detected in the observed changes in both temperature (Peng et al 2019) and precipitation (Peng et al 2018). In addition, a stronger than global mean warming trend is projected for Central Asia in the twenty-first century and the changes are statistically significant (Christensen et al 2013, Mannig et al 2018, Peng et al 2020). The projected precipitation changes are less clear and not fully consistent (Christensen et al 2013). As a response to global warming, significant increases of annual mean precipitation and interannual variations are found over most of Central Asia relative to present day (Wu et al 2013, Huang et al 2014). The increasing trend in cold season is larger than the trend in warm season (Yu et al 2018), while another study projected a drying trend in summer (Mannig et al 2018) based on more models.
Previous studies on precipitation projection over Central Asia mainly focused on annual mean precipitation, barely any work has done on physical mechanisms (Wu et al 2013, Huang et al 2014, Mannig et al 2018, Peng et al 2019). Yu et al (2018) studied the future changes in annual cycle of precipitation but neglected the regional features. Different characteristics of the annual cycle for sub-regions of Central Asia has been observed (Schiemann et al 2008, Bothe et al 2012). The shifts in seasonal precipitation and regional characteristics also have important effects especially for agriculture over this region (Gessner et al 2013). Intensified annual range and delayed phase of precipitation in global and monsoon domains have been observed in recent decades and projected in twenty-first century (Chou and Lan 2012, Chou et al 2013, Huang et al 2013, Dwyer et al 2014, Zhang et al 2019). Recently, Phase 6 of the Coupled Model Intercomparion Project (CMIP6) has provided the latest outputs of near 30 models developed by different institutes all over the world for ScenarioMIP, which is designed for climate projection under different emission scenarios. The new phase of CMIP involving improved climate models and more modelling groups are expected to yield more reliable projections (Eyring et al 2016). Based on these outputs, we aim to provide a comprehensive picture to understand the future changes in precipitation over Central Asia. Specifically, we want to answer the following questions: (1) How does the annual mean precipitation respond to global warming over Central Asia? (2) How does the annual cycle of precipitation changes? (3) What processes contribute to the changes in precipitation? These issues have important implications for water sources, agriculture, ecosystems and economies over this arid region.
2. Data and methods
2.1. CMIP6 model simulations
Multimodel simulations and projections from CMIP6 archive are used in this study (table 1; Eyring et al 2016). Based on monthly data availability, including precipitation, evaporation, near surface air temperature, specific humidity, horizontal wind and vertical velocity, the historical simulations and projections under four scenarios (SSP1-2.6, SSP2-4.5, SSP3-7.0 and SSP5-8.5) from 15 models are analyzed. The scenarios are the combination of Shared Socioeconomic Pathways (SSPs; O'Neill et al 2017) and forcing levels of the Representative Concentration Pathways (RCP). Only the first realization (r1i1p1) from each model is used. The outputs are interpolated onto the same resolution of 2.5° × 2.5° by the bilinear interpolation method to avoid the interpolation from low-resolution to high-resolution.
Table 1. CMIP6 models and corresponding institutions.
| No | Model | Modelling group |
|---|---|---|
| 1 | BCC-CSM2-MR | Beijing Climate Center (China) |
| 2 | CanESM5 | Canadian Centre for Climate Modelling and Analysis (Canada) |
| 3 | CESM2 | National Center for Atmospheric Research (USA) |
| 4 | CESM2-WACCM | |
| 5 | CNRM-CM6-1 | Centre National de Recherches Météorologiques, Centre Européen de Recherche et de Formation Avancée en Calcul Scientifique (France) |
| 6 | CNRM-ESM2-1 | |
| 7 | EC-Earth3-Veg | EC-Earth-Consortium |
| 8 | EC-Earth3 | |
| 9 | FGOALS-g3 | Institute of Atmospheric Physics, Chinese Academy of Sciences (China) |
| 10 | GFDL-ESM4 | Geophysical Fluid Dynamics Laboratory (USA) |
| 11 | IPSL-CM6A-LR | Institut Pierre Simon Laplace (France) |
| 12 | MIROC-ES2 L | Atmosphere and Ocean Research Institute (The University of Tokyo), National Institute for Environmental Studies, and Japan Agency for Marine-Earth Science and Technology (Japan) |
| 13 | MIROC6 | |
| 14 | MRI-ESM2-0 | Meteorological Research Institute (Japan) |
| 15 | UKESM1-0-LL | Met Office Hadley Centre (UK) |
2.2. Analysis method
2.2.1. Moisture budget
A moisture budget analysis is used to investigate possible mechanisms responsible for the changes in precipitation (Seager et al 2010, Chou and Lan 2012), which can be expressed as

where P, E and q are precipitation, evaporation and specific humidity, respectively.  and
and  are horizontal wind and vertical velocity, respectively. < > denotes a vertical integration from surface to tropopause. Thus,
  and
and  represent the horizontal moisture advection and vertical moisture advection, respectively.
  is the residual term, which is attributed to sub-seasonal transient eddies.
Neglecting the small changes in the tendency term, the changes in precipitation are balanced by those in evaporation and moisture advection, which is written as

where ( )' denotes the monthly anomalies relative to the climatology. The horizontal moisture advection  and the vertical moisture advection term
  can be further divided as

and the first (second) term on the right-hand side of each equation is defined as the thermodynamic (dynamic) component of the horizontal/vertical moisture advection term, while the last term denotes the nonlinear component. The thermodynamic term is associated with the changes in specific humidity mainly directly induced by temperature changes as atmosphere circulations are fixed, while the dynamic term reflects the contribution of atmospheric circulation changes on precipitation.
2.2.2. Response to global warming
To investigate the response of moisture fluxes (e.g. precipitation, evaporation and other moisture budget terms) to global warming, the related variables and global mean surface air temperature are first averaged over decade every 5 years to remove interannual variability (Collins et al 2013, Zhang et al 2019). Starting from 2016, the averages of 2016–2025, 2021–2030, up to 2091–2100 is calculated to get a time series of 16 values. Then the linear regression between the smoothed variables and global mean surface air temperature is calculated and referred to as the response to global warming.
2.2.3. Definition of specific periods
The baseline period of 1995–2014 in historical simulations is referred to as the 'present-day'. And the periods of 2021–2040, 2041–2060 and 2081–2100 under different emission scenarios represent 'near-term', 'mid-term' and 'long-term', respectively.
3. Results
3.1. Changes in annual mean precipitation
CMIP6 models show increasing trends of annual mean precipitation throughout the 20th and 21th centuries over Central Asia under different scenarios (figure 1(b)). The increasing rates are comparable among four scenarios in the near term (figure 1(c)). Continued increases in annual mean precipitation during the 21th century can be seen for SSP3-7.0 and SSP5-8.5, while the trends turn to negative after 2080 for the other two scenarios. Thus, significant differences can be seen for the long-term changes under different scenarios. Compared with the present-day climate (1995–2014), the robust increase reaches 4.23 [2.60 to 7.36 for the interquartile range] %, 10.52 [5.05 to 13.36] %, 14.51 [8.11 to 16.91] %, 14.41 [9.58 to 21.26] % in long-term (2081–2100) for SSP1-2.6, SSP2-4.5, SSP3-7.0 and SSP5-8.5, respectively. The model spread for precipitation changes is larger for higher emission scenarios, which can be partly attributed to the larger uncertainty of the changes in surface air temperature associated with larger radiation forcing (figure S1 (stacks.iop.org/ERL/15/054009/mmedia); Roe and Baker 2007, Zhou and Chen 2015). And a large heterogeneity of model uncertainty can be found as in other regions (Tabari and Willems 2018, Tabari et al 2019), with a larger model spread in the south of Central Asia under all scenarios (figure S2).
The sensitivities of precipitation to global mean surface air temperature increase under the four scenarios are given in figure 2. Annual mean precipitation exhibits robust increase with warming over most part of Central Asia, especially the Tianshan mountain and the northern part of Central Asia as in previous studies (Huang et al 2014). The regions with larger response rates of annual mean precipitation to global warming also have more precipitation in present-day climatology (figure 1(a)). The wet-getting-wetter pattern implies that the effect of increasing moisture on the CA rainfall may be dominant under global warming. A comparison between different scenarios reveals a decrease of response rate accompanied with higher emission as in previous studies (Wu et al 2010, Hegerl et al 2015). Area-averaged annual mean precipitation increases with warming at the rates of 5.93 [0.27 to 10.09] % K−1, 4.22 [2.88 to 5.73] % K−1, 4.46 [2.71 to 5.09] % K−1 and 3.47 [2.23 to 4.76] % K−1 for SSP1-2.6, SSP2-4.5, SSP3-7.0 and SSP5-8.5, respectively. The results of SSP2-4.5 and SSP3-7.0 are close to each other as the annual mean precipitation changes under these two scenarios are indistinguishable until 2080 (figure 1(b)). Though the response rate is highest for SSP1-2.6, the areas covered by positive signals are smaller compared with other scenarios as insignificant negative responses can be found over the southeast of Uzbekistan and Turkmenistan (figure 2(a)).
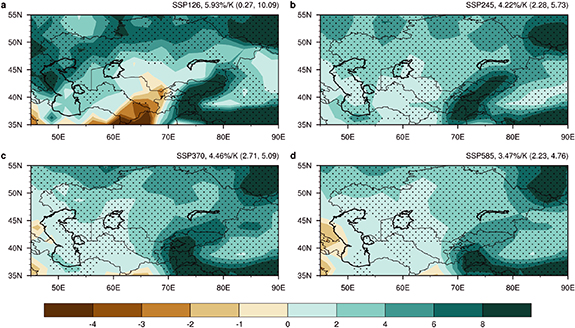
Figure 2. Multimodel medians of annual mean responses (% K−1) of precipitation to global-mean surface air temperature increases under (a) SSP1-2.6, (b) SSP2-4.5, (c) SSP3-7.0 and (d) SSP5-8.5 scenarios. The dots indicate where at least two-thirds of the models agree on the sign of response. Multimodel medians of area-averaged responses as well as the interquartile ranges are shown in the top right corner.
Download figure:
Standard image High-resolution image3.2. Changes in the annual cycle of precipitation
In addition to the changes in annual mean precipitation, changes in the annual cycle also have important effects on water safety in CA. We first examine the annual cycle of area-averaged climatological precipitation over the north of Central Asia (NCA,  ) and south of Central Asia (SCA,
  ) in different periods under the four scenarios (figure 3). Modulated by the meridional shift of subtropical westerly jet, the precipitation in the NCA and SCA have distinct annual cycle (Schiemann et al 2008, Bothe et al 2012). Consistent with previous studies, two peaks occur in May-July and October-December for NCA and a peak occurs in March-May for SCA can be found in the present-day (black lines). Compared with historical simulations, projected increasing trend in spring and decreasing trend in summer can be found in both the two regions. The changes are more significant in the long-term under higher emission scenario. Besides the changes in the amount of precipitation, a shift of the first peak for NCA can be found for SSP2-4.5, SSP3-7.0 and SSP5-8.5 (figure 3(b)). From the near-term, to mid-term and to long-term, the peak in May-July gradually shifts to March-May, making the annual cycle of precipitation in NCA close to that in SCA. Due to the different annual cycle in these two domains in the present-day (figure 3, black lines), the changes in seasonal mean can result in enhanced seasonalities for both two sub-regions and a shift of the first peak for NCA.

Figure 3. The climatological annual cycle of area-averaged precipitation (mm day−1) over (a) NCA and (b) SCA for mutimodels in present-day (black), near-term (blue), mid-term (yellow) and long-term (red) under SSP1-2.6, SSP 2–4.5, SSP3-7.0 and SSP5-8.5 scenarios. Thick lines indicate multimodel medians while shading indicates the 25th–75th percentile model ranges. NCA:  ; SCA:
  .
.
Download figure:
Standard image High-resolution image3.3. Mechanisms for the changes in annual cycle
To further investigate the physics behind the changes in precipitation under global warming, the moist budget method is performed in the subsequent analysis. The responses of moisture budget terms to global warming are shown in figures 4. Only the results of SSP5-8.5 are shown as the changes under the high emission scenario are the most significant. The changes in precipitation in NCA (figure 4(a), blue line) are similar to that in SCA (red line) with positive responses in winter and spring whereas negative in summer as revealed in section 3.2.

Figure 4. Responses of moisture budget terms to global-mean temperature changes (mm day−1 K−1) under SSP5-8.5 scenario during the period of 2016–2100. Thick lines indicate multimodel medians while shading indicates the 25th–75th percentile model ranges. (a) Precipitation; (b) evaporation; (c) vertical advection term; (d) horizontal advection term. Red lines denote the results for SCA, and blue lines denotes the results for NCA. Responses of thermodynamic component (−<wdq'>), dynamic component (−<w'dq>) and nonlinear component (−<w'dq'>) of vertical advection terms (−<wdq>') to global-mean temperature changes in summer over (e) NCA and (f) SCA.
Download figure:
Standard image High-resolution image
The changes in evaporation coherently couple with the changes in precipitation except the cold winter (figures 4(a) and (b)), suggesting a positive feedback between precipitation and evaporation. The evaporation increases in all the seasons and reaches a peak in spring under global warming (figure 4(b)) consistent with a previous study based on the CMIP5 simulations (Yu et al 2018). The wetting trend (0.075 [0.032 to 0.087] mm day−1 K−1 and 0.020 [−0.027 to 0.052] mm day−1 K−1 for NCA and SCA, respectively) in spring is balanced by the increasing of evaporation (0.078 [0.050 to 0.086] mm day−1 K−1 and 0.041 [−0.017 to 0.056] mm day−1 K−1 for NCA and SCA, respectively). As for summer, the drying trend (−0.021 [−0.073 to −0.007] mm day−1 K−1 and −0.019 [−0.062 to −0.007] mm day−1 K−1 for NCA and SCA, respectively) is dominated by the decreasing trend of vertical moisture advection (−0.046 [−0.096 to −0.037] mm day−1 K−1 and −0.044 [−0.081 to −0.017] mm day−1 K−1 for NCA and SCA, respectively), while the contribution of evaporation and horizontal advection term can be neglected. Besides, the evaporation in spring and the vertical moisture advection in summer during the long-term can be statistically distinguished from that in preset-day at the 5 % level based on Student-t test, showing the changes are robust.
As a vast semiarid to arid region, Central Asia is dominated by descending motion and low-level divergence in summer (Yatagai and Yasunari 1998, Guan et al 2019). So the increase of atmospheric water vapor due to global warming, the thermodynamic effect, can result in the decrease of vertical moisture advection (figures 4(e) and (f),−0.018 [−0.050 to −0.009] mm day−1 K−1 and −0.082 [−0.093 to −0.064] mm day−1 K−1 for NCA and SCA, respectively) in summer, which is the so-call 'dry-getting-drier' mechanism. The larger thermodynamic drying effect in SCA relative to that in NCA corresponds with stronger descending motion in SCA (figure not shown). In contrast, the contributions of dynamic effects are different in these two domains, which contributes to the drying trend in NCA by −0.019 [−0.070 to −0.008] mm day−1 K−1 whereas partly offsets the drying trend in SCA by 0.029 [0.013 to 0.041] mm day−1 K−1. Both the dynamic and thermodynamic components for present-day and long-term are statistical distinguished at the 5 % level. Summer precipitation over Central Asia is modulated by Subtropical Westerly Jet (SWJ) and weakened SWJ can result in less precipitation in NCA and more precipitation in SCA (Zhao et al 2014, 2018). Thus, the different dynamic effects between NCA and SCA may be associated with the changes in SWJ which needs further study.
4. Summary and concluding remarks
The temperature projections reveal a robust warming over Central Asia during the 21st century but the changes in precipitation are less clear. We have investigated the response of the precipitation to global warming using CMIP6 multimodel projections under four scenarios (SSP1-2.6, SSP2-4.5, SSP3-7.0 and SSP5-8.5) and revealed the mechanisms behind the projected changes. The major results are summarized below.
Annual mean precipitation is projected with the continuous increase by 14.51 [8.11 to 16.91] % and 14.41 [9.58 to 21.26] % relative to present-day for SSP3-7.0 and SSP5-8.5, respectively, at the end of the 21st century. Relatively smaller changes are seen in the long-term projection under the other two scenarios, that is 4.23 [2.60 to 7.36] % and 10.52 [5.05 to 13.36] % for SSP1-2.6 and SSP2-4.5, respectively, because the upward trends turn to going down after 2080. The response of precipitation to global warming is stronger for low emission scenario, which is 5.93 [0.27 to 10.09] % K−1 and 3.47 [2.23 to 4.76] % K−1 for SSP1-2.6 and SSP5-8.5, respectively. Relatively stronger increasing trends are located over Tianshan and the north of Central Asia.
Changes on the monthly time scale are less homogeneous. The changes in the annual cycle of precipitation under global warming features a wetting trend in spring and a drying trend in summer both for NCA and SCA. Based on the result of moisture budget, the wetting trend in spring is balanced by the increase of evaporation while the drying trend in summer is mainly attributed to the decrease of vertical moisture advection. The thermodynamic effects associated with humidity changes contribute to the drying trends in both two domains, while the dynamic effects favor for the drying trend in NCA but offset the drying trend in SCA. The response of precipitation to increasing temperature can result in enhanced seasonalities for SCA and NCA and a shift of the first peak for NCA.
This study focuses on the changes in precipitation during the 21st century. As a drought-prone region, the changes in drought conditions over Central Asia are also widely concerned (Li et al 2017, Guo et al 2018). Based on the Surface Wetness Index (SWI, the ratio of annual mean precipitation and evaporation), drought may become even severer in the coming century though increasing precipitation is projected. This result is consistent with a previous study based on Palmer Drought Severity Index (PDSI; Dai 2011). The changes in SWI at the end of 21st century can reach −1.74 [−4.41 to −0.32] % and −1.96 [−6.95 to −0.48] % relative to present-day for SSP1-2.6 and SSP5-8.5, respectively. Adaptation measures for future climate changes should consider both the shift of wet seasons and increased aridity in the coming century over Central Asia.
Acknowledgment
This work is supported by the Chinese Academy of Sciences (Grant No. XDA20060102), International Partnership Program of Chinese Academy of Sciences (Grant No. 134111KYSB20160031) and National Natural Science Foundation of China (Grant No. 41605057). We also acknowledge the support from Jiangsu Collaborative Innovation Center for Climate Change.
Data availability statement
The data that support the findings of this study are openly available at https://esgf-node.llnl.gov/projects/cmip6/.