

Abstract
Using remotely sensed data, we documented changes in land use/land cover (LULC) from 1995 to 2015 and net primary productivity (NPP) from 2000 to 2014 in Central Asia's 415,048 km2 Ili-Balkhash Basin (IBB). This basin, which is shared by China and Kazakhstan, is in the midst of significant socioeconomic transformation due to the collapse of the Soviet Union, the emergence of Kazakhstan, and the economic rise of China. Grazing land covered 82.4% of the IBB in 1995; water bodies and bare land were the only other LULC categories occupying more than 3% of the basin's area. Changes in LULC were most evident on the Chinese side of the border, where crop production areas increased and grazing areas decreased between 1995 and 2015. The area of irrigated cropland in China grew by nearly 30%, primarily in the upper Tekes River valley and along the Ili River near the border with Kazakhstan. In contrast, the irrigated lands in Kazakhstan shifted geographically during this period, but the extent did not change. Expansion of wetlands and permanent water bodies, which occupied 2.1 to 2.9% and 4.6 to 4.7%, respectively, of the IBB in 1995 and 2015, was associated with accretion of Lake Balkhash and Kapchagai Reservoir in Kazakhstan and the construction of new reservoirs in China. NPP of the basin approached 700 g C m−2/year in a few areas but was generally less than half this level and characterized by a declining trend except in highly productive irrigated areas of dense, stable vegetation. NPP decreases of more than −10 g C m−2/year were apparent in mountainous and upland areas, as well as broad band of grassland and cropland in Kazakhstan. Areas surrounding Lake Balkhash were characterized by unstable to moderately stable, often sparse vegetation.
Export citation and abstract BibTeX RIS

Original content from this work may be used under the terms of the Creative Commons Attribution 3.0 licence. Any further distribution of this work must maintain attribution to the author(s) and the title of the work, journal citation and DOI.
1. Introduction
Central Asia is among the most water-deficient and environmentally fragile regions of the world (Asian Development Bank 2010). The disappearing Aral Sea, a terminal water body dependent on inflows from two overexploited rivers, the Amu Darya and Syr Darya, is the best known case in point (Kostianoy and Kosarev 2010). Its surrounding basin is endorheic, i.e.., it lacks an outlet to the ocean, and so the fate of the Aral Sea is dependent on distant natural and anthropogenic events that include snow and glacier dynamics in the mountains, construction of upstream hydro dams, and expansion of irrigated lands and intensification of their use. Climate change, including spatially and seasonally altered precipitation patterns and warming trends (Hartmann 2012, Klein et al 2012, Sorg et al 2012, Chen et al 2013), also threaten the Aral Sea, as do geopolitical disputes unleashed by the dissolution of the Soviet Union (Micklin 2016). It is no wonder that this water body has become emblematic for disrupted dynamic interactions between humans and nature.
In many ways, Central Asia's Ili-Balkhash Basin (IBB) (figure 1) is threatened by even more complex factors. The basin lies to the east of the Aral Sea, spanning the international boundary between Kazakhstan and China. The IBB is less degraded than the Aral Sea and subject to a unique set of exacerbating challenges (Petr 1992, Dostaj et al 2006, Asian Development Bank 2010, Varis and Kummu 2012, Thevs et al 2017b, Pueppke et al 2018a). These include unusually rapid melting of glaciers that provide the main inflows into the basin, rapid expansion of diverse, irrigation-dependent agriculture, the potential basin-wide impacts of China's Belt Road Initiative, and political pressure to preserve the unique natural environment of Lake Balkhash (Dostaj et al 2006, Sorg et al 2014, Mackerras 2015, Hao et al 2018).
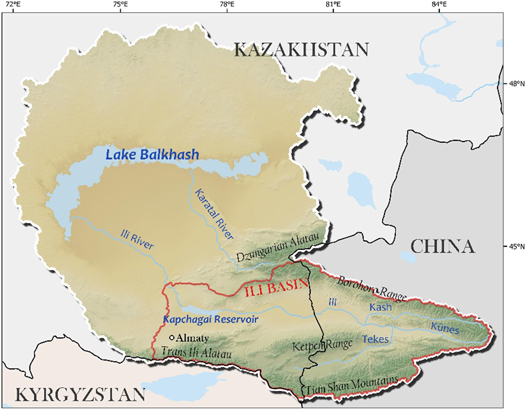
Figure 1. The Ili-Balkhash Basin of Kazakhstan and China. The map identifies the principal mountain ranges that drain into the basin as well as the sub-basin drained by the Ili River (outlined in red).
Download figure:
Standard image High-resolution imageFigure 1 illustrates the location and topography of the IBB. Although the Dzungarian and Trans Ili Alatau provide inflows into the lower, Kazakhstan portion of the basin, about two-thirds of the basin's water comes from snowmelt and glacial runoff originating in mountains that flank the upper, Chinese portion of the valley (Dostaj et al 2006, Thevs et al 2017b). This water descends through alpine meadows, desert steppe, and Marshy wetlands in the Xinjiang Uyghur Autonomous Region of China to create the Kash, Künes, and Tekes rivers. These tributaries eventually coalesce to form the Ili River, which flows more than 1,400 km westward across an increasingly arid landscape into Kazakhstan. The river ultimately forms a triangular, 8,000 km2 delta that supports a mixed riparian community of shrubs and trees that is protected under the terms of the Ramsar Convention (Dostaj et al 2006). It then empties into Lake Balkhash, Central Asia's largest freshwater water body with a surface area of about 16,400 km2.
Prior to intensive human intervention, the Ili River transported about 10 million tons of sediment per year, half of which was deposited in the delta and the other half of which entered the lake (Petr 1992). Annual water inflows from the river were estimated to average about 12 billion cubic meters and fluctuate periodically, causing the level of the lake to rise and fall over time (Abdrasilov and Tulebaeva 1994, Starodubtsev and Truskavetsky 2011, Propastin 2013a). These cycles are due to Central Asia's geography, which creates a sharply continental climate that also causes evaporation and infiltration to exceed precipitation in the basin's arid steppe lands (Depauw 2007).
The above factors underscore the dependence of the IBB on precipitation that falls at high elevations in the surrounding mountains (Lutz et al 2014). Any perturbation of the water flowing down to lower elevations and into the lake will result in significant alterations to ecosystems within the basin. There is unequivocal evidence of climate change in the IBB, and this is causing the glacial areas that charge the basin with water to shrink (Sun et al 2010, Sorg et al 2012, Dietz et al 2014, Russell et al 2018). Such geophysical changes have been accompanied by recent transformations in social systems. These began with the dissolution of the Soviet Union in the early 1990s and the establishment of a newly independent Republic of Kazakhstan and are now being driven by rapid development of China's economy. This has drawn Beijing's attention to development of western regions such as Xinjiang (Olcott 2010, Mackerras 2015, Wu and Zhang 2018) and its resource-rich Uyghur Autonomous Region.
Here we chart the extent to which land use and land cover (LULC) and net primary productivity (NPP) of vegetation have changed in the IBB between 1995 and 2015, a recent period corresponding with the above socioeconomic and environmental changes. Our ultimate goal is to understand the long term implications of these complex systems changes for this fragile basin. We rely on analysis of remotely sensed images, a widely used method to assess changes in land cover and vegetation (Giri 2012). This approach has been applied previously to assess LULC and NPP in Central Asia at scales ranging from the entire region or entire countries (Feng et al 2007, Peng et al 2008, Klein et al 2012, Chen et al 2013, Eisfelder et al 2014, Hu and Hu 2019) to sub-basins, lakes, or smaller features such as the Ili River delta (Christiansen and Schöner 2004, Luo et al 2015, Thevs et al 2017a, Hao et al 2018, Jiao et al 2018, Luo et al 2019, Samat et al 2019, Zhang et al 2019). Although often constrained by political boundaries, these studies have yielded important information relevant to LULC and NPP of the IBB at coarse and very fine scales. To our knowledge, ours is nevertheless the first attempt to comprehensively scale such analysis to the entire IBB without regard to political boundaries.
2. Methodology
2.1. Geographic setting
Central Asia's IBB lies between 72° and 86° East and 44° and 49° North (figure 1) and encompasses 415,048 km2 of area. The Ili River drains about 115,700 km2, which is almost equally distributed between Kazakhstan and China and provides roughly three-quarters of the basin's inflows (Kezer and Matsuyama 2006, Akiyama et al 2012). The remainder of the IBB lies within the borders of Kazakhstan, where smaller rivers and streams provide lesser amounts of water, most of which enter the eastern portion of Lake Balkhash. Although some of the smaller rivers have been diverted for irrigation, it is the area surrounding the Ili River and its tributaries that has been most intensively impacted by human activities, especially agriculture (Dostaj et al 2006, Pueppke et al 2018b). These areas thus have been subject to the greatest change in terms LULC and are the focus of the current study.
2.2. Data acquisition
This study relies on remotely sensed images from Landsat satellites and products derived from MODIS data. Included are surface reflectance images from Landsat 5 Thematic Mapper (TM) and Landsat 8 Operational Land Imager (OLI). The TM images were obtained for the years 1994–1996 with all available scenes covering the entire IBB. OLI images were obtained for the years 2014–2016 covering the same region. Products from MODIS include annual NPP data (MOD17A3) for 2000–2014. Global yearly surface water classification history data for 1991–1995 and 2011–2015 were provided by the Joint Research Centre (JRC) of the European Commission (Pekel et al 2016). Digital Elevation Model (DEM) data covering the IBB were obtained from the Shuttle Radar Topography Mission (SRTM) (available online at https://www2.jpl.nasa.gov/srtm/), and watershed boundaries are from HydroBASINS (available online at http://www.hydrosheds.org/page/hydrobasins). Other spatial data including administrative boundary and some ancillary information for cartography use are from Natural Earth (https://www.naturalearthdata.com).
2.3. Data processing and analysis
The overall analytical methods for spatial data processing are given in figure 2. To map the locations of surface water occurrence in 1995 and 2015, we integrated the annual water surface data from the JRC. There are three types of water surface areas: permanent water, seasonal water, and no water. Because of cloud cover and the limited number of available Landsat images (Hao et al 2018), some pixels in the water classification map were missing. We consequently composited five years of data from two time periods, 1991–1995 and 2011–2015. The compositing step first masked out the no-data pixels and then selected the majority of the water occurrence types among the five annual images for each pixel. The composited surface water maps of 1995 and 2015 have coverage percentages of 99.8% and 99.9%, respectively. Change detection was then analyzed for the two composited maps of surface water occurrence.
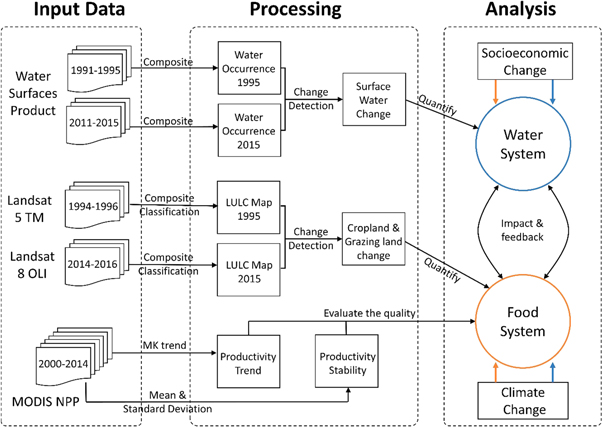
Figure 2. Flowchart of image processing, analysis, and interpretation used in this study.
Download figure:
Standard image High-resolution imageTo generate the corresponding LULC maps, Landsat time-series images from 1994–1996 and 2014–2016 time periods were composited to generate basin-wide images that represent 1995 and 2015, respectively. We first identified cloud-free land and water pixels by masking out cloud and snow pixels using the quality control information in the surface reflectance data product. When no cloud-free pixels were available (in most cases these were permanent snow and ice), we used the least cloudy pixels. We then generated monthly median composites using the images in the same month of the two time periods. This created 12 images representing each month of 1995 and 2015. We further grouped the 12 images into four seasons (January to March, April to June, July to September, and October to December) by selecting the median from each season, resulting in four composited seasonal images for each year. We focused our analysis on two seasons, April-June and July-September, as they correspond to the growing season, when vegetation would be expected to be present.
We then stacked the images from the two seasons and employed the random forest algorithm (Breiman 2001, Pal 2005) for LULC classification. Since topographic information is useful in identifying cropland and grazing land (Zhang et al 2018), we also included DEM-derived slope information as an additional layer in the classification. The map was classified with a resolution of 100 m to reduce noise. Training samples were obtained by drawing sample polygons based on high resolution images from Google Earth and the composited Landsat images using visual interpretation, which covered 17,433 sample pixels for 1995 and 21,255 pixels for 2015. The sample locations were spatially random and stratified among different classes. We used 90% of the data for training and 10% for testing to achieve an overall classification accuracy of 84.3% and 80.3% for the 1995 and 2015 time periods, respectively. The classification error mainly comes from confusion between irrigated cropland and wetland, and between grassland, shrubland, and sparse vegetation (Section 4.1).
NPP data were analyzed to represent the productivity of the grazing land and cropland. First, we conducted a Mann-Kendall (Mann 1945, Kendall 1975, Hipel and McLeod 1994) trend test and mapped the change trend of annual NPP from 2000 to 2014 using the package 'Kendall' in R. Then a production stability indicator was constructed using two criteria: (i) higher coefficient of NPP variation represents lower stability, and (ii) higher mean NPP values represent denser vegetation per unit area. With the 1995 and 2015 LULC maps and water occurrence data, and the 14-year NPP trend and stability data, we applied standard geospatial statistics (De Smith et al 2007) to examine the spatial and temporal patterns of water occurrence, cropland extent, and vegetation productivity.
3. Results
3.1. Changes in LULC between 1995 and 2015
We classified 11 LULC categories based on remotely sensed images from 1995 and 2015 (figure 3). The classes are slight modifications of definitions based on the International Geosphere-Biosphere Programme classification scheme. Three of these categories, irrigated cropland, rain-fed cropland, and grassland (a major source of forage for animals), are strongly related to food production. Two additional categories, shrubland and sparse vegetation, also offer the limited potential for grazing. Additional land cover types include water, wetland, tree cover, bare land, snow and ice, and urban areas. Lake Balkhash, an important source of fish for human consumption (Petr 1992, Timirkhanov et al 2010, Sadyrbaeva 2013, Graham et al 2017), and Kapchagai Reservoir, constructed by the Soviets in the late 1960s for both hydropower and irrigation (Chida 2013), represent the most conspicuous aquatic features of the basin. The city of Almaty, Kazakhstan, is the most visible urban area (figures 1, 3).

Figure 3. Land use and land cover in the Ili-Balkhash basin in the years 1995 and 2015.
Download figure:
Standard image High-resolution imageAs of 1995 irrigated cropland was primarily distributed along the Ili, Künes, and Tekes rivers in the upper valley of China. In Kazakhstan, irrigation was common along the Karatal River (Mirlas et al 2015) and in the Akdala district (Dostaj et al 2006, Pueppke et al 2018b) just upstream of the Ili River delta, as well as on steppes and in smaller valleys extending from the northern slopes of the Trans Ili and Dzungarian Alatau in Kazakhstan, where rivers and smaller streams serve as hydrological channels to transport water down from the mountains (Golomb 1959, Dostaj et al 2006). Most rain-fed cropland was adjacent to and sometimes intermingled with irrigated lands, especially along the Trans Ili and Dzungarian Alatau, as well as in the upper Tekes River valley of China (figure 1), one of the rare areas of the upper basin capable of sustaining crop-based agriculture under natural climatic conditions (Christiansen and Schöner 2004). Higher elevation mountain areas were, as expected, characterized by forest cover and permanent snow. The lower reaches of major waterways, most conspicuously in the Ili River delta but also at the mouths of other rivers draining into Lake Balkhash, were associated with wetlands. Most of the remaining regions of the basin consisted of grasslands in piedmont areas or some combination of grassland, shrubland, sparse vegetation, and bare areas at lower elevations.
Spatial changes in LULC over the past 20 years are most evident in and around agricultural areas in the southeastern portion of the basin (figures 3, 4(A)). In an area near Kapchagai Reservoir in Kazakhstan (figure 4(B)), for example, grazing land shifted to the west and was replaced with expanded cropland, some of it irrigated (figure 3). More dramatic changes in LULC dynamics are apparent along the border between the two countries (figure 4(C)). Chinese irrigation areas south of the Ili River expanded significantly, widening the belt of cropland along the river. New grazing land in China was also evident, but none of these changes, which extend west to the border, characterize LULC in adjacent areas of Kazakhstan. New irrigation areas also appeared in the upper Tekes River valley, primarily in China but also extending into Kazakhstan (figures 3, 4). Most other land use conversion was generally restricted to areas along waterways, including the Ili River delta, where spatial shifts in grazing lands are obvious (figure 4).

Figure 4. Land use and land cover change between 1995 and 2015 in (A) the entire basin, (B) an area southwest of Kapchagai Reservoir, and (C) along the border between Kazakhstan and China. The lettered orange rectangles in (A) identify the areas that are enlarged in (B) and (C).
Download figure:
Standard image High-resolution imageDetails of changes in LULC between 1995 and 2015 are summarized in table 1. Potential grazing land in the form of grassland, shrubland, and sparsely vegetated areas dominated the landscape, collectively covering 82% the basin in 1995 and 2015. Urban areas remained a minor land cover type, but they enlarged considerably during the two decades, especially in China. The expansion of cropland is also obvious, such that by 2015, irrigated and raid-fed areas occupied 13.1% and 0.8%, respectively, of the Chinese side of the basin. Similar increases did not occur in Kazakhstan, where rain-fed cropland declined somewhat and where the area of irrigated cropland was unchanged. On balance, the IBB experienced a 14% increase in irrigated cropland and a slight decrease in rain-fed cropland between 1995 and 2015.
Table 1. The 1995 and 2015 land use and land cover types in the Ili-Balkhash Basin. The basin has a total area of 415,048 km2, of which 57,196 km2 are in China and 357,852 km2 in Kazakhstan.
| Percentage of land use and land cover | ||||||
|---|---|---|---|---|---|---|
| Entire basin | Chinese portion | Kazakhstan portion | ||||
| LULC category | 1995 | 2015 | 1995 | 2015 | 1995 | 2015 |
| Rain-fed cropland | 0.7 | 0.6 | 0.3 | 0.8 | 0.8 | 0.6 |
| Irrigated cropland | 2.8 | 3.2 | 10.2 | 13.1 | 1.6 | 1.6 |
| Tree cover | 1.6 | 1.7 | 6.1 | 6.5 | 0.9 | 0.9 |
| Shrubland | 7.1 | 6.8 | 0.2 | <0.1 | 8.2 | 7.9 |
| Grassland | 45.0 | 43.0 | 57.7 | 55.3 | 43.1 | 41.1 |
| Sparse vegetation | 30.3 | 32.0 | 16.0 | 15.3 | 32.5 | 34.5 |
| Wetland | 2.1 | 2.9 | 1.8 | 2 | 2.1 | 3 |
| Urban | 0.2 | 0.3 | 0.1 | 0.6 | 0.2 | 0.3 |
| Bare areas | 4.3 | 3.6 | 1.8 | 0.6 | 4.7 | 4.1 |
| Water bodies | 4.6 | 4.7 | 0.2 | 0.4 | 5.3 | 5.4 |
| Snow and ice | 1.3 | 1.2 | 5.6 | 5.4 | 0.6 | 0.6 |
The 20 years between 1995 and 2015 were also characterized by expansion of surface water areas in the IBB, especially in China (table 1). Several dams and reservoirs were constructed during this period (figure 5), leading to the creation of new surface water in the highlands flanking the upper valley. The footprints of the recently constructed Zharyntaysky Reservoir on the Kash River and the Kapchagaysky Reservoir on the Tekes River (Spivak et al 2016, Pueppke et al 2018b) were evident in 2015 but not in 1995 imagery. During this time period, Lake Balkhash also grew, especially at its southernmost tip. Wetland areas of the IBB expanded as well, especially in Kazakhstan, where changes were most clear in the Ili River delta and along the shoreline of Lake Balkhash, as well as upstream from Kapchagai Reservoir (figures 4, 5). These observations are consistent with recently recorded rises in the lake level (Propastin 2008), which likely reflect the formation of a new delta where the Ili River enters the reservoir (Starodubtsev 2017).

Figure 5. Observed changes in surface water areas in the IBB basin between 1995 and 2015 on Google Earth. (A) Junction of the Ili River and Kapchagai Reservoir in Kazakhstan; (B) Zharyntaysky Reservoir on the Kash River in China; (C) Kapchagaysky Reservoir on the Tekes River in China.
Download figure:
Standard image High-resolution image3.2. Changes in NPP
NPP, a proxy of crop and food production in the IBB, shows the spatial pattern of the basin's food production ecosystems as of 2014 (figure 6). There is a general declining gradient in NPP from east to west and from south to north, which corresponds generally to rainfall and soil fertility patterns in the basin. Although absolute NPP values approached 700 g C m−2/year in a few locations, most of the basin is much less productive. Relatively high levels of NPP spatial variability characterized mountain slopes, especially those along the ridges of the Trans Ili Alatau, as well as riverine areas and irrigated croplands. Recent NPP trends and their temporal variability from 2000 to 2014 are shown in figure 7(A). There was little NPP change in the desert-like areas near Lake Balkhash, where shrubs and sparse vegetation predominate. In places where large changes are evident, there is an overall NPP decline, sometimes by more than 10 g C m−2/year. This declining trend is especially obvious in the areas across a band of land in Kazakhstan, where the major LULC types include irrigated lands between Kapchagai Reservoir and the front of the Trans Ili Alatau, as well as non-irrigated and some irrigated land to the west and north. Decreases are also evident in the higher elevations and in non-agricultural areas in the southern areas of the basin. In comparison, increases in NPP were found in the irrigation zones of China, especially intensely irrigated areas along the Ili River, as well as in some areas of higher elevations in the eastern extremity of the basin.

Figure 6. Net primary productivity in the Ili-Balkhash basin in 2014.
Download figure:
Standard image High-resolution image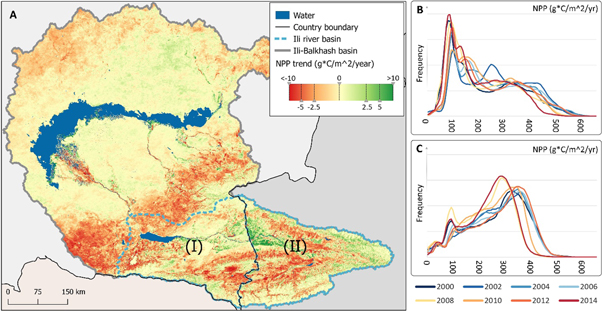
Figure 7. NPP trends in the IBB between 2000 and 2014. (A) Spatial distribution of NPP trends. (B) Frequency distributions of annual NPP on the Kazakhstan side of the Ili River sub-basin, which is designated (I) on the map. (C) Frequency distributions of annual NPP on the China side of the Ili River sub-basin, which is designated (II) on the map.
Download figure:
Standard image High-resolution imageThe frequency distribution of annual variability of NPP is shown in figures 7(B) and (C) for the Kazakhstan and China portions in the IBB, respectively. Although annual variability is evident on both zones, the curves differ greatly. On the Kazakhstan side, they are skewed toward lower NPP values, with a peak between 50 and 150 g C m−2/year, suggesting that the majority of the land on the Kazakhstan side of the basin is characterized low NPP. The curves from the Chinese side of the basin are skewed toward higher NPP values in the range of 300 to 450 g C m−2/year, with contours closer to a normal distribution. These contrasting distributions are consistent with the observation that the majority of productive, intensively managed irrigated lands are in China and not in Kazakhstan, which relies on more arid grazing lands that are managed with little or no human intervention (figure 3).
Given the arid environment and increasing climate variability in the basin, it is of great interest to determine the sensitivity and variability of food production as an indicator of socioeconomic development potential. Examination of the annual variability in NPP permits identification of priority areas for farming and grazing. We consequently quantified the mean value and temporal coefficient of variation (CoV) in NPP from 2000 to 2014 and analyzed the variability of production in cropland and grazing land as a potential indicator of climate impact. Using mean values expressed as g C m−2/year, we classified the basin into categories corresponding to sparse vegetation (mean NPP ≤ 100.2), vegetation (mean NPP > 100.2 and ≤ 162.2), and dense vegetation (mean NPP > 162.2). Using CoV values, we then classified the basin into three additional categories: stable (CoV ≤ 0.0936), moderately stable (CoV > 0.0936 and ≤ 0.1338), and unstable (CoV > 0.1338). NPP and CoV values were integrated to arrive at the spatial distribution of productivity (figure 8).

Figure 8. Temporal variability of NPP in the IBB as determined by analysis of CoV.
Download figure:
Standard image High-resolution image
Spatio-temporal variability of NPP in the IBB is noteworthy, such that the majority region in the lower basin is in the unstable to moderately stable category. This includes a large zone in the arid portion of the basin surrounding Lake Balkhash and to the west of Kapchagai Reservoir. Within these large unstable or moderately stable areas are small patches of stable sparse vegetation, mostly to the south of Lake Balkhash and in the Ili River delta. Areas classified as stable were most often associated with dense vegetation in the upper valley, especially irrigated croplands and piedmonts (figure 8).
4. Discussion
4.1. Use of remote imagery to examine the IBB
Analysis of remote imagery is becoming the method of choice to understand how human and environmental factors influence LULC and vegetative productivity in areas such as the IBB (Fensholt et al 2012, Sohl and Sleeter 2012, Wulder et al 2018). Although to our knowledge, this is the first such direct comparison of the spatial and temporal dynamics of LULC and NPP in the upper basin in China and the lower basin in Kazakhstan, portions of the IBB have been subjected to similar analysis in the past. The lower IBB was included in earlier studies that employed classification systems similar to ours to categorize large scale LULC change across all five republics of Central Asia (Klein et al 2012, Chen et al 2013, Hu and Hu 2019). Recent, changes in NPP across Central Asia have also been documented (Eisfelder et al 2014). Basic information about LULC in the upper IBB of China is also available, as are a variety of estimates of NPP in this sector of the basin (Christiansen and Schöner 2004, Feng et al 2007, Peng et al 2008, Jiao et al 2018, Pueppke et al 2018b, Zhang et al 2019). The utility of these studies is nevertheless limited; some are restricted to small areas within the IBB, and others lack detail and are scaled for analysis of much larger spatial levels.
Although the classification accuracy of the present study exceeded 80%, ours and the above studies are subject to limitations determined by the availability and resolution of remote imagery, as well as the presence of clouds and gaps, the difficulty in obtaining on-ground reference data, and time and cost constraints (Christiansen and Schöner 2004, Yan and Roy 2014, Zou et al 2017, Hao et al 2018, Hu and Hu, 2019). A variety of classification and analytical methods, including object-based systems (Arvor et al 2013), convolutional neural networks (Huang et al 2018), and reference time-series-based mapping (Hao et al 2018), have been devised to address these issues (Hansen and Loveland 2012). Difficulties in interpreting spectral signatures in Central Asia generally relate to the inability to distinguish cropland from shrubland, grassland, and/or bare areas (Hao et al 2018, Hu and Hu 2019). Crop development in the IBB is often asynchronous, and thus flooded rice fields can also be mistaken for water (Christiansen and Schöner 2004).
4.2. Land use/land cover
Although as described above, there is some uncertainty inherent in interpreting the spatial distribution of grassland, shrubland, and areas of sparse vegetation over the two-decade period of analysis, these lands together comprised a relatively constant fraction of the IBB from 1995 to 2015. The basin nevertheless underwent a series of changes in other LULC types during this interval. Water and wetland areas enlarged, likely as a consequence of a favourable, long-term climate cycle (Abdrasilov and Tulebaeva 1994, Propastin 2013b) and the construction of new reservoirs in China (Spivak et al 2016, Pueppke et al 2018b). Two land cover types governed by human activity also expanded. Growth of urban areas reflects population increase in the basin, and that of irrigated cropland reflects increased attention to food security. Although some basin-wide trends were fairly consistent across the transboundary between the upper Chinese and the lower Kazakh sectors of the IBB, expansion of irrigated cropland differentiates the two areas. Irrigated land in Kazakhstan underwent modest spatial shifts but remained constant at 561,000–562,000 ha between 1995 and 2015; that in China increased by 25%, from 606,000 ha to 753,000 ha, during the same time period.
It is well established that the extent of irrigation in the Kazakhstan zone reached a peak during the latter days of the Soviet Union and then dropped off following Kazakhstan's independence. Statistical estimates of irrigation during the late 1990s and early years of this century are available (Dostaj et al 2006, Akiyama et al 2012) and are in excellent agreement with our measurements based on remotely sensed images. The situation is more complex in the Chinese zone, where available statistical data are inconsistent with earlier measurements based on remote imagery and with estimates based on evapotranspiration and water usage (Christiansen and Schöner 2004, Thevs et al 2017b). Indeed, although the rate of expansion of irrigated areas as determined here and as determined earlier by complementary methods are in rough agreement (Christiansen and Schöner 2004, Pueppke et al 2018b), the absolute numbers differ and likely trace to difficulties in interpreting spectral signatures in this area (section 4.1). There is nevertheless evidence based on a variety of remote sensing methods that irrigated areas in China have expanded rapidly in this century, nearly doubling in an intensively examined area near Yining (Hao et al 2018) and growing by 165,000–180,000 ha in the upper Ili River valley (Pueppke et al 2018b; table 1).
4.3. Net primary productivity
LULC change has obvious implications for food production in the IBB, but knowledge gaps make this difficult to assess. Climatological and hydrological data, as well as information on irrigation, crop production, grassland utilization, and fisheries are sporadic, incomplete, and sometimes conflicting on both sides of the border (Sokolov 2006, Abdullaev and Rakhmatullaev 2014, Spivak et al 2016, Russell et al 2018, Shang et al 2018, Pueppke et al 2018a). Grazing lands, for example, may be available as forage for food animals, it is not always easy to verify that such lands are being used for this purpose (Lebed 2008). We therefore turned our attention to NPP, a proxy for potential food production on land-based agroecosystems (Imhoff et al 2004). Based on an analysis of remote sensing images from 2003 to 2011, Eisfelder et al (2014) calculated average NPP for irrigated farmland, rain-fed farmland, and grassland in Kazakhstan to be 338, 245, and 140 g C m−2/year, respectively. The corresponding average values for cropland and grassland in China's Xinjiang Province were similarly determined to be 360 and 202 g C m−2/year, respectively (Peng et al 2008).
NPP in areas of the Kazakhstan zone of the IBB that contain cropland has been reported to vary from about 600 to more than 800 g C m−2/year (Chen et al 2013). The corresponding values for cropland and grassland in the China zone of the basin have been reported to range from about 50 to 400 g C m−2/year (Feng et al 2007) to about 200 to 1,000 g C m−2/year (Jiao et al 2018, Shang et al 2018), with a zone-wide average of 599 g C m−2/year (Jiao et al 2018). It is difficult to make basin-wide comparisons among these studies, because they rely on direct measurements and modelling approaches that have not been standardized. In addition, and as discussed above, there are some uncertainties in categorization of LULC in the IBB.
Our high-resolution data, which extend uniformly across the entire IBB, fall within the lower range of earlier NPP measurements and reveal important contrasts between Kazakhstan and China. On the one hand, the NPP of dense vegetation in irrigated areas of both countries remained stable between 1995 and 2015, likely reflecting improved management and increasing application of technology (de Beurs and Henebry 2004). On the other hand, although the NPP trend for irrigated areas in China is positive, this is not the case in the major irrigated areas along the Trans Ili Alatau and Dzungarian Alatau in Kazakhstan. Indeed, and in spite of elevated NPP between 1960 and 2009 in grasslands and cropland on the Chinese side of the border (Shang et al 2018), the IBB is broadly characterized by negative NPP trends and unstable land cover in most non-irrigated areas, including grasslands in Kazakhstan (Klein et al 2012). This is a key contributor to risks associated with food production, especially in the more arid lower reaches of the basin.
4.4. Future considerations
Lying near the Eurasian pole of inaccessibility, the IBB is characterized by a harsh environment and distance from markets and major population centers. Water and food security have always been limiting and thus defining factors in the region's political, economic, and social development (Wittfogel 1957, Wiens 1969). In spite of recent technological and other advances, these challenges persist and are being amplified by the need to balance human impacts with preservation of the basin's fragile natural resource base (Granit et al 2012, Abdullaev and Rakhmatullaev 2016, Hu and Hu 2019). Kazakhstan and China differ in their use of and priorities for water and land resources in the IBB (Thevs et al 2017b). China has proportionately more grassland and much more irrigated land than Kazakhstan. Its consumption of water, 86% of which is allocated to irrigation of field crops, fruits, and vegetables, has grown from 38% to 43% of the total between 2000 and 2014. In spite of higher withdrawals during the Soviet era, just 27% of Kazakhstan's consumption now supports agriculture. Almost three times this amount is used to maintain environmental flows that benefit the natural functioning of the ecosystem, primarily the areas along the lower reaches of the Ili River, in the delta, and in Lake Balkhash. Kazakhstan's sense of water-insecurity and its need to protect Lake Balkhash and the lower reaches of the Ili River have focused attention on transboundary agreements to secure needed supplies. The two countries have not yet come to agreement (Rahaman 2012, Ibrayev et al 2013, Ho 2017), and thus political tensions in the IBB and other transboundary watersheds persist (Stone 2012, Stewart 2014).
Future land use and vegetative productivity in the IBB will continue to depend on precipitation in and glacial runoff from the surrounding mountains (Qi and Kulmatov 2008, Lioubimtseva and Henebry 2009, Qi et al 2012). It is thus of concern that glaciers in the ranges of the Tian Shan mountains that surround the basin are retreating at a rapid rate (Sorg et al 2012, 2014, Xu et al 2015, Deng and Chen 2017), as much as 0.8% per year in terms of area and 1% per year in terms of ice volume (Vilesov et al 2006), Seversky et al 2012). Temperatures in the region are trending upward, and continuation of this pattern will likely elevate discharge of water from the mountains over the short term, but sharply reduce as glaciers recede and ultimately disappear (Kokarev 2007, Lioubimtseva and Henebry 2009, Sorg et al 2014). There is still much uncertainty associated with the precise consequences of rising temperatures and altered precipitation patterns, the latter of which has a decidedly positive effect on NPP in Xinjiang (Jiao et al 2008). Given that the basin's water is already in short supply and that agriculture is highly dependent on irrigation, it is hard to imagine the current rates of expansion of crop production areas can be maintained.
5. Conclusions
The transformation of the geopolitical and economic environment in and around the IBB is leading to significant changes in land use and agricultural productivity. Irrigation zones are expanding, often at the expense of grassland that has been used for herding. Areas that receive adequate precipitation are being converted to rain fed cropland, and urban areas are spreading out. Our analysis of remote sensing imagery confirms that since 1995 these changes have occurred primarily—but not exclusively—in China, where diversion of water for food production in the upper basin is a major driver of LULC. Kazakhstan's Lake Balkhash lies at the opposite pole of the IBB and is the bellwether of ecosystem health of the basin. Although it is not in the pristine condition that preceded anthropogenic pressures, its status is currently regarded as fairly stable (Aladin and Plotnikov 1993, Propastin 2013b), in spite of pressures exerted by water diversion and land use change upstream. This has been attributed to the currently favourable cyclical fluctuation in climate (Abdrasilov and Tulebaeva 1994) and elevated releases of water from glaciers that are melting due to climate change (Sorg et al 2014). These benefits will almost certainly be limited in duration as the long-term cycle again becomes unfavourable and as further effects of climate change are felt, and thus the capacity of the basin to accommodate the current trajectory of LULC change will be increasingly constrained in the future.
Acknowledgments
This study is support partially provided by the MSU-NAU Asia Hub Initiative, NASA's Land Cover and Land Use Program grant (NNX15AD51G), NASA's IDS grant (80NSSC17K0259), USDA (MICL02264) through AgBioResearch at Michigan State University.