Abstract
This study presents a systematic investigation of the synergistic effect of deuterium and helium on the microstructural evolution of W–Y2O3 material during plasma exposure. The effect of single D/He and sequential D/He, He/D plasma exposure on the stability of Y2O3 nanoparticles and the microstructural evolution of the W matrix were investigated using scanning electron microscopy and transmission electron microscopy. The results indicate that Y2O3 particles undergo a significant size change during plasma exposure, and this process was significantly influenced by the synergistic effects of hydrogen and helium. The size evolution of Y2O3 particles is controlled by three mechanisms: the etching-controlled process at the initial stage, followed by deposition-controlled process or mixed-controlled processes. Interestingly, the fuzz structure on the surface of Y2O3 particles is proved to be W instead of Y2O3, which results from the deposition during plasma exposure. Significant synergistic effects of deuterium and helium were observed, in which the strong combination of H and He-vacancy composites suppressed the bubble formation and growth, leading to a different evolutionary dynamic.

Original content from this work may be used under the terms of the Creative Commons Attribution 4.0 license. Any further distribution of this work must maintain attribution to the author(s) and the title of the work, journal citation and DOI.
1. Introduction
Tungsten (W) is considered as the primary candidate for plasma-facing materials in future fusion reactors due to its high melting point, excellent thermal conductivity, low sputtering rate, and minimal tritium retention [1, 2]. Recently, new tungsten-based materials, such as oxide dispersion-strengthened tungsten, have been proposed to overcome their shortcomings, especially the high ductile-to-brittle transition temperature, poor ductility, recrystallization brittleness, and irradiation embrittlement [3–5]. Recent studies indicate that W–Y2O3 has enhanced resistance to plasma exposure. Yao et al [6] found that the surface roughness of the W–2% Y2O3 material was lower than that of pure W after helium plasma irradiation. Lv et al [7] observed changes in the surface morphology of both pure tungsten and W–Y2O3 under the same irradiation energy but with different irradiation doses. They found that the irradiation dose required for surface changes in W–0.3%wt Y2O3 was higher than that for pure tungsten, suggesting that W–Y2O3 exhibits good radiation resistance.
Studies on the resistance of W–Y2O3 materials to plasma damage have primarily focused on the damage evolution processes in the tungsten matrix, including the formation of bubbles, waves, holes, fuzz and so on. The emergence of fuzz structures poses a significant challenge, as it notably diminishes surface stability and thermal conductivity. The removal of these fuzz structures adversely affects the stability of the core plasma [8]. However, investigations into the damage and evolution of Y2O3 particles are still limited. Yao et al [9] found that, with helium ion irradiation at a dose of 1.5 × 1026 ions m−2, only a small number of micron-sized Y2O3 particles remained near the phase interfaces. Huang et al [10] found that the W matrix and Y2O3 particles exhibit different responses to helium plasma exposure. Specifically, fuzz formation occurs only on the W substrates, while Y2O3 particles develop nano-protrusions and small cracks on the surface and are unable to form fuzz structures autonomously.
These research results mainly examine the effects of the single H/He plasma exposure, with limited exploration of the synergistic impacts of H and He. The research of pure W and W-based alloy shows that H/He plasma exposure not only causes damage to tungsten, but also results in a significant synergistic effect during the damage evolution [11]. Helium bubbles may act as trap sites for H atoms and affect the retention of H isotopes in W [12]. H atoms in He pre-injected W tend to accumulate in He-saturated layers, and the presence of helium limits the diffusion of H in W. Liu et al [13] found that exposure to single H plasma only induced surface roughening due to physical sputtering, while exposure to mixed H/He plasma resulted in additional pinhole-like surface structures. Therefore, the synergistic effect of H/He plasma on the evolution of W–Y2O3 materials is worth further investigation.
Besides, most research about W–Y2O3 materials focuses on the evolution of the W matrix, neglecting the stability of Y2O3 particles. During long-term service, the evolution of particles is related to the microstructure and performance stability of W–Y2O3 materials and should not be ignored. In this work, the microstructure evolution of W–Y2O3 materials under single and mixed H/He plasma exposure, including the W matrix and Y2O3 particles, was studied using scanning electron microscopy (SEM) and transmission electron microscopy (TEM). The synergistic effect of deuterium and helium on the stability of Y2O3 particles and the evolution of fuzz structure were studied.
2. Experiment
2.1. Materials
The W–Y2O3 materials with a 0.5% weight percentage of Y2O3 were used in this experiment, which were prepared using the wet chemical method. Firstly, ammonium paratungstate (AMT, purity: ⩾99.95%) and yttrium nitrate hexahydrate (Y(NO3)3∙6H2O, purity: ⩾99.5%) were selected as the raw materials for W and Y2O3, respectively, and oxalic acid (C2H2O4∙ 2H2O) was chosen as the precipitant to obtain the W–Y2O3 precursor. The precursors were then subjected to powder reduction with a loading of 1 kg per combustion boat and the flow rate of hydrogen during the reduction process was maintained at 24 m3 h−1. The temperature range of the hydrogen reduction furnace was 880 °C–930 °C with three temperature zones. The combustion boat slowly passes through the three temperature zones under the action of a conveyor belt to obtain the final reduced powder. The billet was pressed by cold isostatic pressing technique at 200 MPa pressure, and then the billet was placed in a hydrogen sintering furnace for high-temperature sintering treatment at a sintering temperature of 2573 K with a sintering time of 6 h. The sintered block obtained was hot rolled at a temperature of 1853 K. The W–Y2O3 composite material with a rolling rate of 50% was obtained, that is, the thickness of the rolled plate is half of that of the blank. The grain size of W–Y2O3 material was 33 ± 25 μm, which was reported in our previous research with the same materials [14].
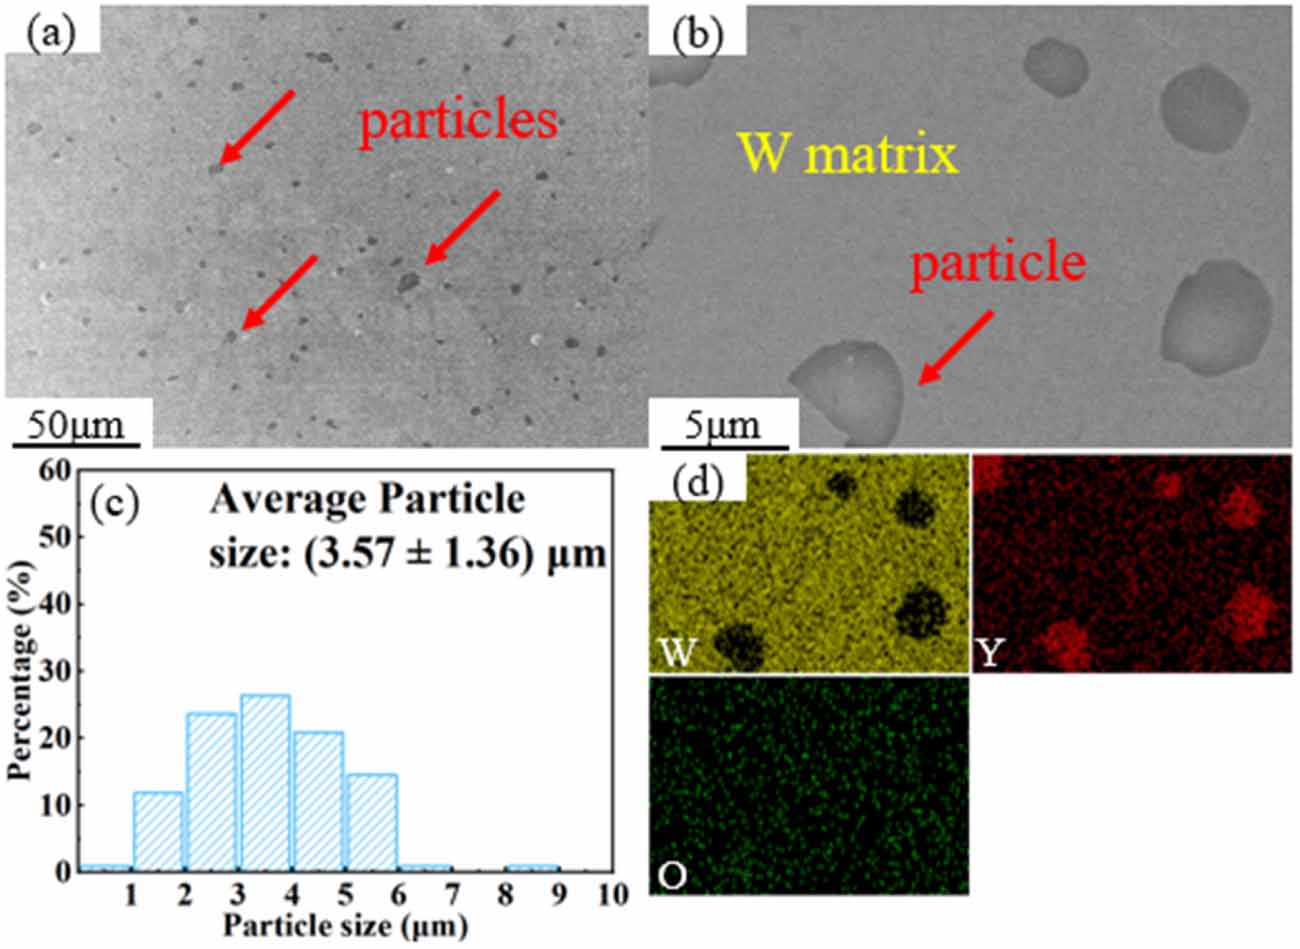
SEM images and corresponding energy dispersive spectrometer (EDS) mapping of W–Y2O3 materials and particle size distribution of Y2O3 particles are shown in figure 1. Red arrows indicate some of the Y2O3 particles. From the low magnification SEM image, it was found that the particles were uniformly dispersed in the tungsten matrix and the average particle size of the particles was (3.57 ± 1.36) μm. In this work, the standard deviation was used as errors of mean value instead of standard error to reflect the size distribution, this error bar does not directly reflect the confidence interval of the mean value. SEM image shows that the particles tightly bond with the W matrix, and they are identified as Y2O3 by EDS (figure 1(d)).
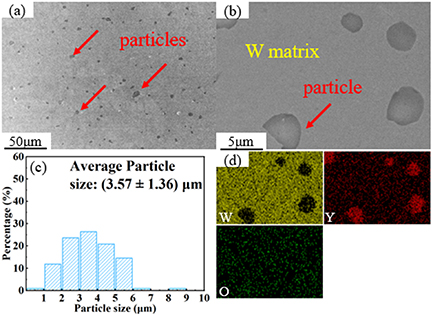
Figure 1. SEM images and corresponding EDS mapping of W–Y2O3 materials and particle size distribution of Y2O3 particles. (a) Low magnification SEM image, (b) high magnification SEM image, (c) particle size distribution, (d) EDS mapping.
Download figure:
Standard image High-resolution image2.2. Plasma exposure
Plasma exposure was carried out using a Plasma-Surface Interaction system under Extreme Conditions at Hefei University of Technology, Hefei, China. The sequential plasma exposure of deuterium and helium, as well as single deuterium and helium, were applied. For convenience, the two sequential plasma exposures of helium followed by deuterium injection and deuterium followed by helium injection are abbreviated as He/D and D/He in this paper. Samples for plasma exposure were mechanically cut into 10 mm × 5 mm × 1 mm. Then, electrolytic polishing is carried out after mechanical polishing, using 0.5 wt.% NaOH aqueous solution as electrolyte. High pure (>99.999%) D and He were used with a gas flow rate of 60 sccm. The vacuum was lower than 3 × 10⁻⁴ Pa during plasma exposure. The detailed exposure parameters are listed as table 1. Where the incident ion energy (Ei) is derived from the difference between the plasma space potential (Vs) and the negative bias voltage (Vb), i.e. Ei = e(Vs − Vb).
Table 1. The detailed parameters of plasma exposure for W–Y2O3 materials.
| Specimen number | Flux, Γi (1021 m−2·s−2) | Dose, ϴ (1024 m−2) | Energy, Ei (eV) | Power, P (W) | Temperaturea (K) | |
|---|---|---|---|---|---|---|
| Single D | 1 | 4.0 | 10.0 | 50 | 600 | 750 |
| 2 | 6.0 | 20.0 | 40 | 800 | 830 | |
| 3 | 8.0 | 50.0 | 40 | 1100 | 950 | |
| 4 | 9.0 | 100.0 | 55 | 1200 | 1140 | |
| Single He | 5 | 7.0 | 10.0 | 50 | 800 | 850 |
| 6 | 9.0 | 50.0 | 40 | 1100 | 960 | |
| 7 | 12.0 | 100.0 | 40 | 1200 | 1150 | |
| Sequential He/D | 8 | 3.0/3.0 | 2.5/2.5 | 30/20 | 500/600 | 700 |
| 9 | 5.0/3.5 | 5.0/5.0 | 30/25 | 800/750 | 800 | |
| 10 | 10.0/8.0 | 25.0/25.0 | 60/20 | 900/1000 | 920 | |
| 11 | 12.0/9.0 | 50.0/50.0 | 70/30 | 1000/1200 | 1130 | |
| Sequential D/He | 12 | 3.0/3.0 | 2.5/2.5 | 20/30 | 600/500 | 700 |
| 13 | 3.5/5.0 | 5.0/5.0 | 25/30 | 750/800 | 800 | |
| 14 | 8.0/10.0 | 25.0/25.0 | 20/60 | 1000/900 | 910 | |
| 15 | 9.0/12.0 | 50.0/50.0 | 30/70 | 1200/1000 | 1120 | |
aThe average temperature measured using thermocouple behind the sample.
2.3. Characterization
The microstructure evolution of W–Y2O3 material was characterized using Hitachi SU-8020 SEM operated at 5 kV and FEI Tecanai G2 F20 TEM operated at 200 kV. Samples for TEM analysis were prepared using a Helios G4 UX Dual Beam focused ion beam (FIB) system with a Lift-Out model. The element distribution was analyzed using an EDS. The cross-sectional specimens were prepared using the Crossbeam 350 FIB system.
3. Results
3.1. The stability of Y2O3 particle
3.1.1. D plasma exposure.
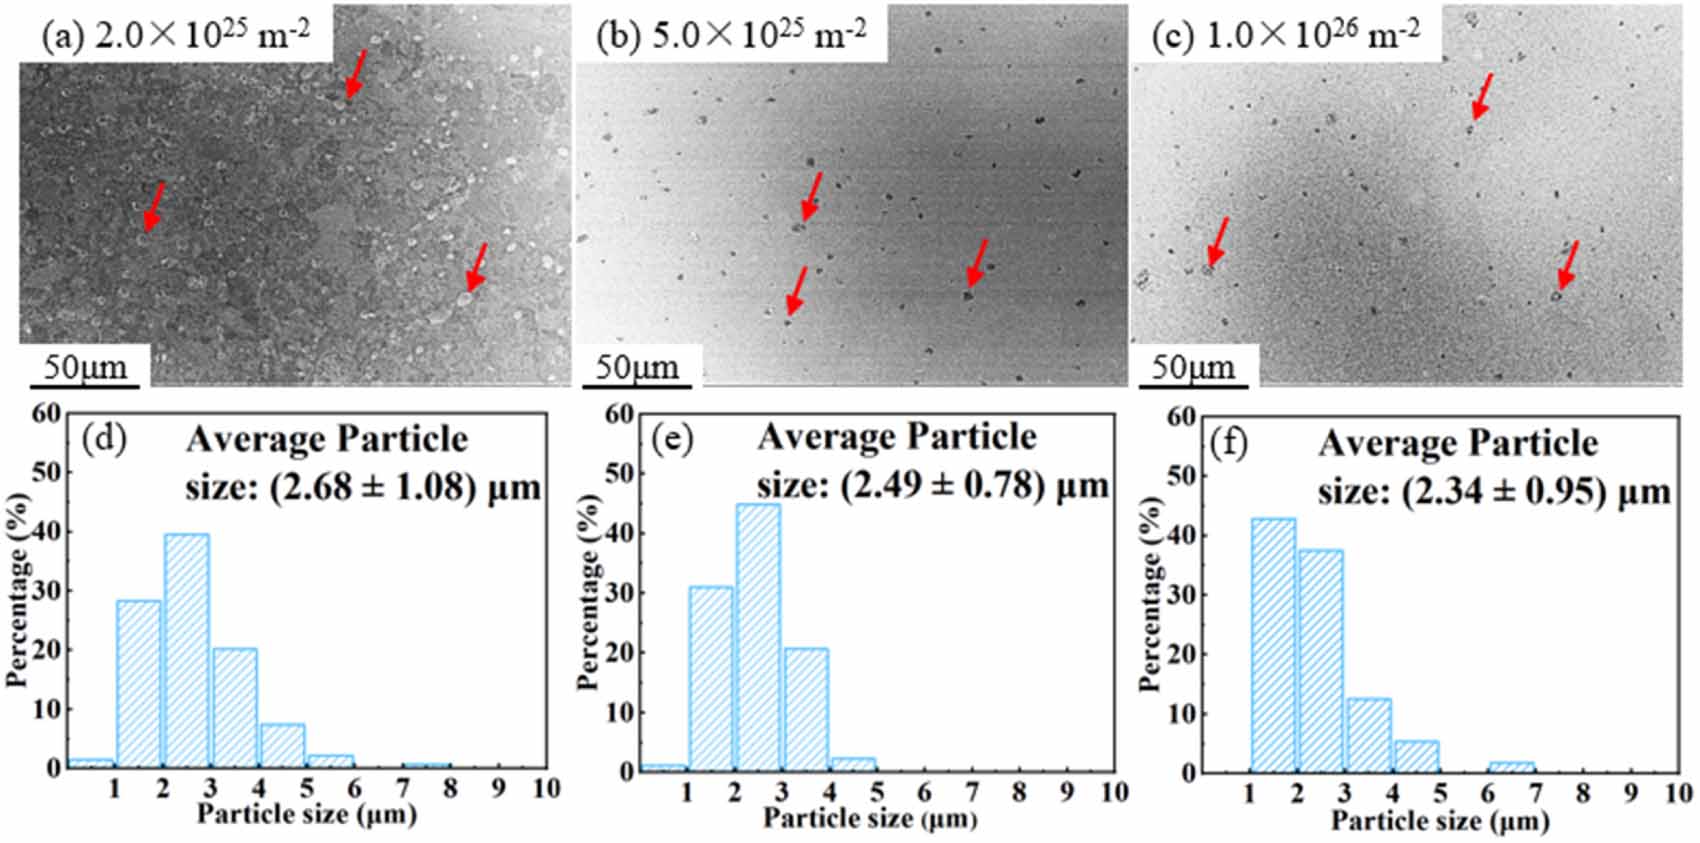
Figure 2 shows the low magnification SEM images and Y2O3 particle size distribution of W–Y2O3 material after D plasma exposure with different doses. These results show that the average size of Y2O3 particle was slightly decreased with an increase in dose. Specifically, the mean particle size was measured (2.68 ± 1.08) μm at a dose of 2.0 × 1025 D·m−2, which subsequently decreased to (2.49 ± 0.78) μm at a dose of 5.0 × 1025 D·m−2. The mean particle size decreased to (2.34 ± 0.95) μm at a dose of 1.0 × 1026 D·m−2. The detailed results of particle size distribution in W–Y2O3 materials after exposure are listed in table 2, in which the particle density is estimated as a number of particles per unit area, since the observation depth of SEM is limited to the 10 nm level.
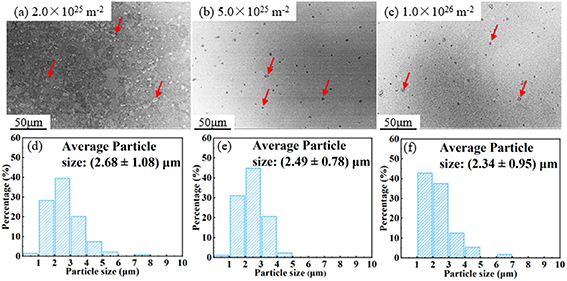
Figure 2. Low magnification SEM images and Y2O3 particle size distribution of W–Y2O3 material after D plasma exposure with different doses. (a), (d) 2.0 × 1025 D·m−2, (b), (e) 5.0 × 1025 D·m−2, (c), (f) 1.0 × 1026 D·m−2.
Download figure:
Standard image High-resolution imageTable 2. The detailed results of particle size distribution in W–Y2O3 materials after exposure.
| Exposure | Dose, ϴ (1024 m−2) | Measured particle number | Particle size (μm) | Standard deviation (μm) | Particle density (109 m−2) |
|---|---|---|---|---|---|
| Non | 0 | 110 | 3.57 | 1.36 | 2.44 |
| Single D | 20 | 134 | 2.68 | 1.08 | 2.98 |
| 50 | 87 | 2.49 | 0.78 | 1.93 | |
| 100 | 56 | 2.34 | 0.95 | 1.24 | |
| Single He | 10 | 100 | 2.62 | 1.00 | 2.22 |
| 50 | 54 | 1.97 | 0.52 | 1.20 | |
| Sequential He/D | 10 | 73 | 2.67 | 0.78 | 1.62 |
| 50 | 72 | 2.62 | 0.65 | 1.60 | |
| 100 | 54 | 2.81 | 0.80 | 1.20 | |
| Sequential D/He | 10 | 110 | 2.63 | 1.17 | 2.44 |
| 50 | 72 | 2.07 | 0.70 | 1.60 | |
| 100 | 46 | 2.34 | 0.61 | 1.02 | |
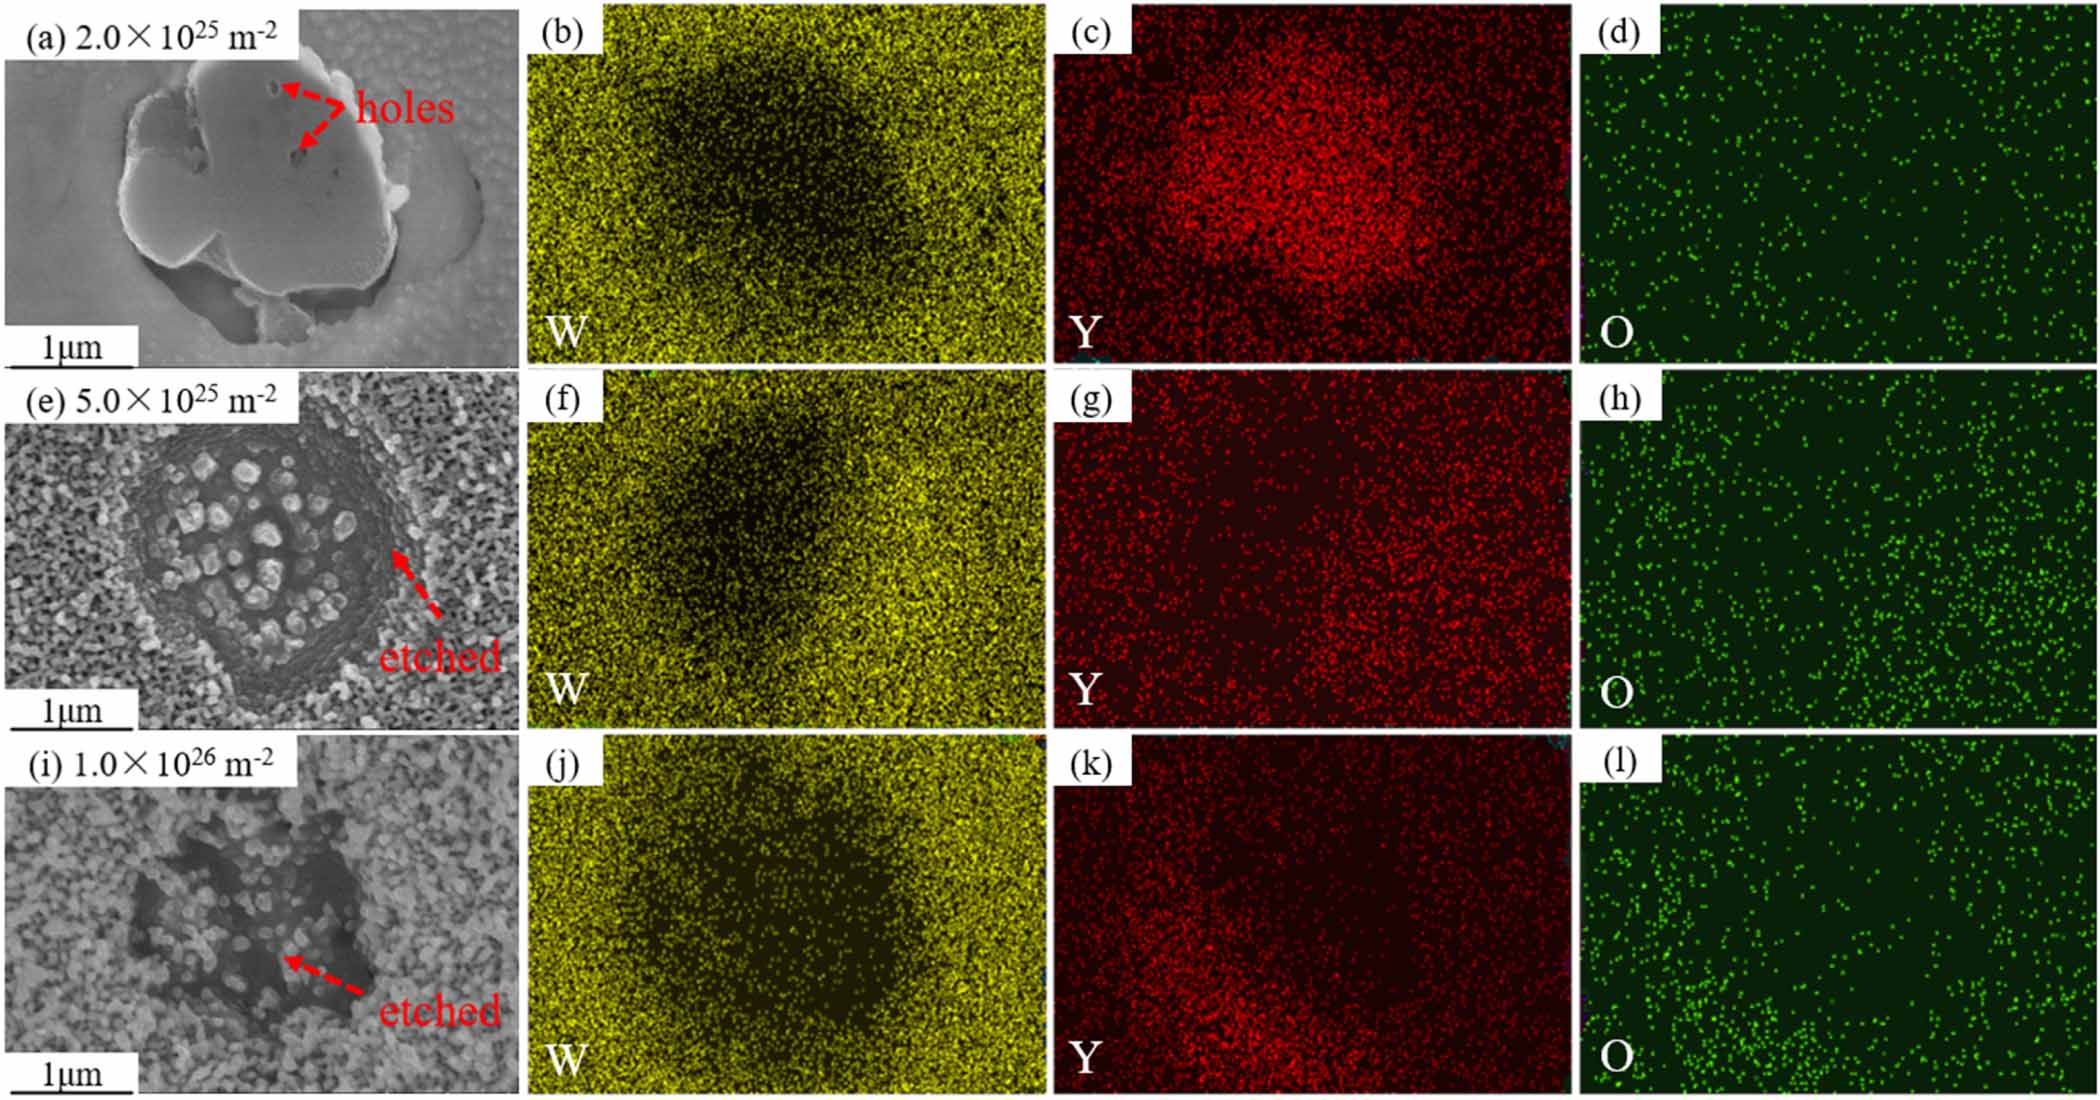
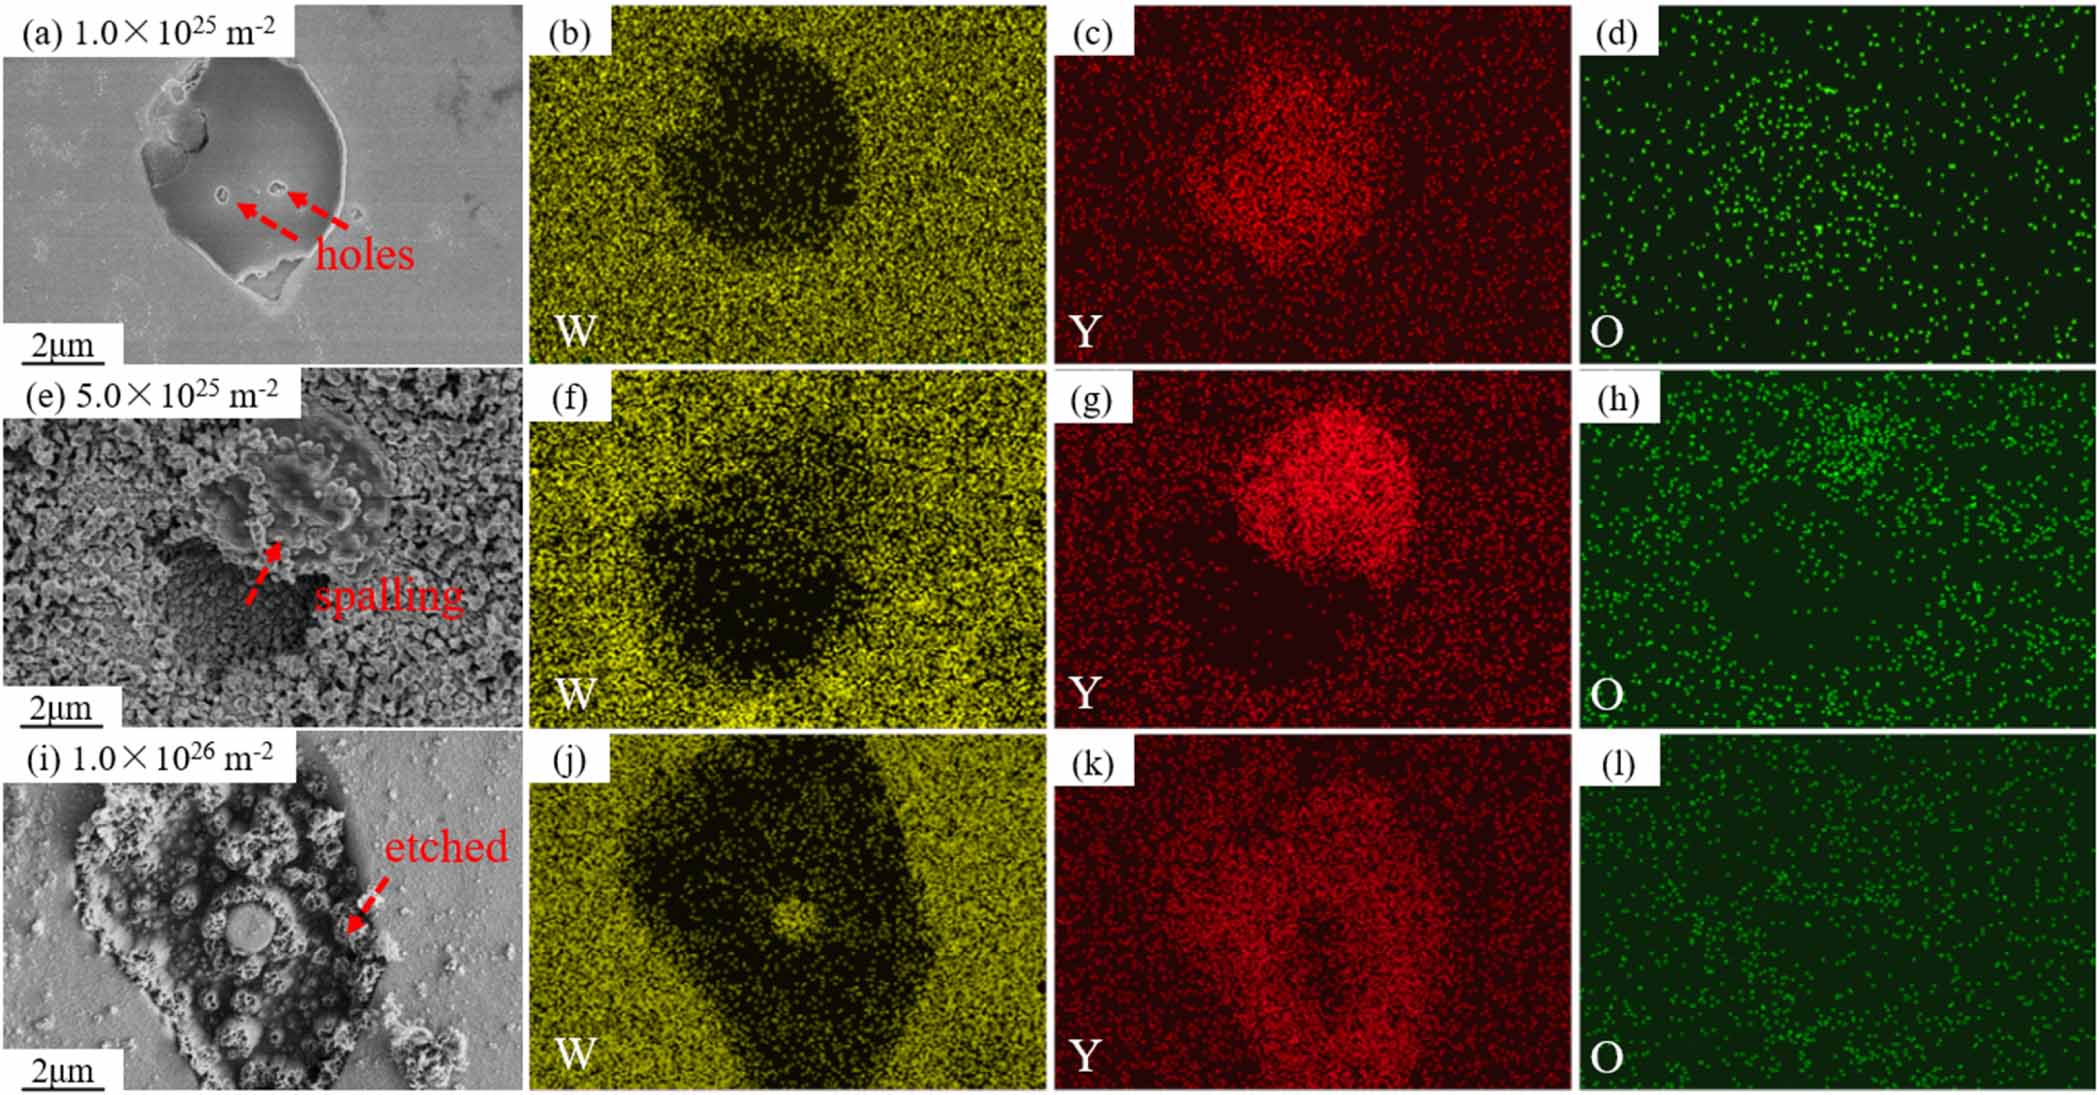
High magnification SEM images of Y2O3 particle and corresponding EDS mapping of W–Y2O3 material after D plasma exposure with different doses were shown in figure 3. At the dose of 2.0 × 1025 D·m−2, only a small number of holes were observed on the surface of Y2O3 particle. With the dose increasing, the surface of the particles gradually breaks, and the particles seem to be etched and stripped out of the matrix. These results show a larger damage of Y2O3 particles rather than the W matrix with the dose increases. There are two possible reasons for this phenomenon: the one is that Y2O3 is directly etched by D plasma [15], as shown in figure 3(a), and holes caused by etching were observed on the surface of the particles at low doses. Considering that the sputtering thresholds of Y and O in Y2O3 particles are 23 eV and 14 eV [16], respectively, both of which are significantly lower than that of W (about 160 eV [17]), it is reasonable to expect that Y2O3 particles would be sputtered before W matrix. The other one is that D atoms are tracked and aggregated at the interface, leading to a higher internal stress, resulting in the cracking and detaching of particles [15, 18]. For example, as shown in figures 3(e) and (i), interweaved nanotendrils (also called fuzz) morphology of Y2O3 particles were observed under high-dose plasma exposure.
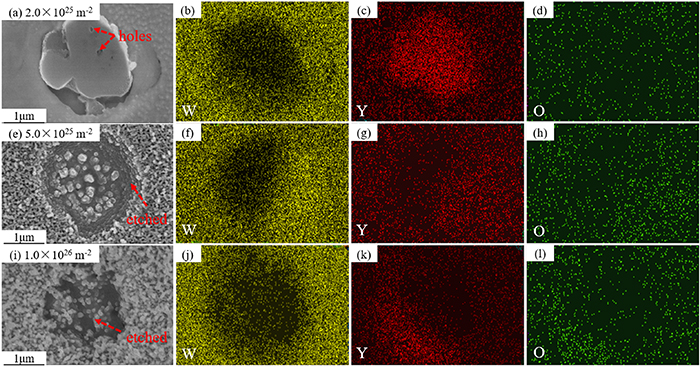
Figure 3. High magnification SEM images of Y2O3 particle and corresponding EDS mapping of W–Y2O3 material after D plasma exposure with different doses. (a)–(d) 2.0 × 1025 D·m−2, (e)–(h) 5.0 × 1025 D·m−2, (i)–(l) 1.0 × 1026 D·m−2.
Download figure:
Standard image High-resolution image3.1.2. He plasma exposure.
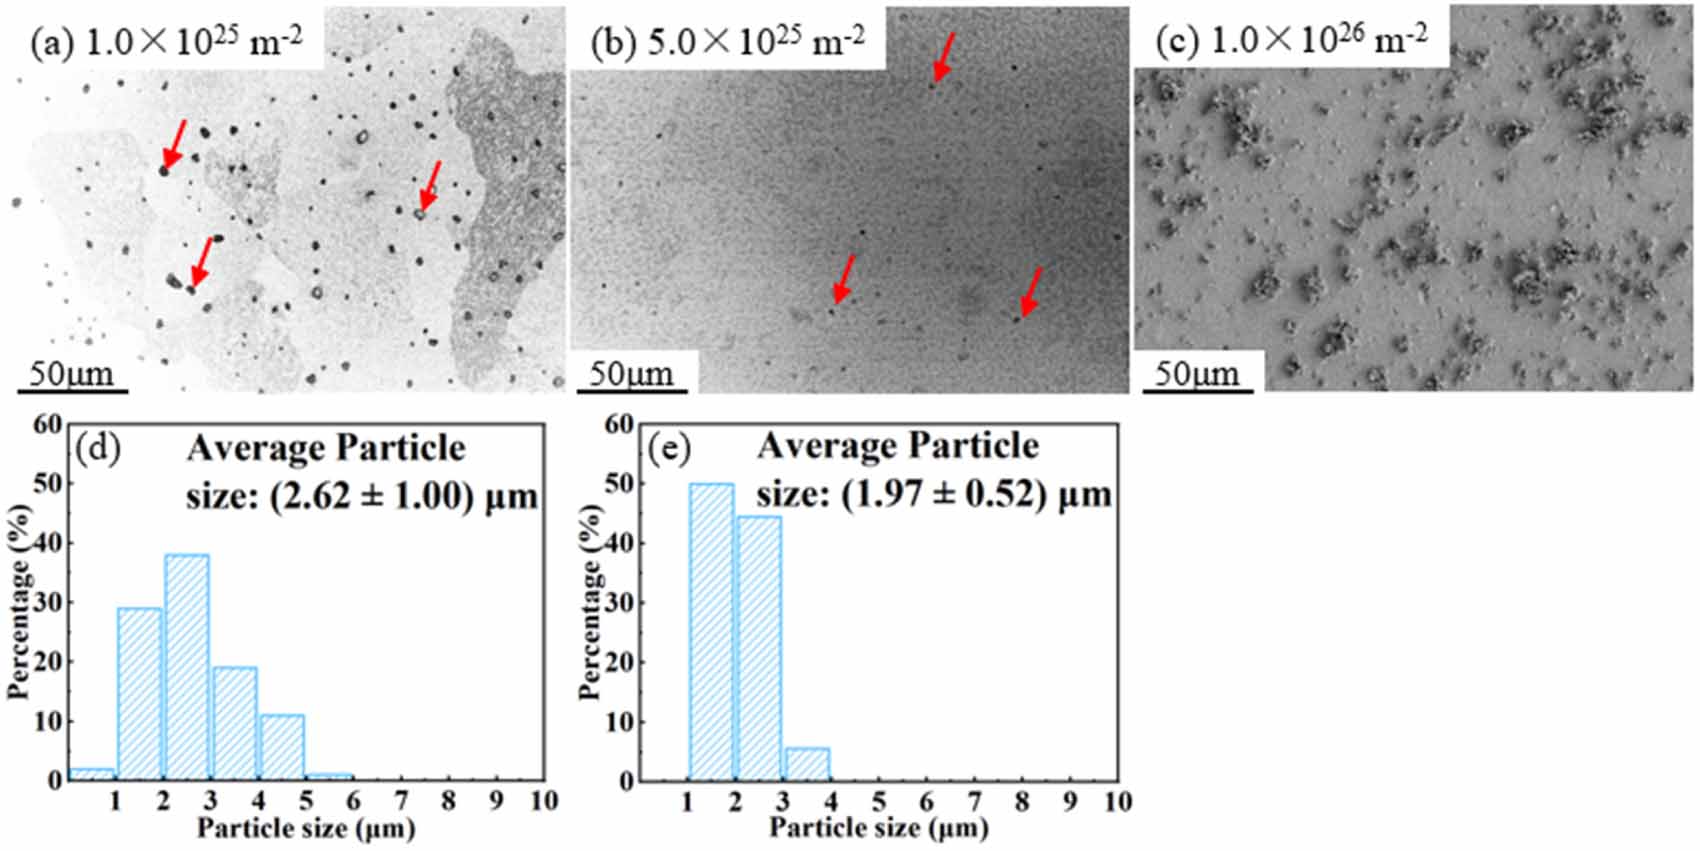
Figure 4 shows the low magnification SEM images and Y2O3 particle size distribution of W–Y2O3 material after He plasma exposure with different doses. The results indicate a similarity to D plasma, in which the average size of Y2O3 particles decreased as the dose increased. The difference is that the reduction rate of particles under He plasma exposure was significantly enhanced compared to that of D. At the dose of 1.0 × 1025 He·m−2, the mean particle size was (2.62 ± 1.00) μm, and it significantly reduced to (1.97 ± 0.52) μm at 5.0 × 1025 He·m−2. When the dose reached 1.0 × 1026 He·m−2, Y2O3 particles cannot be confirmed via SEM image, as shown in figure 4(c). Thus, no particle size distribution was obtained at this exposure dose.
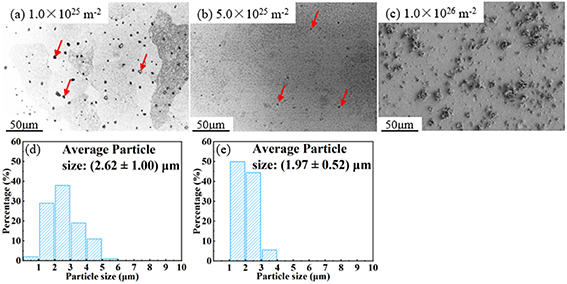
Figure 4. Low magnification SEM images and Y2O3 particle size distribution of W–Y2O3 material after He plasma exposure with different doses. (a), (d) 1 × 1025 He·m−2, (b), (e) 5.0 × 1025 He·m−2, (c) 1.0 × 1026 He·m−2.
Download figure:
Standard image High-resolution imageHigh magnification SEM images of Y2O3 particle and corresponding EDS mapping of W–Y2O3 material after He plasma exposure with different doses were shown in figure 5. At 1 × 1025 He·m−2, the result is very similar to that after low dose D plasma exposure, only a small number of holes were observed in Y2O3 particle. However, after He plasma exposure at higher doses, the damage of Y2O3 particles is significantly greater than that of D plasma. The reason for this phenomenon may be the much lower solubility of He compared to that of D, which significantly increased the internal stress generated by He aggregation. Besides, the aggregation of He at grain boundaries reduces the bond strength and leads to the ejection of W grains [19]. This mechanism may accelerate the spalling process of particles from the matrix. Yao et al [20] studied the effects of helium ion irradiation on the damage behavior of W–Y2O3 composites following laser thermal shock. They observed the spalling of Y2O3 particles in the near-surface region through TEM observation. This spalling is believed to be caused by cracking between the Y2O3 particles as a result of the laser thermal shock, which leads to the shedding of Y2O3 grains in that region. Considering that the plasma beam in this study also imposes a large thermal load and thermal stress, it may lead to some grain ejection or spalling, similar to W grain ejection, as shown in figure 5(e). However, since this experiment maintains a uniform temperature rather than a thermal shock temperature, this mechanism is not predominant.
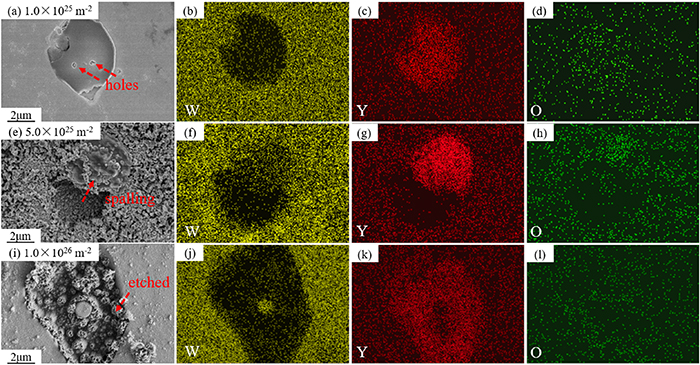
Figure 5. High magnification SEM images of Y2O3 particle and corresponding EDS mapping of W–Y2O3 material after He plasma exposure with different doses. (a)–(d) 1 × 1025 He·m−2, (e)–(h) 5.0 × 1025 He·m−2, (i)–(l) 1.0 × 1026 He·m−2.
Download figure:
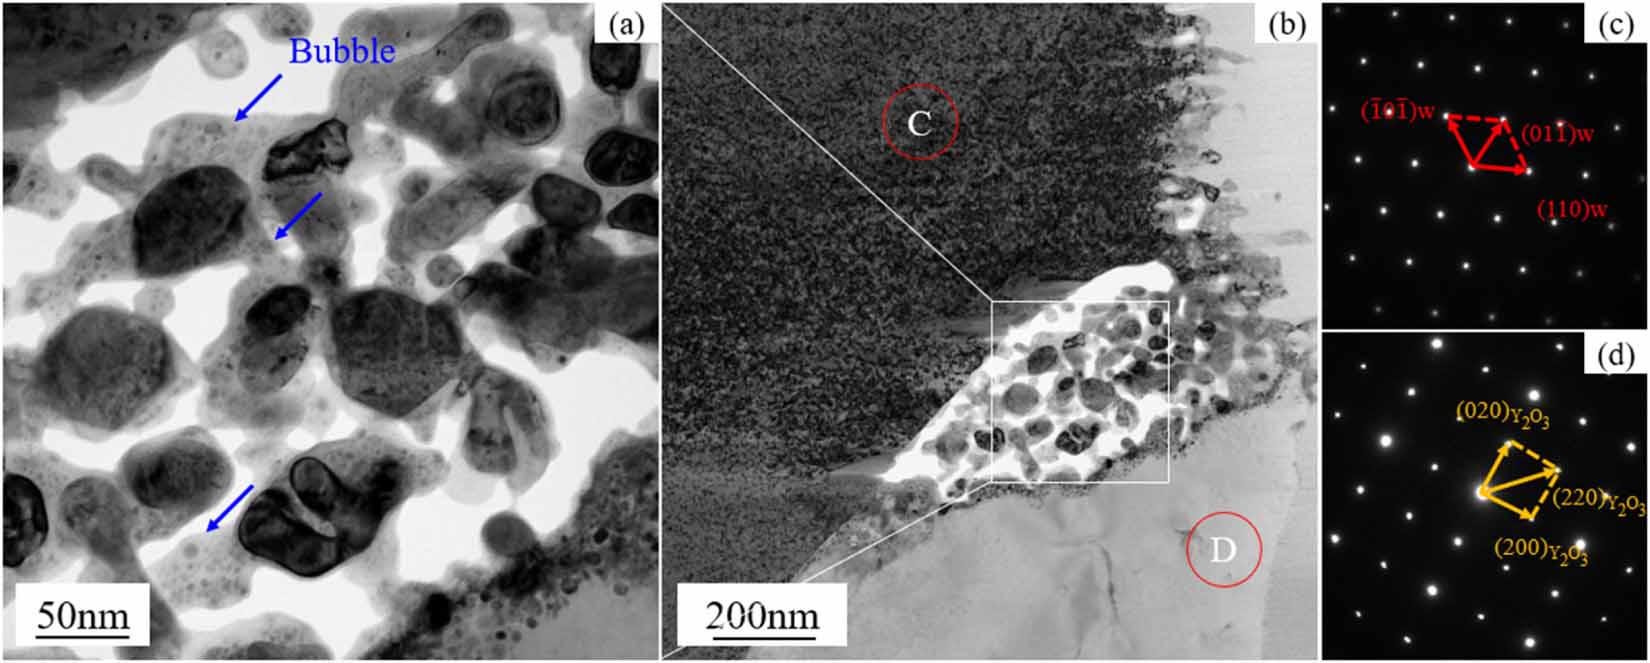
Standard image High-resolution imageThe TEM images of the Y2O3/matrix interface and corresponding selected area electron diffraction (SAED) patterns were shown in figure 6. The labeled sites C and D in figure 6(b) are identified by the SAEDs in figures 6(c) and (d), respectively. The Y2O3/matrix interface was confirmed via SAED results. Figure 6(b) shows a significant void and small broken particles at the interface, suggesting that the destruction of particles begins at the interface. Besides, some bubbles were observed near the void (as shown in figure 6(a)), showing that the destruction of particles is highly correlated with the generation and aggregation of bubbles.
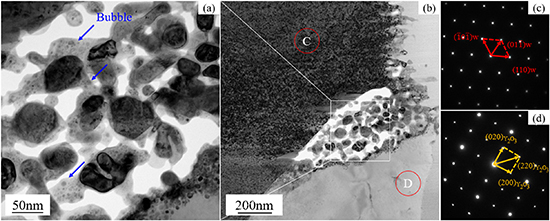
Figure 6. The TEM images of the Y2O3/matrix interface and corresponding SAED patterns. (a), (b) A is the enlarged TEM image at the position of the white box in figure (b); (c), (d) are the SAED patterns of the C and D phases in figure (b), respectively.
Download figure:
Standard image High-resolution image3.1.3. Sequential He/D plasma exposure.
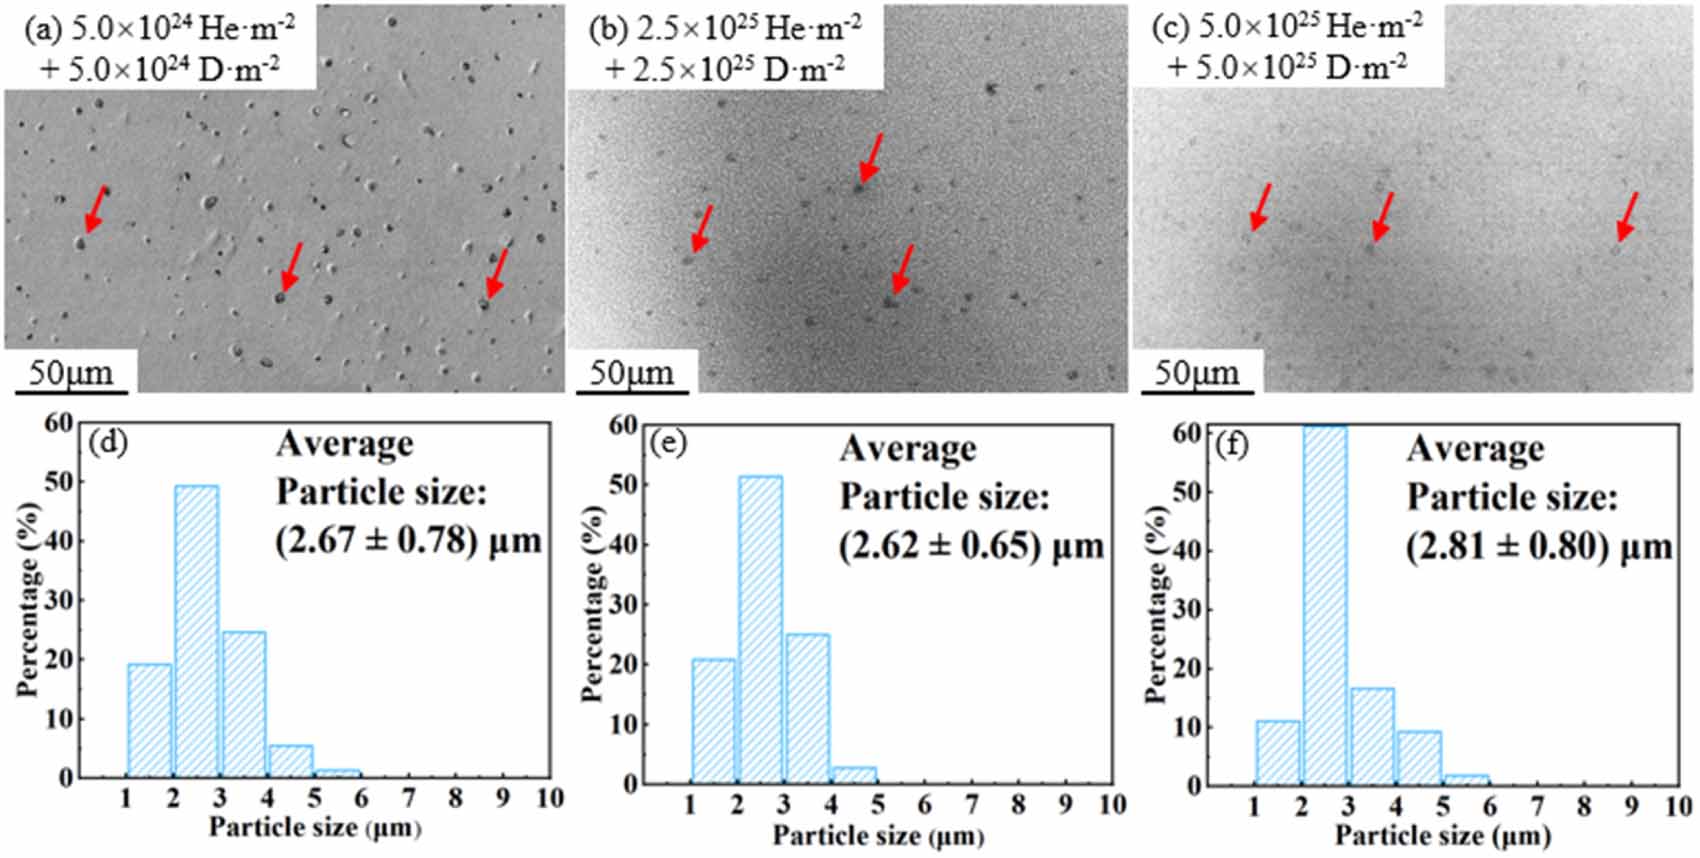
Low magnification SEM images and Y2O3 particle size distribution of W–Y2O3 material after sequential He/D plasma exposure with different doses were shown in figure 7. Interestingly, a significant decrease in the number of particles was observed in the SEM images, but no particle size reduction was observed. The mean particle size with a dose of 5 × 1024 He·m−2 + 5 × 1024 D·m−2 was (2.67 ± 0.78) μm, and the mean particle size with a dose of 2.5 × 1025 He·m−2 + 2.5 × 1025 D·m−2 was (2.62 ± 0.65) μm, which was almost the same. When the dose reached 5.0 × 1025 He·m−2 + 5.0 × 1025 D·m−2, the mean particle size slightly changed to (2.81 ± 0.80) μm. Considering the decrease in particle density and the fuzz structure on the W matrix extending through the interface to the particle surface, which leads to the blurring of the particle morphology, this difference may be due to the increase in measurement error. Especially, in figure 7(c), small particles are almost unobservable, and it will also lead to a larger average particle size. Based on the above analysis, it is reasonable that the particle size is considered as slight decrease or almost unchanged during the sequential He/D plasma exposure.
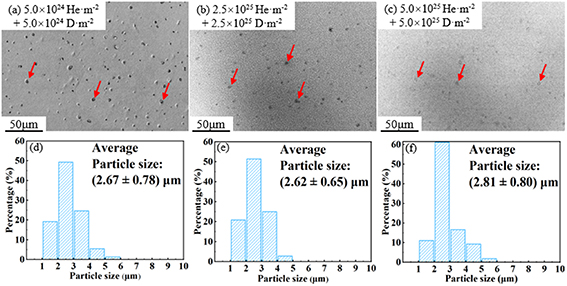
Figure 7. Low magnification SEM images and Y2O3 particle size distribution of W–Y2O3 material after sequential He/D plasma exposure with different doses. (a), (d) 5 × 1024 He·m−2 + 5 × 1024 D·m−2, (b), (e) 2.5 × 1025 He·m−2 + 2.5 × 1025 D·m−2, (c), (f) 5.0 × 1025 He·m−2 + 5.0 × 1025 D·m−2.
Download figure:
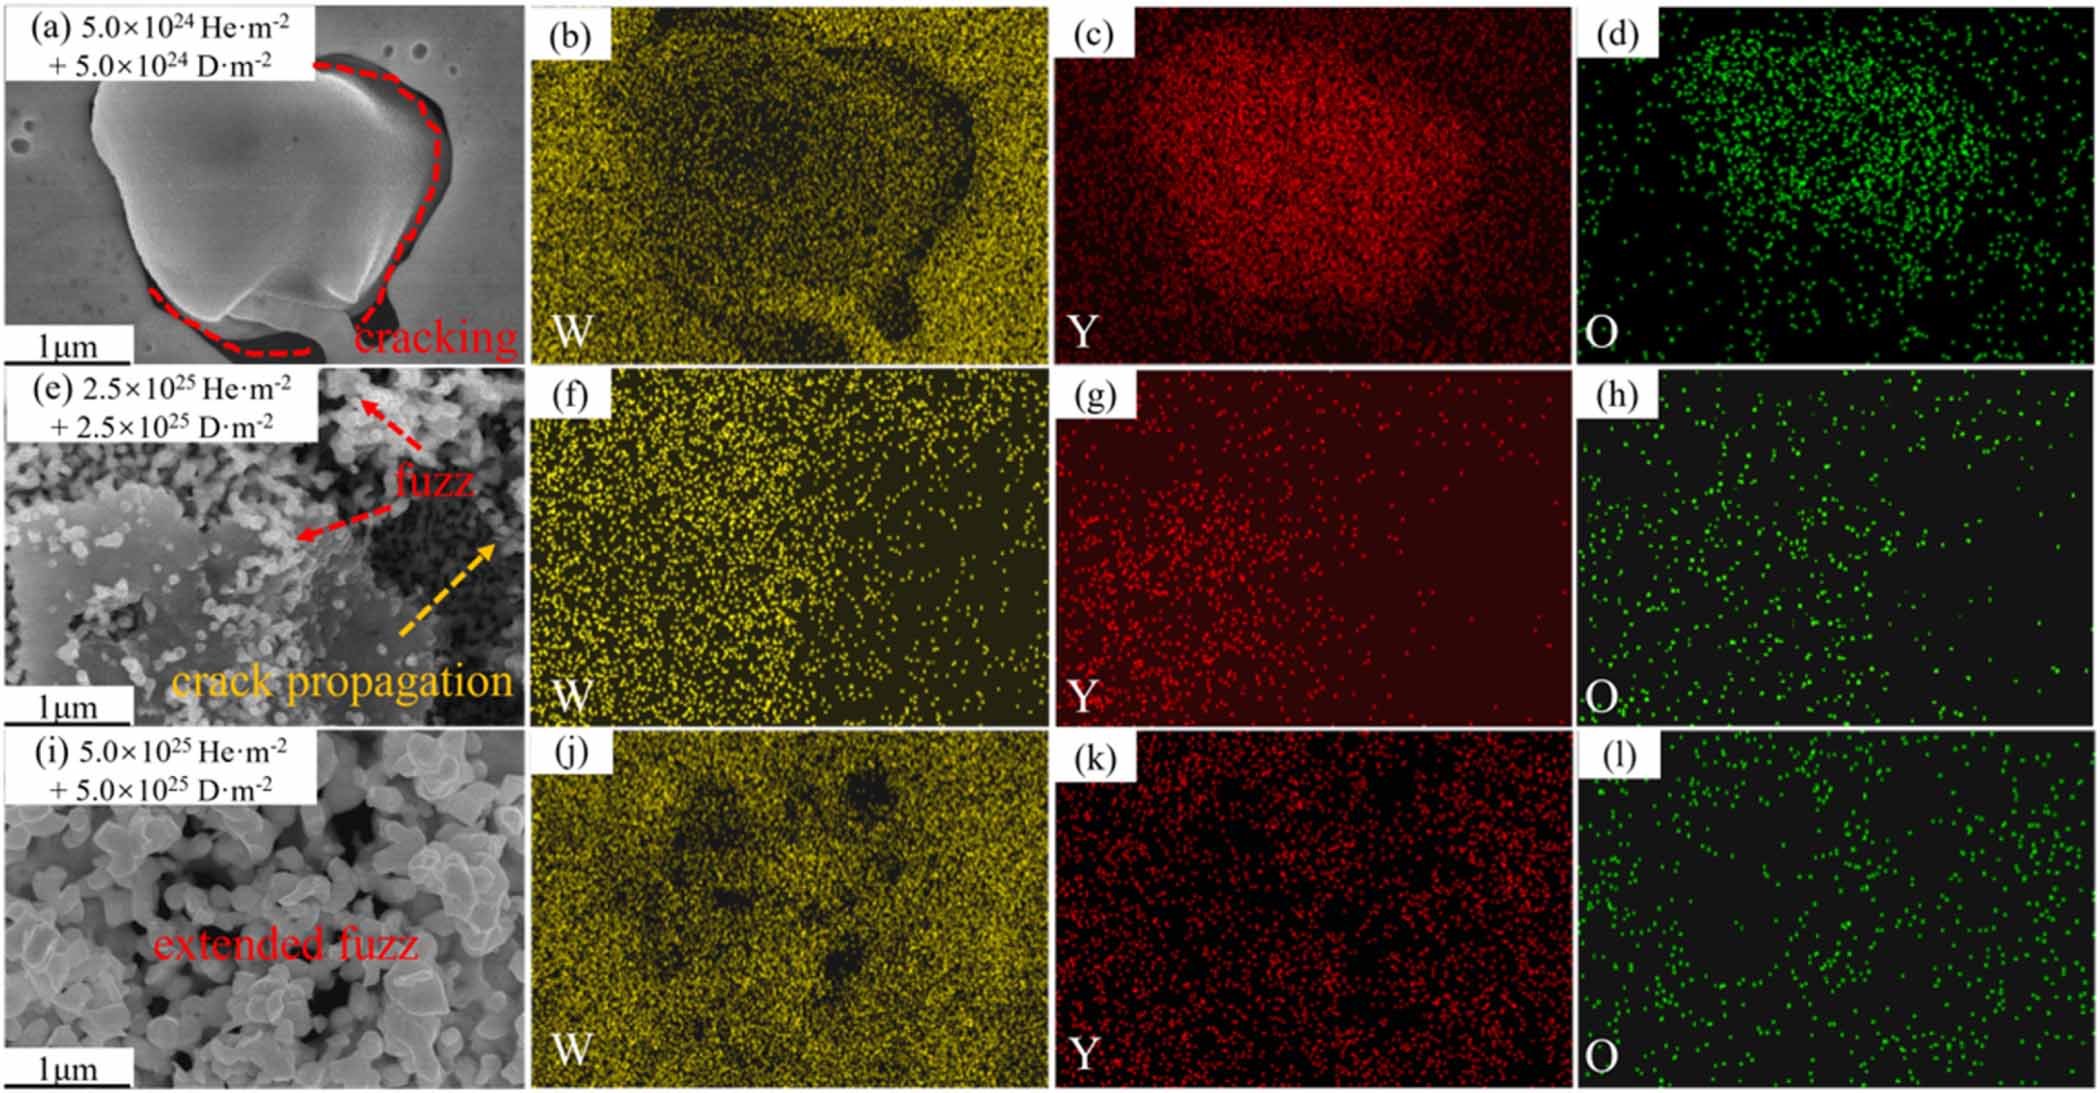
Standard image High-resolution imageHigh magnification SEM images of Y2O3 particle and corresponding EDS mapping of W–Y2O3 material after sequential He/D plasma exposure with different doses were shown in figure 8. At the dose of 5.0 × 1024 He·m−2 + 5.0 × 1024 D·m−2, the W–Y2O3 interface exhibits cracking, but no holes or broken area were observed at the surface of Y2O3 particle. When the dose reached 2.5 × 1025 He·m−2 + 2.5 × 1025 D·m−2, some holes were observed at the surface of the Y2O3 particle, and crack propagation was observed at the interface. Besides, some fuzz structure appears at the W and Y2O3 surface. At a higher dose (5.0 × 1025 He·m−2 + 5.0 × 1025 D·m−2), the fuzz structure further developed, and the interface became blurred. This may be why a larger mean particle size was measured in figures 7(c) and (f). In figure 8(b), it seems some W signal is observed in the particles, which may be due to the sputtering of W onto Y2O3 particles. However, it should be noted that the detection depth of EDS is higher than 1 μm, suggesting that these signals may also be caused by the W at the bottom of the particles. This issue will be further analyzed using cross-sectional samples in section 3.3. Besides, in figure 8(e), we can observe sparse W clusters deposited on the Y2O3 particle, which are likely formed due to subthreshold sputtering of Guseva et al [21] proposed that the subthreshold sputtering is attributed to the possible sputtering of W adsorbed atoms. The energy required to dislodge the adsorbed atoms from the surface by helium ion bombardment is approximately one-third of the physical sputtering threshold [22]. Considering that the physical sputtering threshold for W is over 100 eV [23, 24], and the energy of the helium ions used in this study is 60 eV, sub-sputtering is indeed a possible occurrence. The EDS element distribution simultaneously identifies W, Y, and O, which are mixed. In figure 8(i), fuzz is observed growing on the W substrate, crossing the phase boundary and extending into the particle region. The extension of this fuzz results in the partial obscuration of the particles. Similarly, Li et al [18] also reported a similar phenomenon.
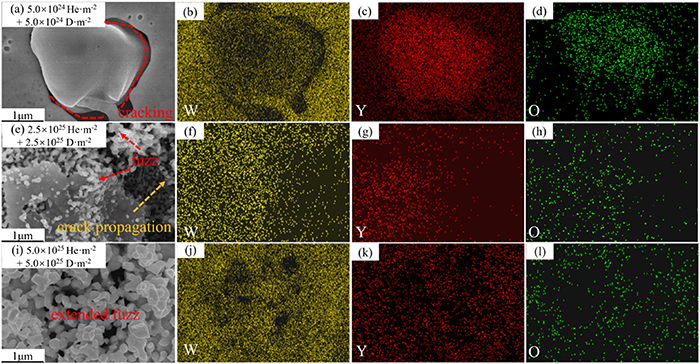
Figure 8. High magnification SEM images of Y2O3 particle and corresponding EDS mapping of W–Y2O3 material after sequential He/D plasma exposure with different dose. (a)–(d) 5.0 × 1024 He·m−2 + 5.0 × 1024 D·m−2, (e)–(h) 2.5 × 1025 He·m−2 + 2.5 × 1025 D·m−2, (i)–(l) 5.0 × 1025 He·m−2 + 5.0 × 1025 D·m−2.
Download figure:
Standard image High-resolution image3.1.4. Sequential D/He plasma exposure.
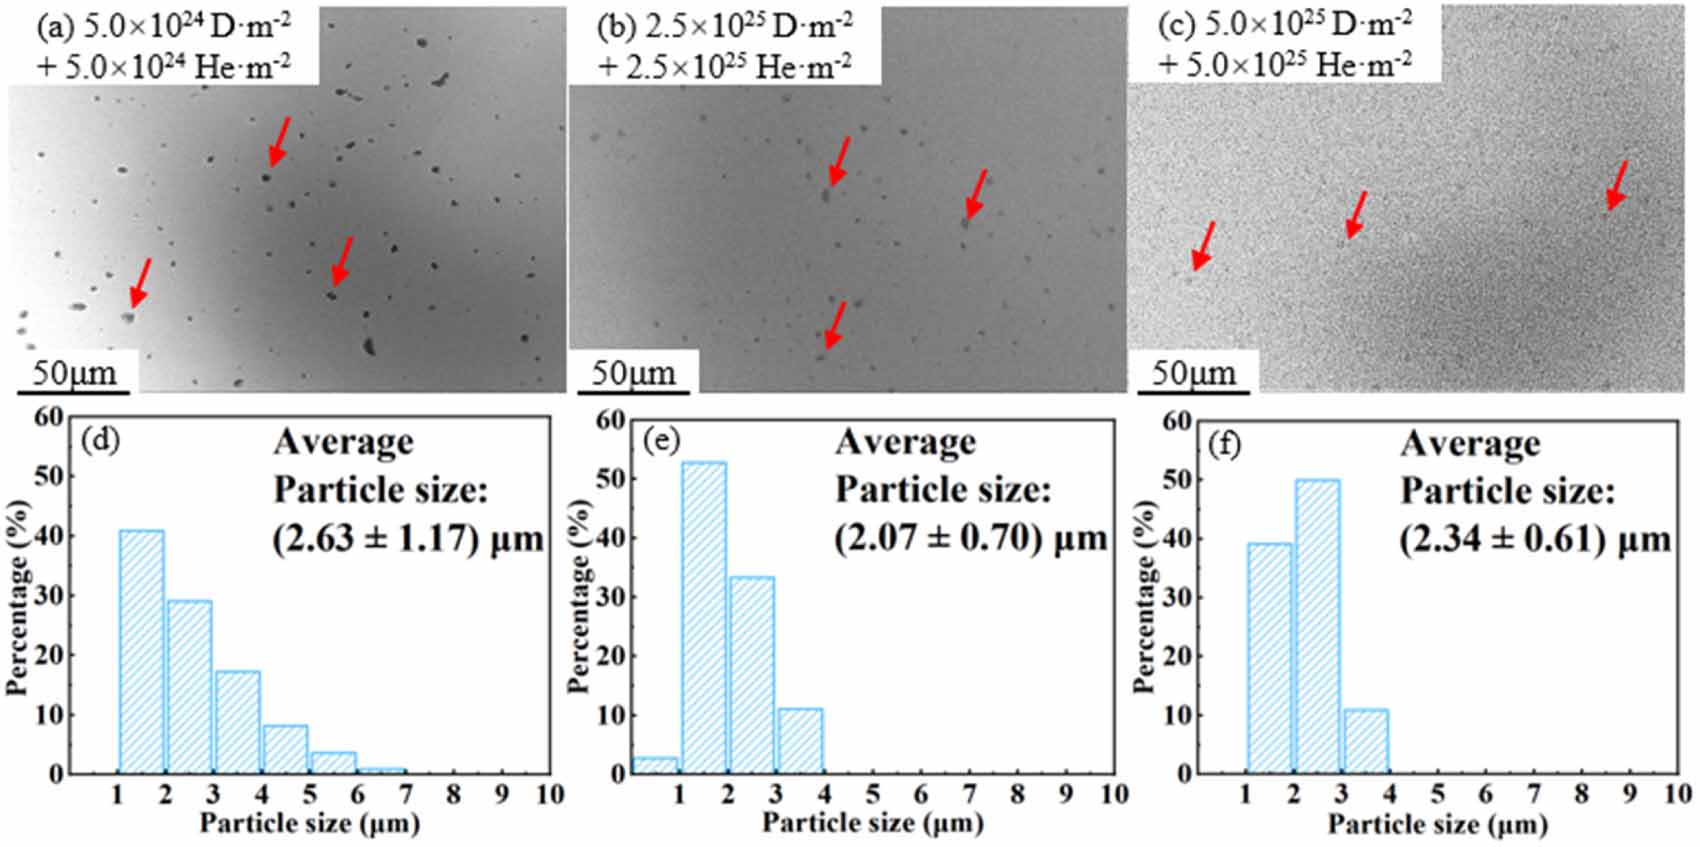
Low magnification SEM images and Y2O3 particle size distribution of W–Y2O3 material after sequential D/He plasma exposure with different doses were shown in figure 9. The results showed a similar trend on the particle size evolution. With the dose of 5.0 × 1024 D·m−2 + 5.0 × 1024 He·m−2, the mean particle size was (2.63 ± 1.17) μm, and it decreased to (2.07 ± 0.70) μm at the dose of 2.5 × 1025 D·m−2 + 2.5 × 1025 He·m−2. However, the average particle size increases to (2.34 ± 0.61) μm at the dose of 5.0 × 1025 D·m−2 + 5.0 × 1025 He·m−2. This may be due to the same reason as described in section 3.1.3, where particles are covered by fuzz, resulting in the invisibility of small particles.
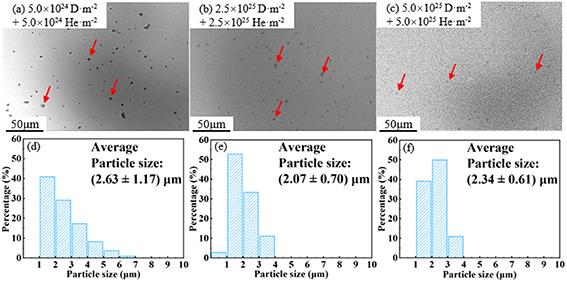
Figure 9. Low magnification SEM images and Y2O3 particle size distribution of W–Y2O3 material after sequential D/He plasma exposure with different doses. (a), (d) 5.0 × 1024 D·m−2 + 5.0 × 1024 He·m−2, (b), (e) 2.5 × 1025 D·m−2 + 2.5 × 1025 He·m−2, (c), (f) 5.0 × 1025 D·m−2 + 5.0 × 1025 He·m−2.
Download figure:
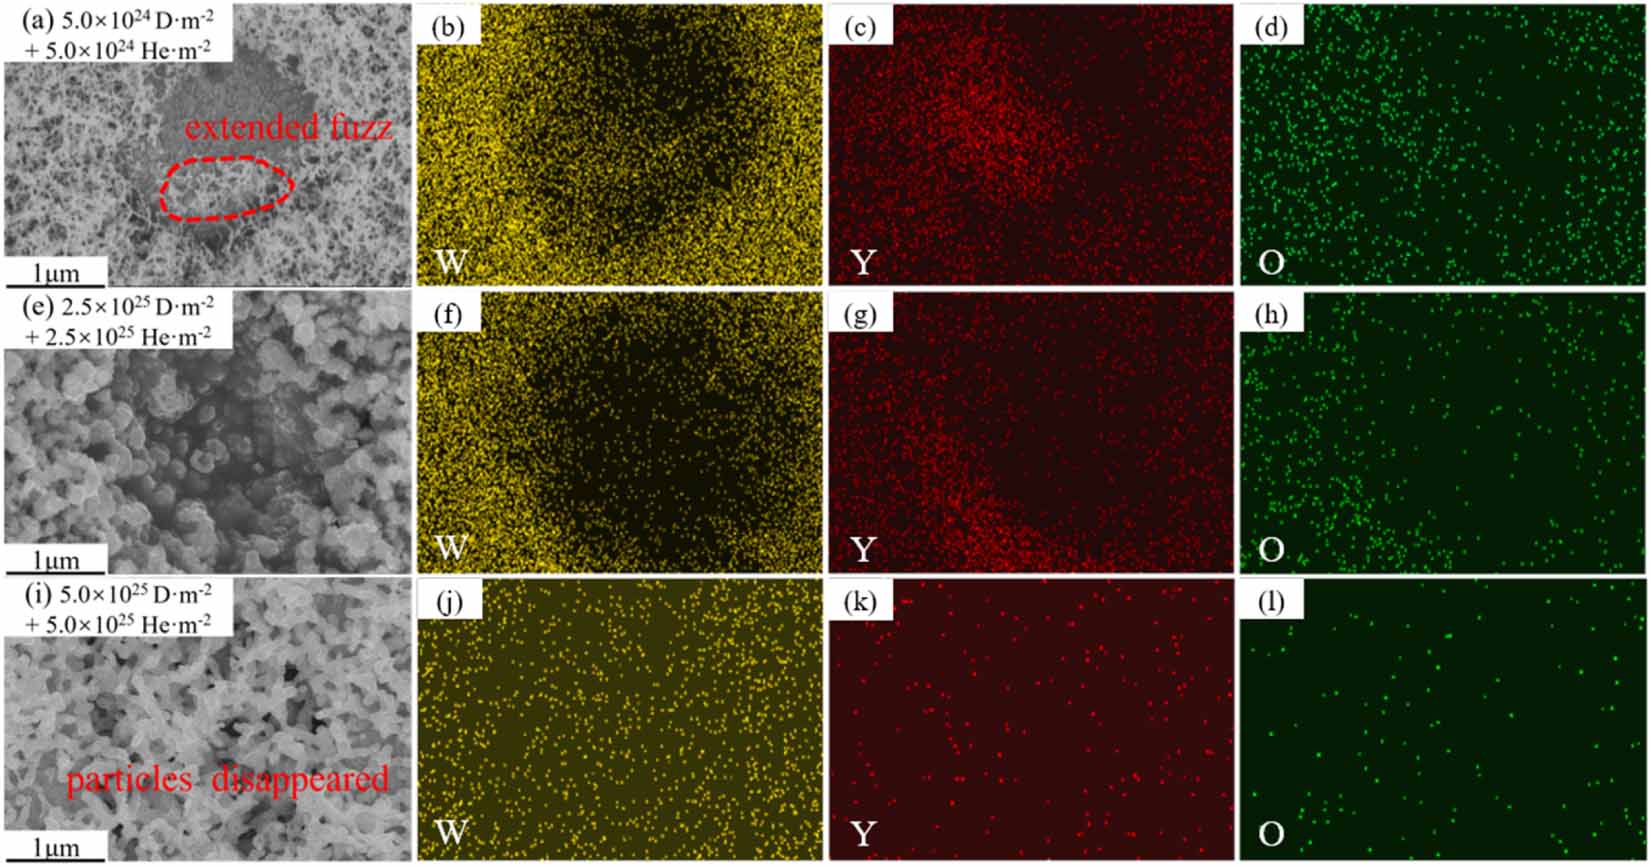
Standard image High-resolution imageHigh magnification SEM images of Y2O3 particle and corresponding EDS mapping of W–Y2O3 material after sequential D/He plasma exposure at different doses were shown in figure 10. As shown in figure 10(a), an obvious fuzz structure was observed at the W matrix and near the interface. Y2O3 particles were quickly covered by fuzz with increasing doses. Obviously, the development of fuzz structures and the damage to particles during D/He plasma exposure is more rapid than that during He/D plasma exposure. The formation of fuzz is mainly related to the evolution of bubbles as well as the interaction between D/He and defects such as vacancies [25]. This phenomenon implies a significant synergistic effect between D/He during plasma exposure.
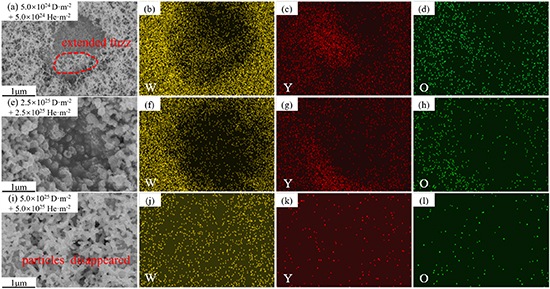
Figure 10. High magnification SEM images of Y2O3 particle and corresponding EDS mapping of W–Y2O3 material after sequential D/He plasma exposure with different doses. (a)–(d) 5.0 × 1024 D·m−2 + 5.0 × 1024 He·m−2, (e)–(h) 2.5 × 1025 D·m−2 + 2.5 × 1025 He·m−2, (i)–(l) 5.0 × 1025 D·m−2 + 5.0 × 1025 He·m−2.
Download figure:
Standard image High-resolution image3.2. The evolution of W–Y2O3 surface morphology
3.2.1. D plasma exposure.
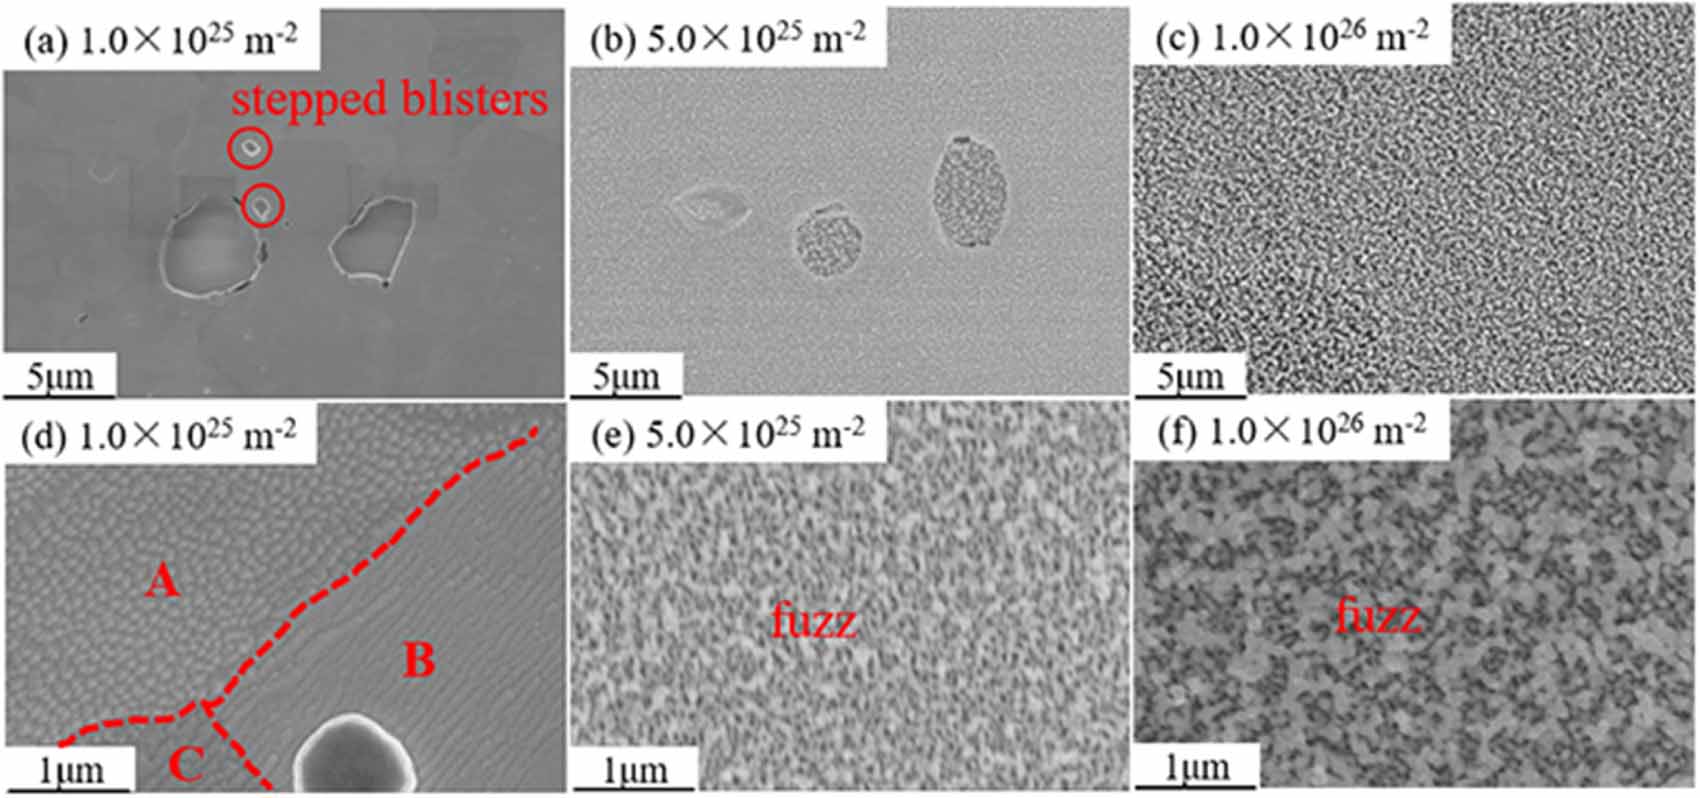
Besides the damage of Y2O3 particles, the damage of the W matrix was observed in all samples. Figure 11 shows the surface morphology of W–Y2O3 material after D plasma exposure with different doses, where figures 11(a)–(c) show the low-magnification morphology and figures 11(d)–(f) show the corresponding high-magnification image. At the dose of 1.5 × 1025 D·m−2, it is not difficult to find typical stepped D blister from figure 11(a), which can be attributed to the lateral stress [26]. When the concentration of D atoms reaches supersaturation, the lateral stress induced by supersaturated D atoms results in local cracking of the W matrix [27]. At the same time, the dislocations start to slip to release the stress. Note that the most common slip systems for BCC metals are [111]{110}, thus, dislocations may slide along the [111] direction at {110} crystal plane, leading to the appearance of stepped D bubbles [28]. Figure 11(d) shows the high magnification image at the dose of 1.5 × 1025 D·m−2, cone-shaped and wavy were observed at positions A and B, respectively. This phenomenon indicated that the damage of tungsten is affected by crystallographic orientation [29]. When the dose reached 5.0 × 1025 D·m−2, nano-like fluffy structures (fuzz) were observed, and it was further evolved into coarser at a dose of 1.0 × 1026 D·m−2.
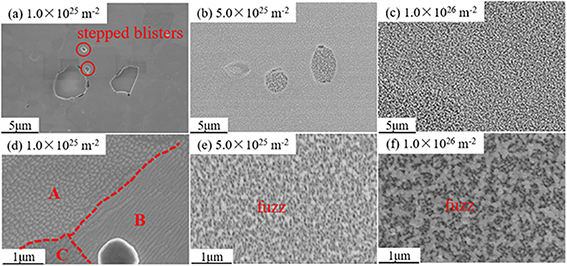
Figure 11. SEM images of W–Y2O3 at different doses of D plasma exposure. (a)–(c) Low magnification SEM images, (d)–(f) high magnification SEM images. (a), (d) 1.0 × 1025 D·m−2, (b), (e) 5.0 × 1025 D·m−2,(c), (f) 1.0 × 1026 D·m−2.
Download figure:
Standard image High-resolution image3.2.2. He plasma exposure.
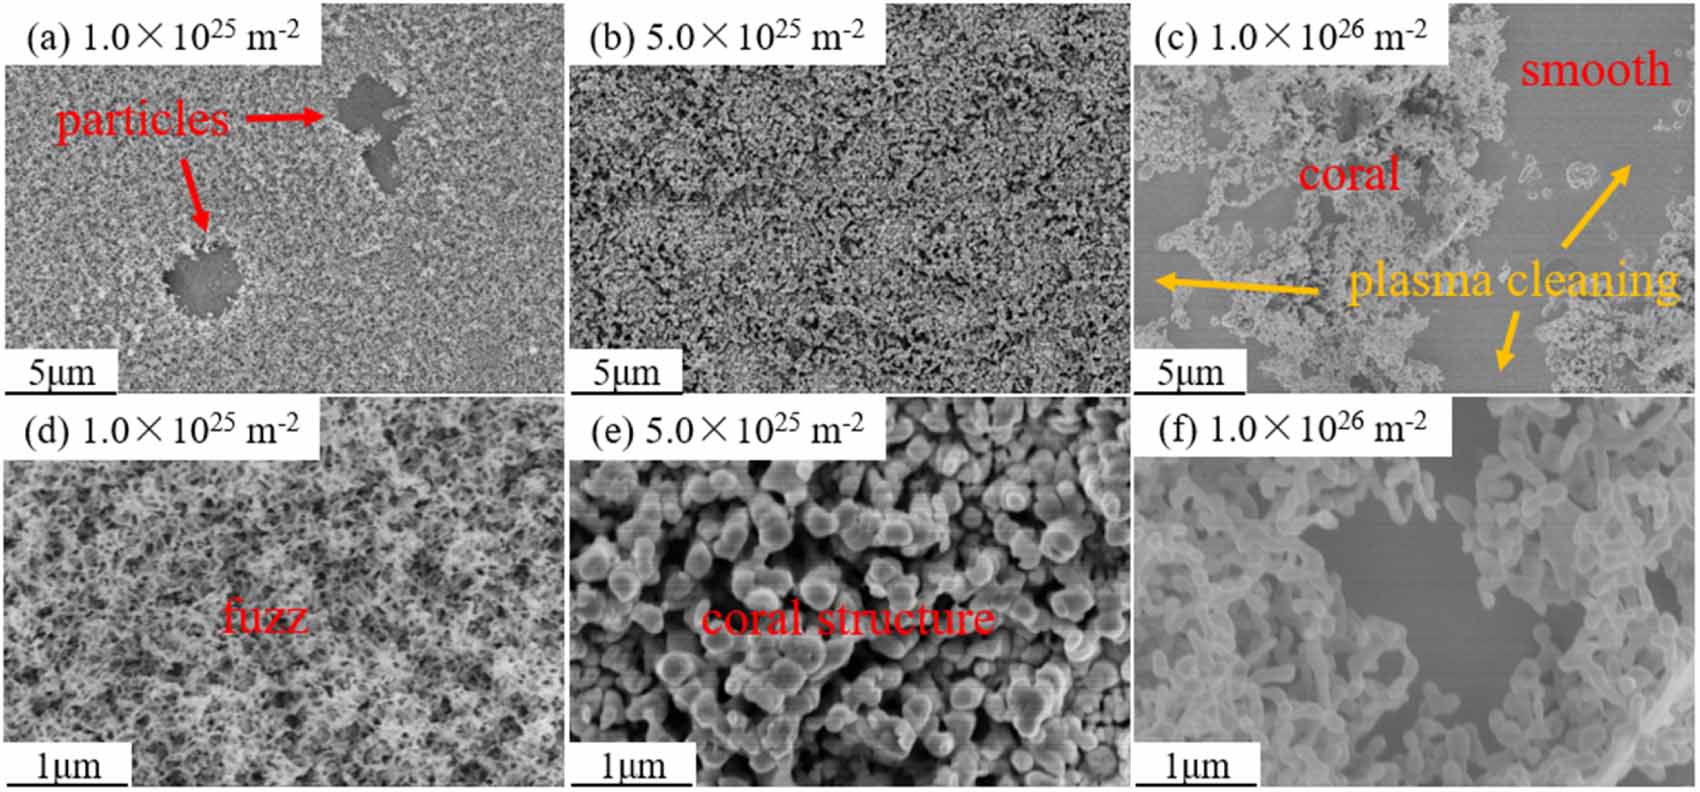
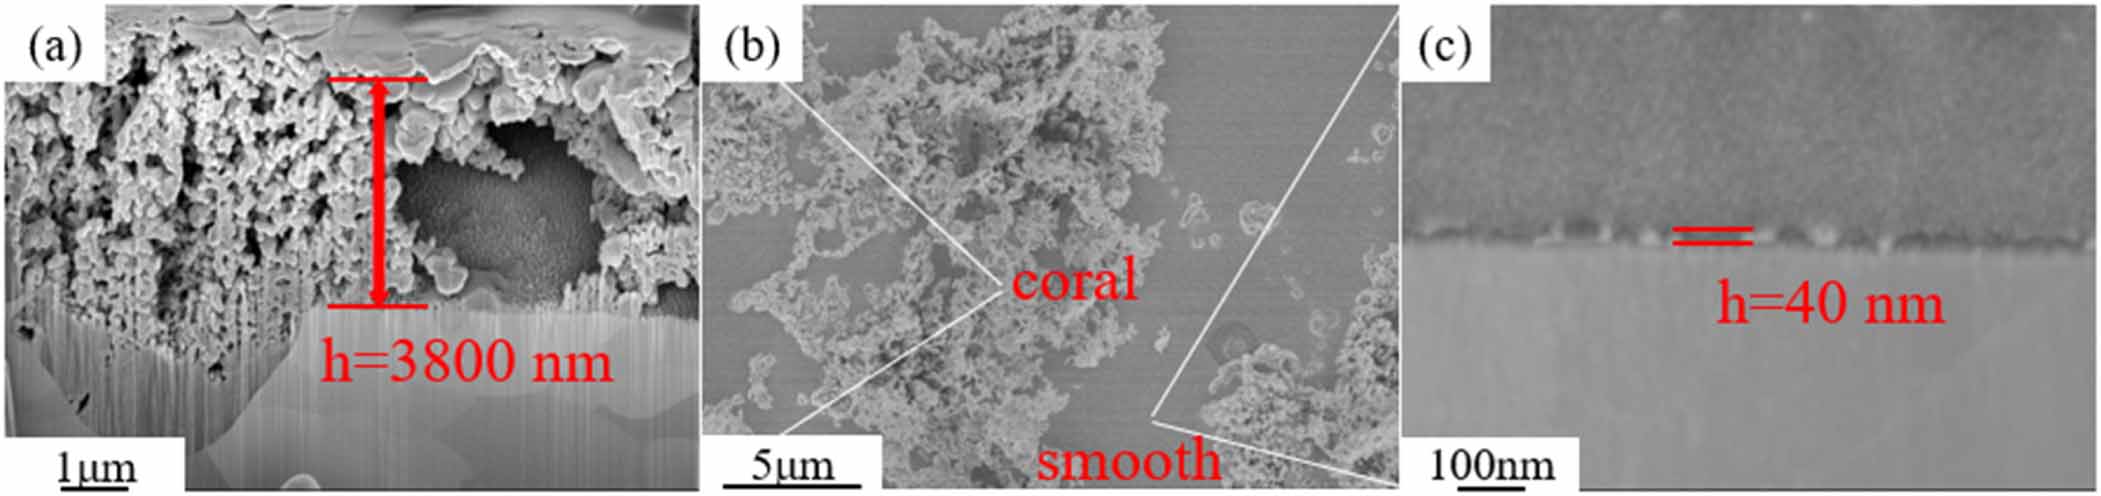
The surface morphology of W–Y2O3 material under different He plasma irradiation was shown in figure 12. As shown in figure 12(a), morphology was different from that of the H plasma exposure sample, with an obvious fuzzy surface being observed. This phenomenon indicates that He causes much greater damage to the W matrix than D, which may be due to the lower solubility of He in W. With the dose increasing, some coral-like morphology was observed. For example, figure 12(e) shows the combination of fuzz and holes at the surface of W matrix with a dose of 5.0 × 1025 He m−2. Interestingly, when the dose reaches 1.0 × 1026 He m−2, the surface has only localized coral structures, which have been partially detached, and the detached substrate surface becomes smooth again. It seems like some kind of the plasma cleaning [30].
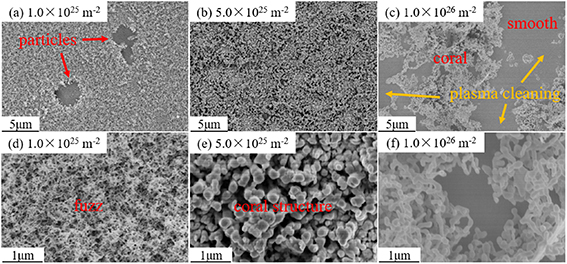
Figure 12. SEM images of W–Y2O3 at different doses of He plasma exposure. (a)–(c) Low-magnification SEM images, (d)–(f) high-magnification SEM images. (a), (d) 1.0 × 1025 He·m−2,(b), (e) 5.0 × 1025 He·m−2,(c), (f) 1.0 × 1026 He·m−2.
Download figure:
Standard image High-resolution image3.2.3. Sequential He/D plasma exposure.
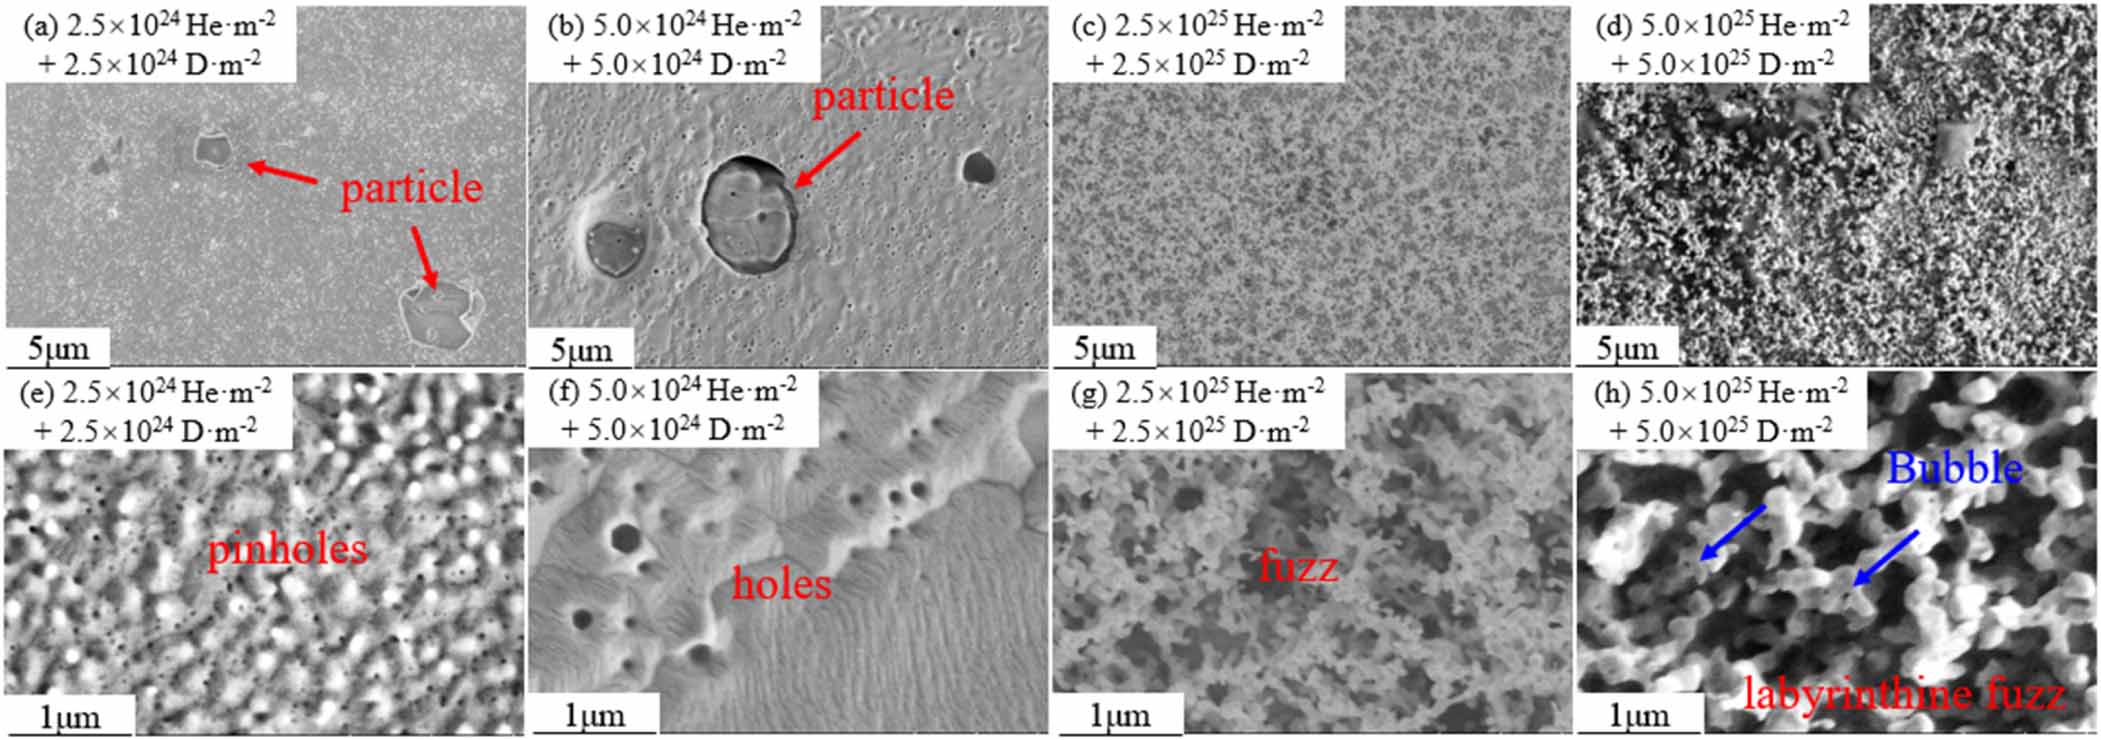
The surface morphology of W–Y2O3 material under different He/D plasma exposures is shown in figure 13. With a dose of 2.5 × 1024 He·m−2 + 2.5 × 1024 D·m−2, only a large number of high-density spherical structures (white granular dots) with a rough surface can be found as shown in figure 13(a). High magnification image shows a combination of spherical and pinhole-like. With increasing doses, the conjugate evolves into larger pores, which is attributed to the large number of aggregated nanoscale He vesicles under the near-surface layer. When the dose increased to 2.5 × 1025 He·m−2 + 2.5 × 1025 D·m−2, the fuzz structure appeared. At a dose of 5.0 × 1025 He·m−2 + 5.0 × 1025 D·m−2, the surface shows a three-dimensional labyrinthine fuzz structure and the fuzz is distributed with bubbles, which is closely related to the already formed fuzz structure described above.
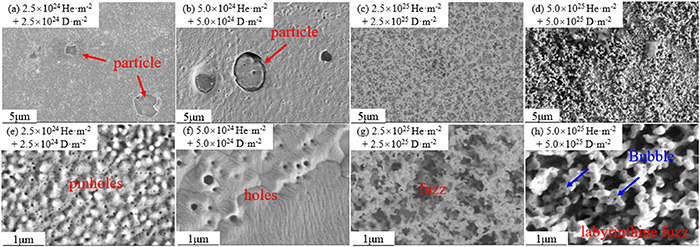
Figure 13. SEM images of W–Y2O3 at different doses of He/D plasma exposure. (a)–(d) Low-magnification SEM images, (e)–(h) high-magnification SEM images. (a), (e) 2.5 × 1024 He·m−2 + 2.5 × 1024 D·m−2, (b), (f) 5.0 × 1024 He·m−2 + 5.0 × 1024 D·m−2, (c), (g) 2.5 × 1025 He·m−2 + 2.5 × 1025 D·m−2, (d), (h) 5.0 × 1025 He·m−2 + 5.0 × 1025 D·m−2.
Download figure:
Standard image High-resolution image3.2.4. Sequential D/He plasma exposure.
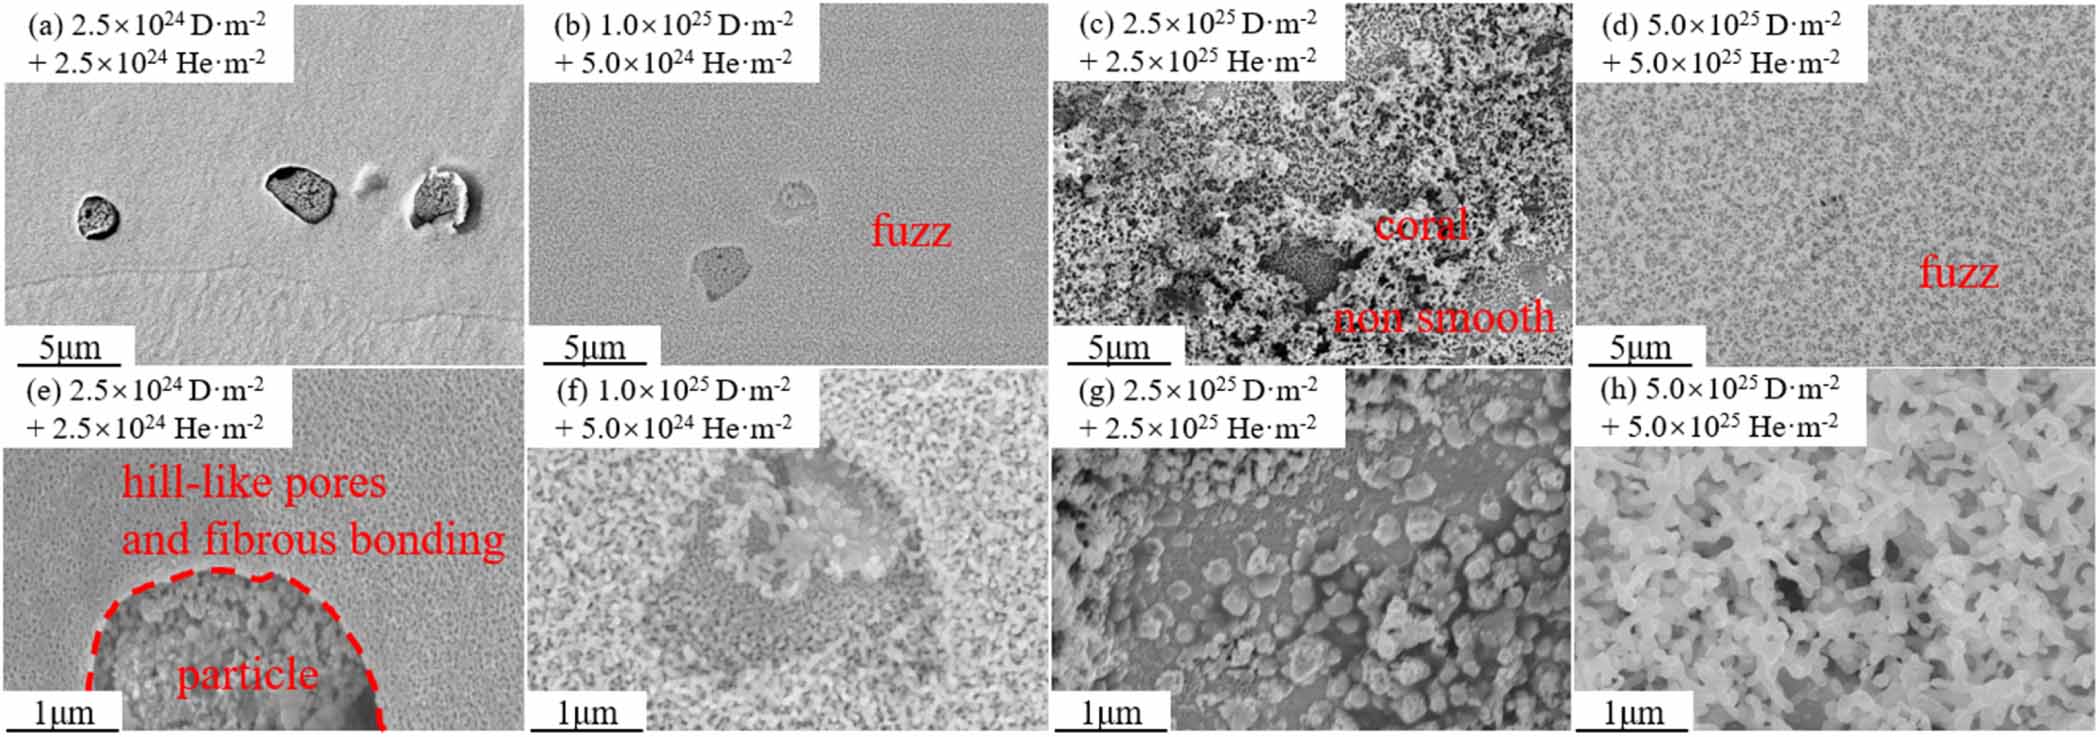
Figure 14 shows the surface morphology of W–Y2O3 material under different doses of D/He plasma exposure. At the dose of 2.5 × 1024 D·m−2 + 2.5 × 1024 He·m−2, the hill-like pores and fibrous bonding can be clearly observed in figure 14(e). As described in section 3.1.4, the D/He irradiation causes more damage than He/D. With a dose of 1.0 × 1025 D·m−2 + 1.0 × 1025 He·m−2, the familiar fuzz structure was observed as shown in figure 14(f). When the dose reaches 2.5 × 1025 D·m−2 + 2.5 × 1025 He·m−2, the local region of fuzz is stacked densely, the detached fuzz region no longer leaves a smooth morphology (like figure 12(c)), but a combination of pores and fibrous structure. When the dose reached 5.0 × 1025 D·m−2 + 5.0 × 1025 He·m−2, the substrate surface re-evolved into a relatively flat labyrinth-type fuzz layer [31].
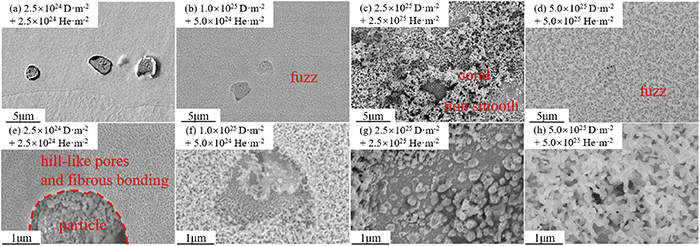
Figure 14. SEM images of W–Y2O3 at different doses of D/He plasma exposures. (a)–(d) Low-magnification SEM images, (e)–(h) high-magnification SEM images. (a), (e) 2.5 × 1024 D·m−2 + 2.5 × 1024 He·m−2, (b), (f) 1.0 × 1025 D·m−2 + 5.0 × 1024 He·m−2, (c), (g) 2.5 × 1025 D·m−2 + 2.5 × 1025 He·m−2, (d), (h) 5.0 × 1025 D·m−2 + 5.0 × 1025 He·m−2.
Download figure:
Standard image High-resolution image3.3. The cross-sectional morphology of fuzz structure
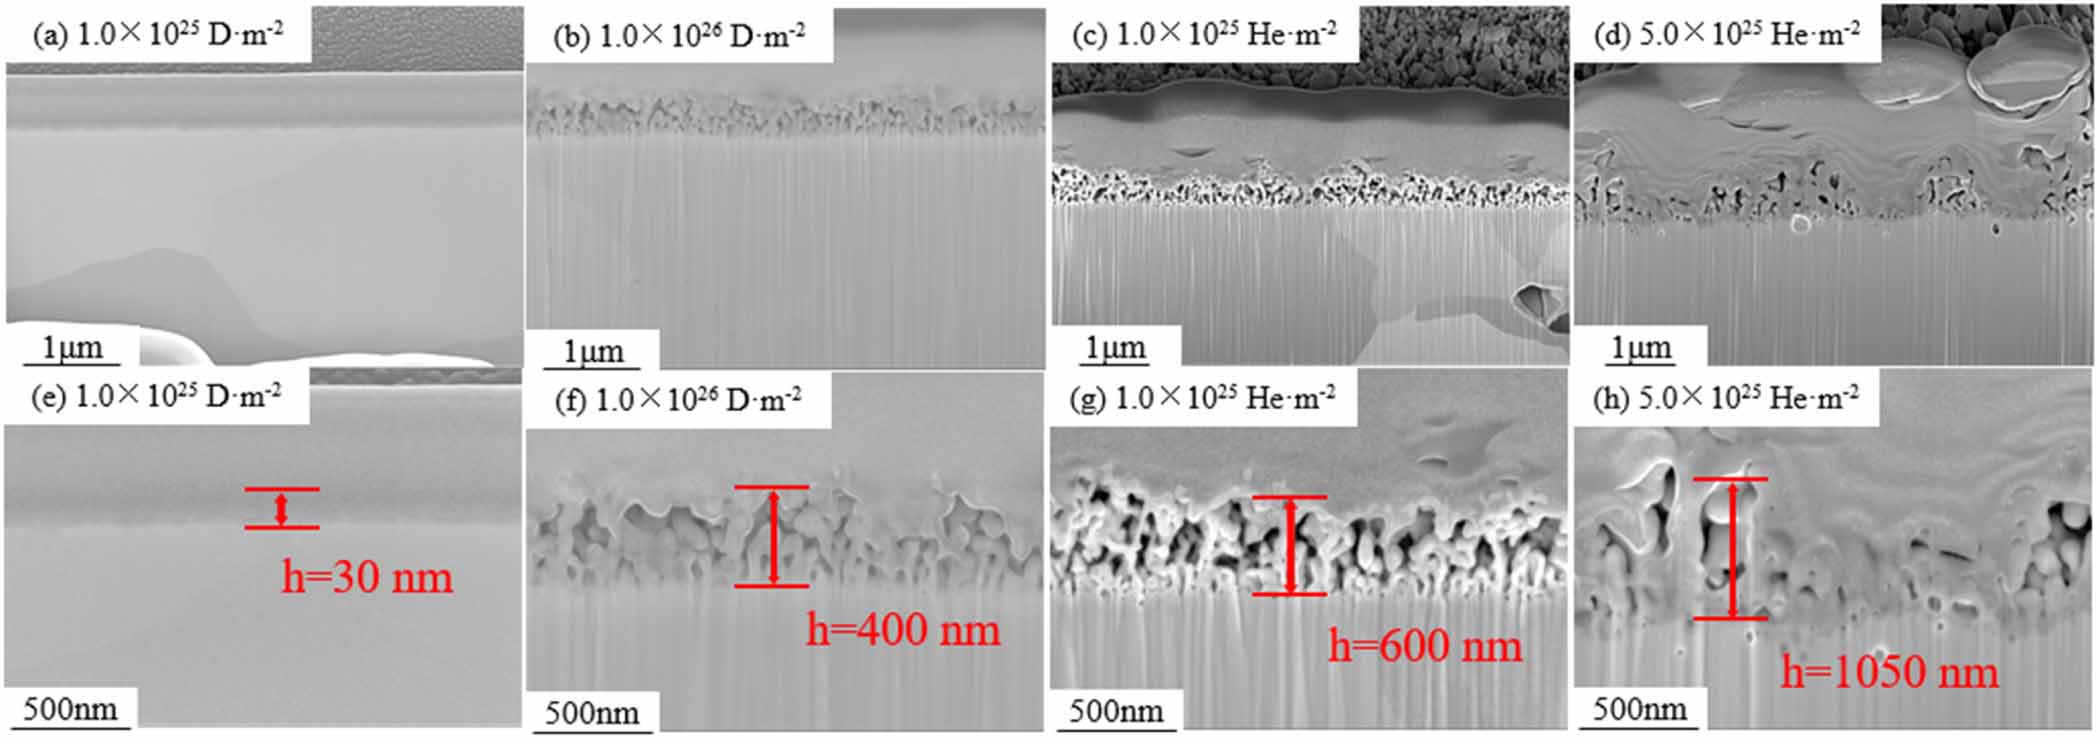
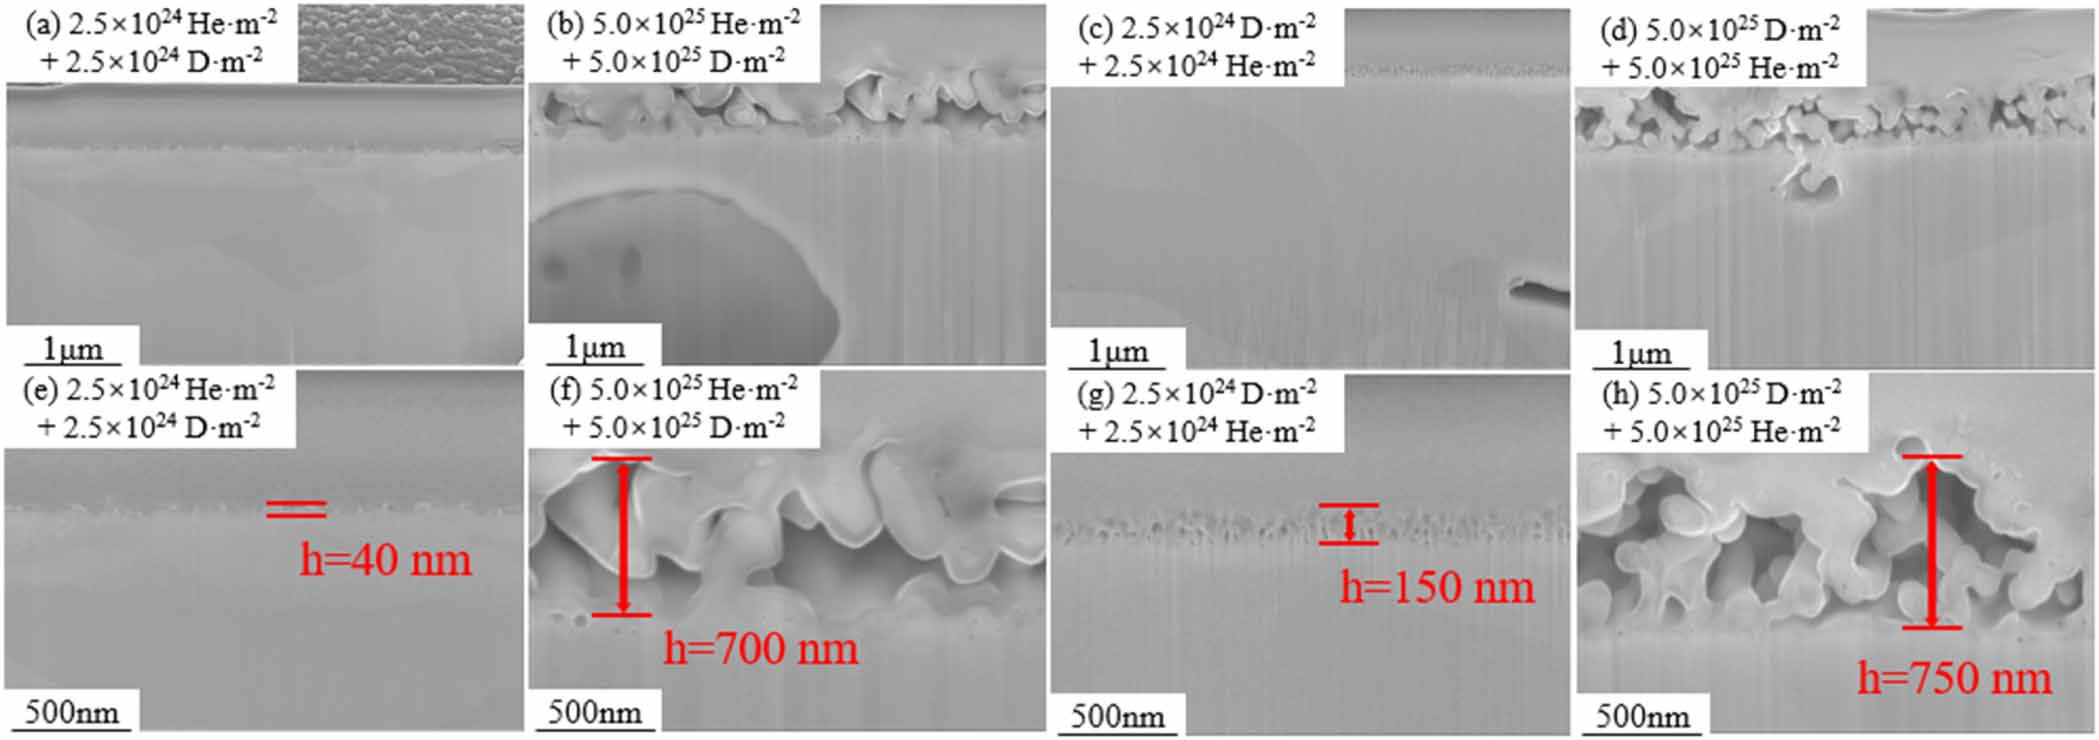
Figure 15 shows the cross-sectional SEM images of fuzz structure after exposure to single D or He plasma. At the dose of 1 × 1025 D·m−2, the fuzz layer was almost invisible, and the thickness was about 30 nm. When the D plasma dose reached 1.0 × 1026 D·m−2, the thickness of the fuzz layer increased to about 400 nm. However, the thickness of the fuzz layer was measured as about 630 nm with a dose of 1 × 1025 He·m−2, which is larger than that of D. When the dose increased to 5 × 1025 He·m−2, the fuzz developed to over 1 μm and some fuzz peeled off, leaving a thin area. Figure 16 shows the cross-sectional SEM images of the fuzz structure after exposure to sequential He/D or D/He plasma. At the dose of 2.5 × 1024 He·m−2 + 2.5 × 1024 D·m−2, the fuzz layer was about 40 nm, and it developed to 700 nm with a dose of 5 × 1025 He·m−2 + 5 × 1025 D·m−2. In D/He plasma exposure, the initial thickness (at the dose of 2.5 × 1024 D·m−2 + 2.5 × 1024 He·m−2) of the fuzz layer was 150 nm, and it developed to about 750 nm at the dose of 5 × 1025 D·m−2 + 5 × 1025 He·m−2.
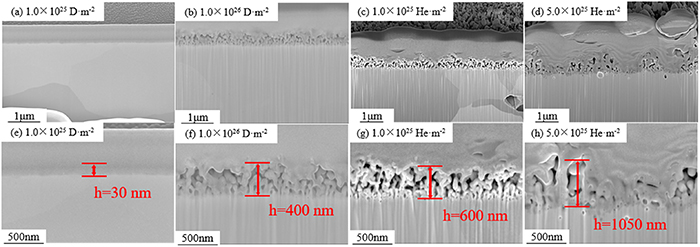
Figure 15. The cross-sectional SEM images of fuzz structure after exposure to single D or He plasma. (a), (e) 1.0 × 1024 D·m−2, (b), (f) 1.0 × 1026 D·m−2, (c), (g) 1.0 × 1025 He·m−2, (d), (h) 5.0 × 1025 He·m−2.
Download figure:
Standard image High-resolution image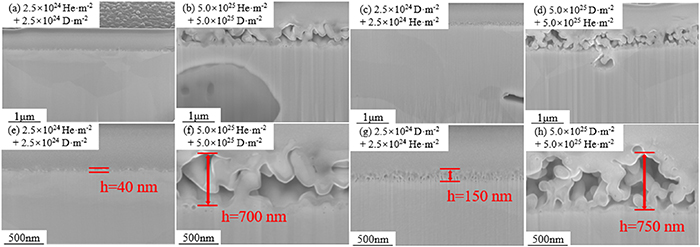
Figure 16. The cross-sectional SEM images of fuzz structure after exposure to sequential He/D or D/He plasma. (a), (e) 2.5 × 1024 He·m−2 + 2.5 × 1024 D·m−2, (b), (f) 5.0 × 1025 He·m−2 + 5.0 × 1025 D·m−2, (c), (g) 2.5 × 1024 D·m−2 + 2.5 × 1024 He·m−2, (d), (h) 5.0 × 1025 D·m−2 + 5.0 × 1025 He·m−2.
Download figure:
Standard image High-resolution imageIt should be noted that the distribution of fuzz is inhomogeneous at high exposure doses. Figure 17 shows the fuzz structure after exposure to He plasma with a dose of 1 × 1026 He·m−2. In some areas, very thick fuzz layers (>3 μm) can be observed, while in other areas, the fuzz layer is very thin (<50 nm). This result is similar to figure 12(c), the possible reason is that the surface fuzz is cleaned during plasma exposure.
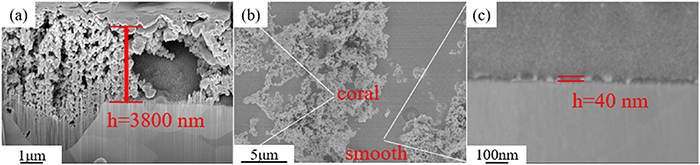
Figure 17. The surface and cross-sectional SEM images of fuzz structures after exposure to single He plasma at a dose of 1.0 × 1026 He·m−2.
Download figure:
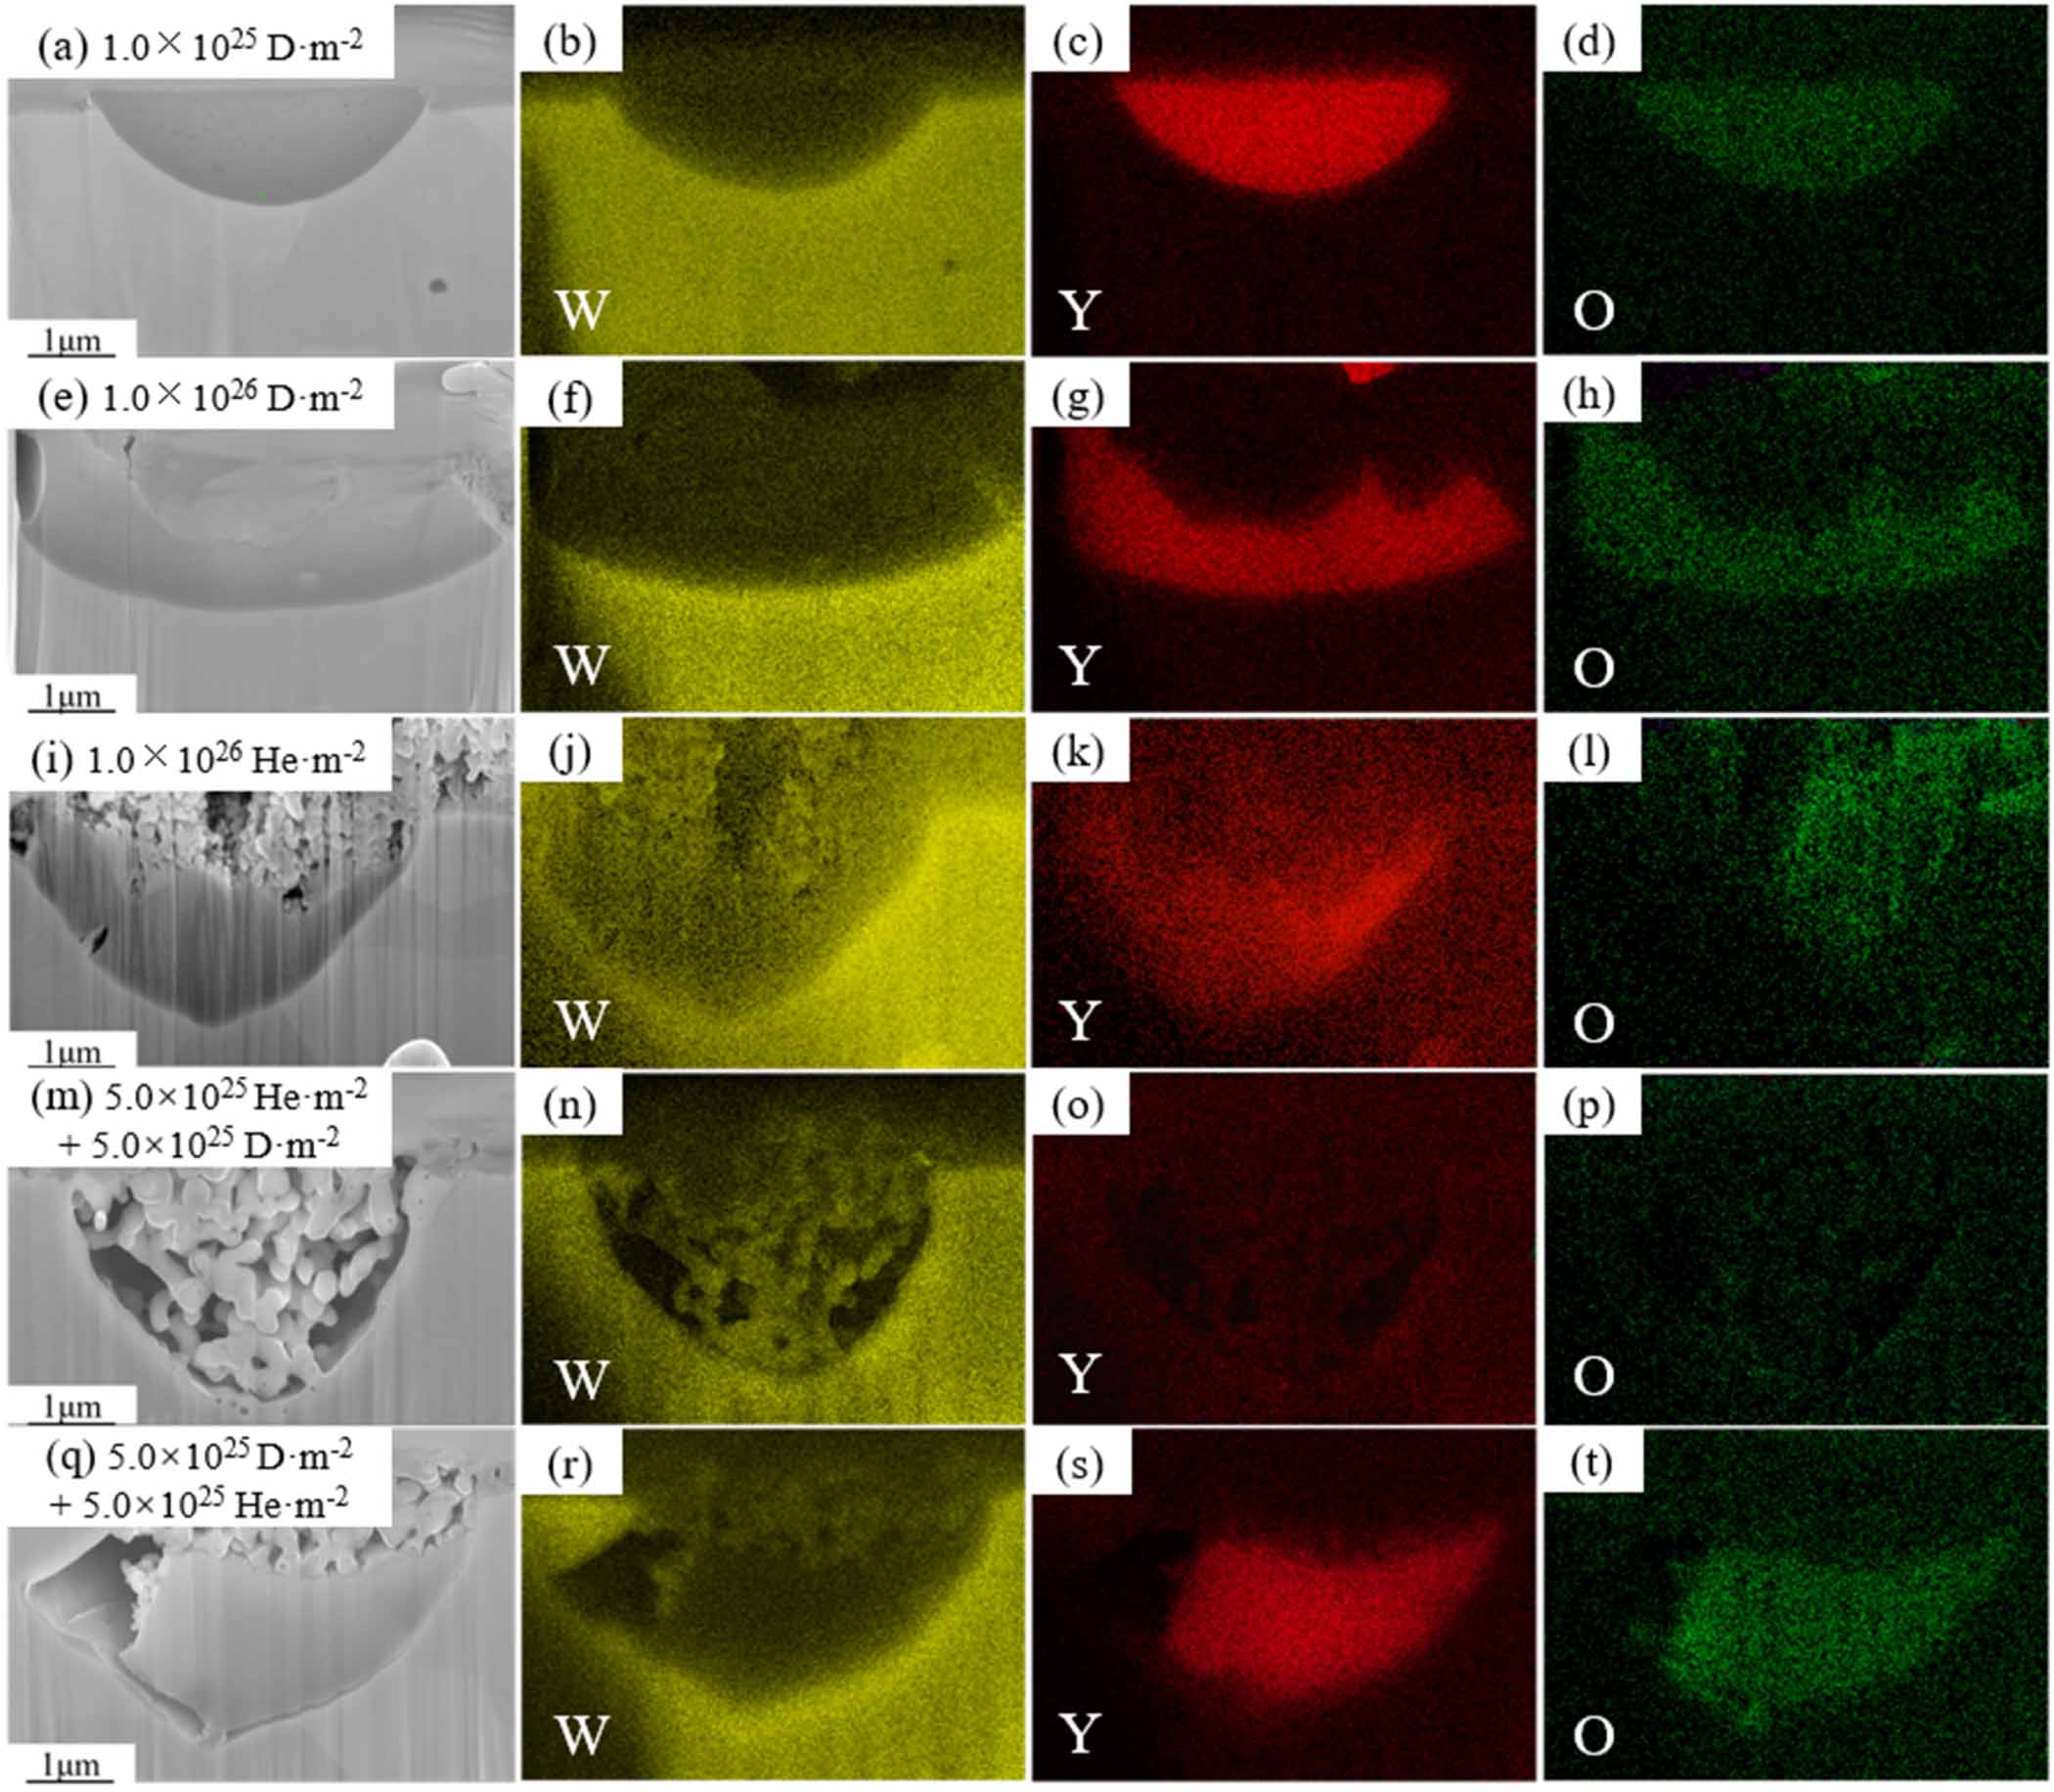
Standard image High-resolution imageFigure 18 shows the cross-sectional SEM images of fuzz on Y2O3 particles and the corresponding EDS mapping. Figures 18(a) and (e) show the element distribution after single D plasma exposure with a dose of 1.0 × 1025 D·m−2 and 1.0 × 1026 D·m−2, it can be seen that Y2O3 particles are etched. This result indicates that Y2O3 particles are sputtered faster than the W matrix. However, figures 18(i), (m), and (q) show that the Y2O3 particles are covered by fuzz and the fuzz layer on the surface of Y2O3 particles is composed of W. A reasonable explanation is that the fuzz on the surface of Y2O3 particles is mainly formed by the deposition of W atoms.
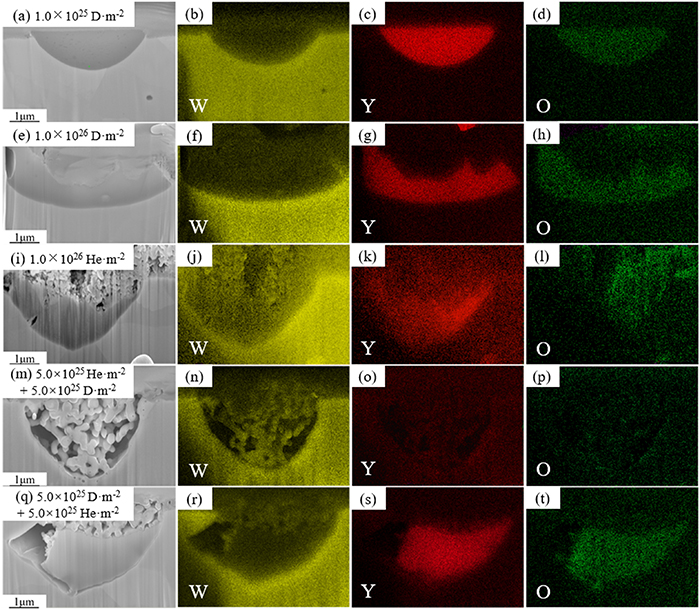
Figure 18. The cross-sectional SEM images of fuzz on Y2O3 particles and the corresponding EDS mapping of the W–Y2O3 material after single D, He, and sequential He/D, D/He plasma exposure.
Download figure:
Standard image High-resolution image4. Discussion
4.1. The evolution of Y2O3 particle
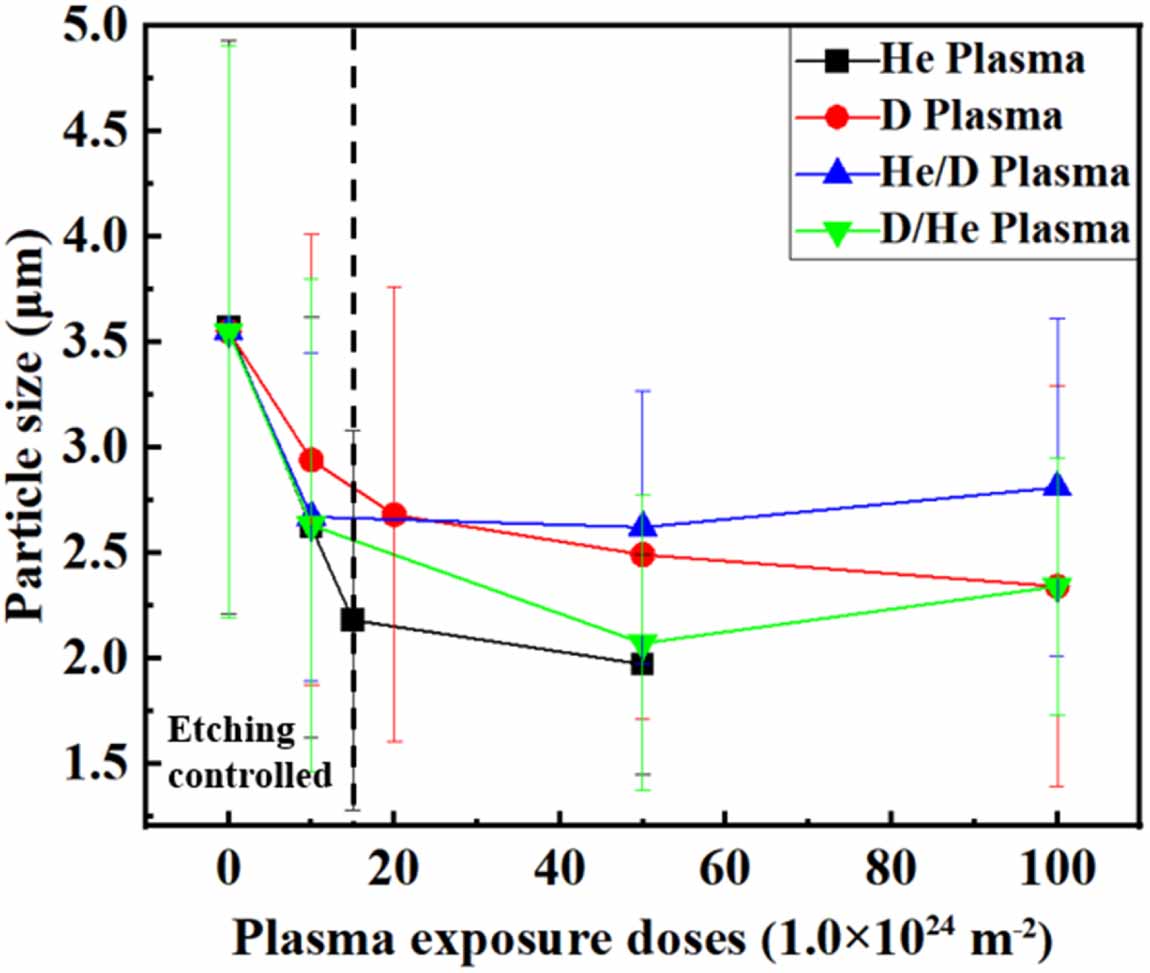
It has been widely verified that the addition of Y2O3 has a great effect on the mechanical properties of W-based alloy. However, as described above, the average size of Y2O3 seems to have decreased, suggesting that Y2O3 particles seem to undergo etching or sputtering, which will reduce the particle size. On the other hand, the deposition of W will lead to an ‘increase’ in particle size, which is not really an increase but only a visual effect. Thus, the evolution of particles can be divided into three different situations: etching-controlled, deposition-controlled and mixed-controlled. Figure 19 shows the average Y2O3 particle size as a function of irradiation dose. The Y2O3 particle size evolution under D or He plasma exposure shows similar tendencies. The particle size evolution is etching controlled at first, and it changes to mixed controlled with a dose higher than 2 × 1025 m−2. However, the particle evolution under sequential D/He or He/D plasma exposure is different. Both kinds of sequential exposure show an etching-controlled process at first and change to the deposition-controlled process finally. The difference between them is the dose entering the deposition-controlled process. In D/He plasma exposure, the size evolution begins deposition-controlled at a dose of about 5 × 1025 m−2, which is just the end of the etching-controlled stage. In He/D exposure, the etching-controlled stage ended at a dose of 1 × 1025 m−2, and then it changed to mixed-controlled until 5 × 1025 m−2. Finally, the particle size evolution was deposition-controlled, which shows a mean size increase.
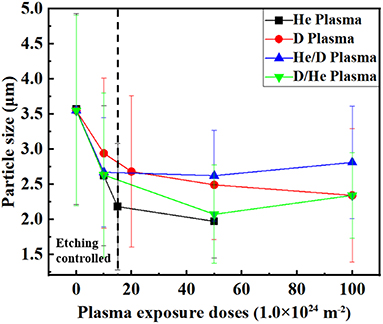
Figure 19. The average Y2O3 particle size as a function of plasma exposure doses. The standard deviation was used as error bars.
Download figure:
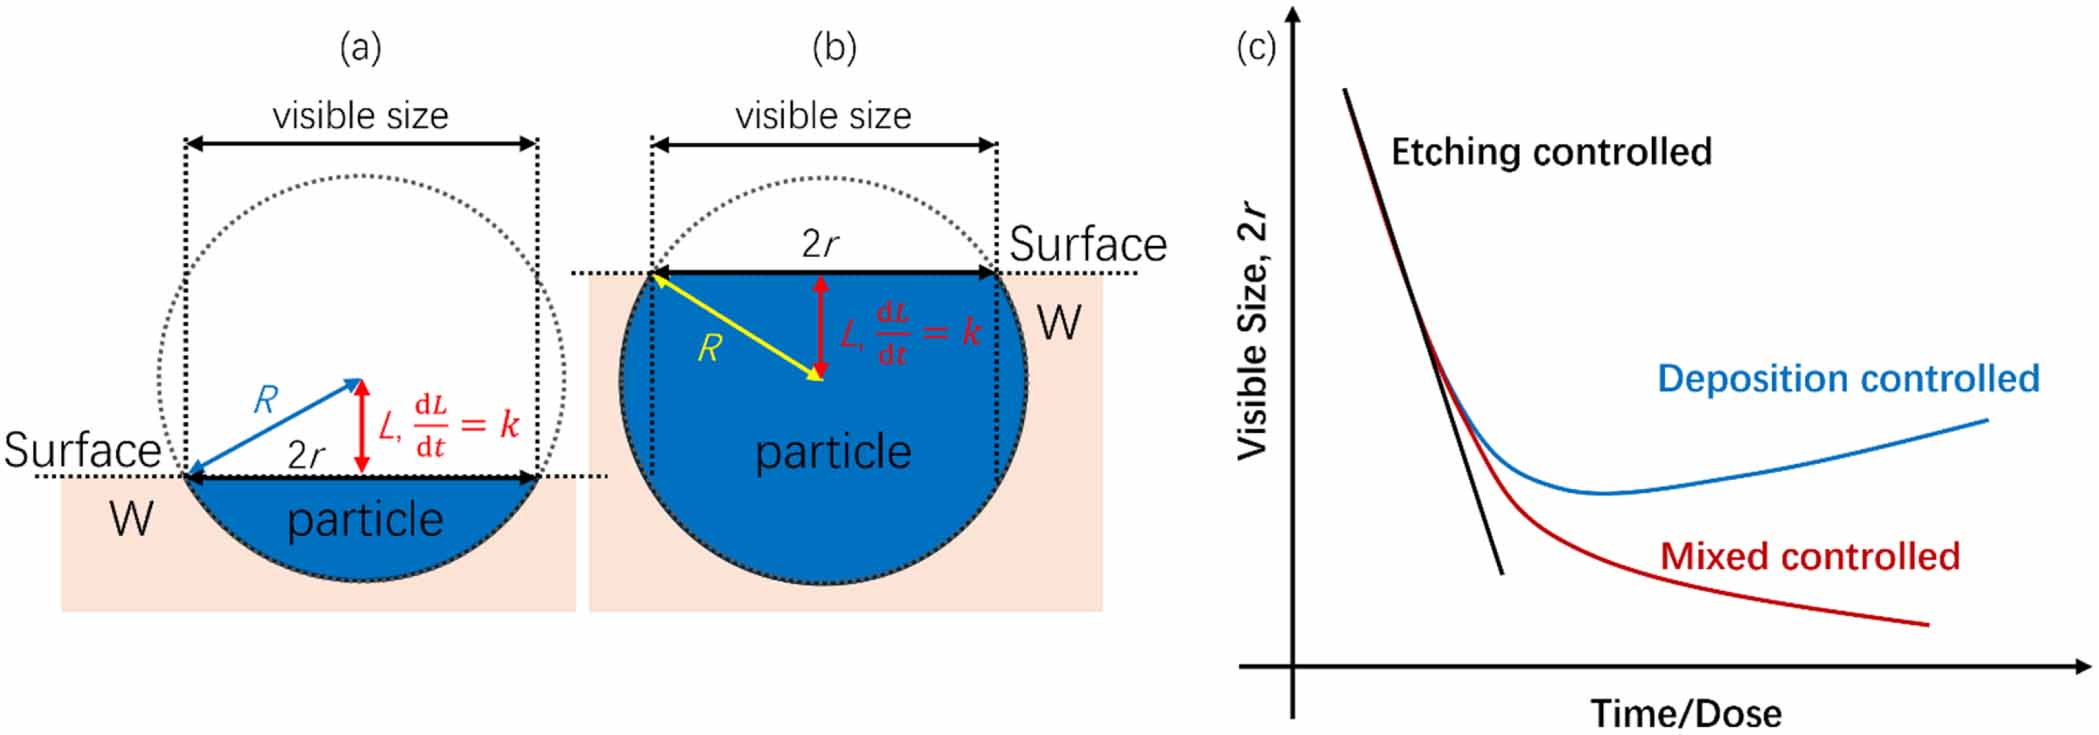
Standard image High-resolution imageFigure 20 shows the sketch of particle size evolution in different situations. Considering that the visible size of particles is the cross-section (surface of sample) of particles, the visible size of particles is dependent on particle shape, as shown in figures 20 (a) and (b). For an etching-controlled size evolution of a spherical Y2O3 particle with a constant etching rate k, if the surface is on the lower hemisphere of it (as shown in figure 20(a)), the visible radius r can be estimated based on geometry:

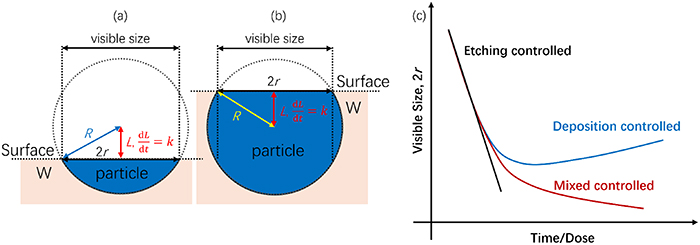
Figure 20. The sketch of particle size evolution in different situations. (a) Surface on the lower hemisphere of particle, (b) surface on the upper hemisphere of particle, (c) visible size evolution.
Download figure:
Standard image High-resolution imagewhere R is the real particle size. However, if the surface is on the upper hemisphere of the particle (as shown in figure 20(b)), the visible size remains unchanged due to the sputter rate of the W matrix being much lower. In the deposition-controlled process, the deposition rate is higher than the etching rate (meaning a negative k). The particle size will grow due to the deposition of W and finally be covered by fuzz. In the mixed-controlled process, the etching rate was lower but still positive, leading to a lower size reduction.
Thus, the size evolution of Y2O3 particles includes three stages: the first stage was etching-controlled, in which the particle size rapidly decreases at a constant rate. The second stage was mixed-controlled, in which the particle size decreased at a gradually decreasing rate caused by the deposition of W atoms. The third stage was deposition-controlled. In this stage, the particle size was increased due to the deposition, and then particles were covered by fuzz at the surface. Interestingly, the third stage was only observed in sequential D/He or He/D plasma exposure. No particle size increase was observed in D or He exposure until the particles were covered by fuzz. This may indicate that the synergistic effect of hydrogen and helium plays an important role.
4.2. The effect of D/He synergistic effect
H and He atoms coexist in the nuclear fusion reaction, and both have a significant impact on microstructure evolution. Recent research has shown that dual implantations of H and He show different effects on the microstructure evolution from single H or He implantations. Especially, the presence of He shows a significant trapping of H [26, 32].
In W matrix, the binding energy between H atom and monovacancy (Vac) is 1.28 eV, and the binding energy between He and monovacancy reached 4.57 eV, indicating that He is more likely to bind to vacancies and form the He-Vac complex. The H solution energy calculated using DFT shows that H solution energy near He-Vac is about 1 eV lower than that in the bulk, suggesting that the He-Vac complex can act as a trap that drives the H to segregate close to it. In addition, Zhou et al reported that no H2 molecule forms inside a He-V complex, even the number of H atoms trapped by the complex is more than that by an He-free vacancy [33]. The reason may be that the additional volume occupied by He atoms disrupts the necessary conditions (the required space and optimal charge density) for the formation of H2 molecules.
On the other hand, the binding energy between H and Hex-Vac complex (x is 1–4) is about 1 eV, which is comparable with H-Vac. The trapping energy per H atom inside a He-Vac complex is lower than that of H far away from the He-Vac complex when the number of captured H atoms is less than 13 [33]. Furthermore, the binding energy between He and HxHey-Vac complex (x and y are 1–3) is 2.7–4.5 eV which is also comparable with He-Vac. This result indicates that the strong inaction between H and He suppressed their diffusion.
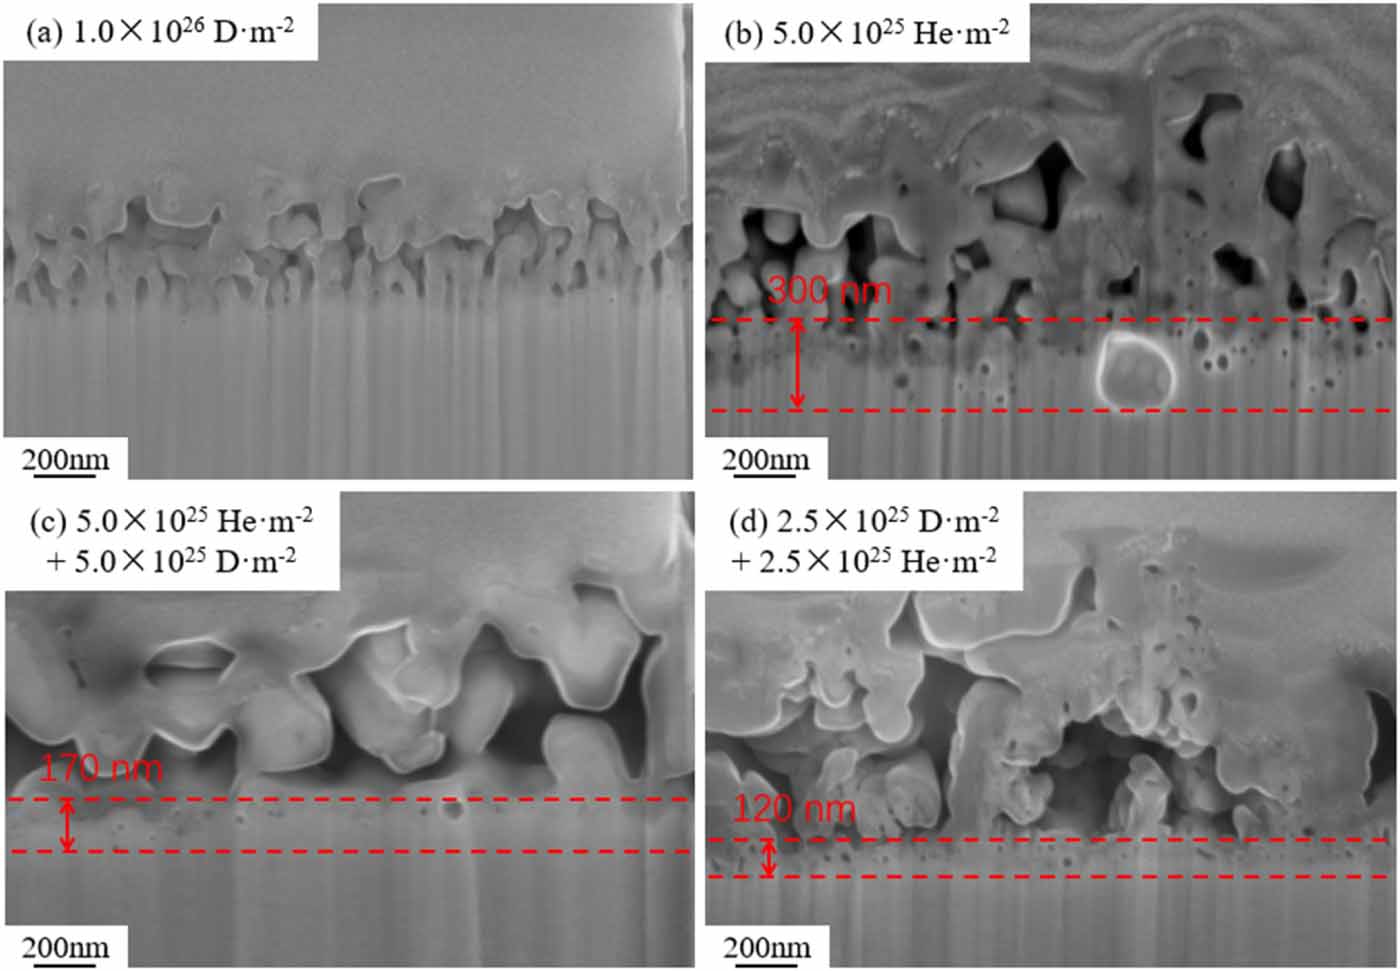
Overall, the synergistic effect of H and He is believed to have two main impacts: (1) higher He-defects binding energy hinder the formation of H2 molecule and suppresses the formation of H bubble. (2) The strong inaction between H and He-defect clusters drives H to segregate close to He. Figure 21 shows the bubbles in the bottom of the fuzz layer with different exposure parameters. As we can see from figure 21(a), no visible bubbles in the bottom of the fuzz layer after D exposure. A bubble layer with a thickness of 300 nm was observed in He exposed sample with a dose of 5.0 × 1025 He m−2, which was thicker than that in He/D (170 nm) or D/He (120 nm) exposed sample. This result confirms the rationality of the above analysis that the synergistic effect of hydrogen and helium suppresses the generation of bubbles.
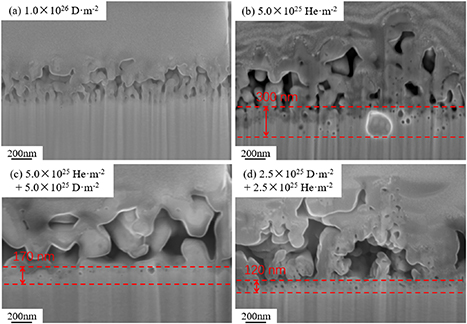
Figure 21. The bubbles in the bottom of the fuzz layer for the samples after exposure to different conditions. (a) 1.0 × 1026 D·m−2, (b) 5.0 × 1025 He·m−2, (c) 5.0 × 1025 He·m−2 + 5.0 × 1025 D·m−2, (d) 2.5 × 1025 D·m−2 + 2.5 × 1025 He·m−2.
Download figure:
Standard image High-resolution imageThis may also be one of the reasons for the different evolutions of particle size. The inhibition of bubble generation reduced the development of fuzz since the formation and growth of bubbles are important mechanisms for the formation of fuzz. At this point, the deposition process described in section 4.1 will become more dominant, resulting in a negative k and the particle evolution becoming deposition-controlled finally. Besides, it was also the reason why a thicker fuzz layer was observed in a single He exposed sample.
5. Conclusion
The present study systematically investigated the synergistic effect of deuterium and helium on the microstructure evolution behavior of W–Y2O3 material during plasma exposure. Based on the results and analysis, the following conclusions can be drawn:
- (1)Y2O3 particles undergo a significant size change during plasma exposure, and this process was significantly influenced by the synergistic effect of hydrogen and helium. The visible size evolution of Y2O3 particles is controlled by three steps: the etching-controlled process at an initial stage, the deposition-controlled process when the sedimentation process becomes dominant, and the mixed controlled process.
- (2)The fuzz structure on the surface of Y2O3 particles is composed of W instead of Y2O3, which is resulting from the deposition during plasma exposure.
- (3)The synergistic effect of deuterium and helium has a significant impact on the microstructure evolution of W–Y2O3 material. The strong interaction between H and He-vacancy composite suppressed the bubble formation and growth, leading to a different evolutionary dynamic.
Acknowledgment
This work was supported by National MCF Energy R&D Program (2022YFE03140000), National Natural Science Foundation of China (12205071 and 12205070) and the Fundamental Research Funds for the Central Universities (JZ2023HGTB0213).