Abstract
The present work is focused on a 3D numerical assessment of the Wendelstein 7-X (W7-X) particle exhaust. For all the numerical simulations the direct simulation Monte Carlo solver of the DIVGAS workflow, has been employed. The complex 3D geometry of the sub-divertor region includes the pumping gap panel, supporting structures, cooling pipes as well as the cryo-vacuum pump. All the considered flow simulations correspond to the Standard magnetic configuration of W7-X. The main conclusions, which can be extracted from the present numerical analysis could be summarized as follows; The coupling between EMC3-EIRENE and DIVGAS, which considers the fact that the incoming neutral particle flux at the sub-divertor is based on realistic plasma background, has been demonstrated. Three plasma scenarios have been considered, for which is clearly seen that by increasing the heating power, the neutral pressure as well as the resulting pumping efficiency is increased. The obtained numerical results of the neutral pressure in the sub-divertor lie within a more general scan matrix, which assumes a wider range of incoming particle flux, namely 1019–1024 (s−1). It has been observed that, the sub-divertor neutral pressure is proportional to the incoming neutral particle flux, with the effective pumping speed to be a constant of proportionality. The influence of switching off the cryo-vacuum pump on the sub-divertor pressure is rather modest and a weak increase of the neutral pressure in the sub-divertor is expected. Correlations of the sub-divertor pressure with the total incoming particle flux as well as the individual pumped flux at each of the AEH and AEP sections have been deduced. Moreover, it has been demonstrated that the influence of the incoming neutral particle flux on the albedo coefficient at the AEH and AEP pumping gaps is rather weak. All the above numerical findings will actively support the optimization of the W7-X particle exhaust, in view of future experimental campaigns.

Original content from this work may be used under the terms of the Creative Commons Attribution 4.0 license. Any further distribution of this work must maintain attribution to the author(s) and the title of the work, journal citation and DOI.
1. Introduction
Studying particle exhaust in stellarator fusion devices is essential for advancing fusion technology. Effective particle exhaust systems, such as divertors, are crucial for maintaining plasma control by removing impurities that can degrade performance. They also manage the intense heat loads generated during fusion, protecting the reactor’s plasma-facing components from damage and ensuring the device’s longevity. Additionally, efficient particle exhaust contributes to the overall energy efficiency of the fusion process by maintaining optimal plasma conditions, which enhances energy output. By controlling plasma density and temperature, these systems help stabilize the plasma, preventing instabilities that could disrupt the fusion process. Ultimately, optimizing particle exhaust mechanisms is vital for the safe, stable, and efficient operation of a stellarator device.
Within the above framework, a recent numerical study focusing on 2D and 3D divertor geometries related to the experimental campaign OP 1.2b was published [1]. In this sensitivity analysis, it was justified that a large fraction of incoming neutral particle flux in the sub-divertor is leaked back to the divertor vicinity and only a small fraction (∼3%–4%) is being pumped out. Moreover, the plasma conditions, which result in higher incoming neutral fluxes to the sub-divertor, facilitate the increase of the pumping efficiency and in parallel the decrease of neutral outflux back to the plasma. Additionally, the obtained numerical results were validated successfully with corresponding experimental data.
Based on the aforementioned study, the present analysis delves into a 3D numerical assessment of the Wendelstein 7-X (W7-X) particle exhaust using the direct simulation Monte Carlo (DSMC) solver [2] within the DIVGAS workflow. To calculate the neutral conditions in the plasma Scrape-off Layer and in the divertor area, the commonly utilized code package is the EIRENE algorithm [3], which features a 3D Monte-Carlo solver for neutral–neutral interactions based on the classical BGK kinetic model [4]. When applied with a velocity-independent collision frequency, as described in [5, 6], the classical BGK model fails to accurately determine the transport coefficients’ ratio, specifically the ratio of thermal conductivity to viscosity. As a result, employing the classical BGK kinetic model yields a Prandtl number of unity for a monoatomic gas, rather than the expected 2/3 [7]. Consequently, the classical BGK kinetic model is typically applied only for isothermal and pressure-driven flows. This limitation of the BGK model highlights the necessity for alternative numerical methods that can more precisely describe non-isothermal conditions, as anticipated in the sub-divertor area. Therefore, the application of the DSMC method is well justified.
The primary objective of this work is to extend numerical simulations from low to high-density plasma scenarios and to develop a database that correlates exhaust neutral parameters, such as the sub-divertor neutral pressure, with upstream plasma parameters, such as the incoming neutral flux through the pumping gap. This approach tends to enhance the integration of plasma behavior with exhaust optimization, considering reactor-relevant operational conditions.
The primary distinction between the previous and current work is the introduction of a 3D divertor geometry, which reflects the operational phase OP 2.x. During this phase, the ‘Low-Iota’ (AEH) and ‘High-Iota’ (AEP) divertor sections are combined into one large volume. The removal process is supported by turbo-molecular pumps (TMPs) and the installed cryo-vacuum pumps. Based on the simulation results, key mechanisms and optimization strategies for the upcoming W7-X experimental campaigns can be developed.
This paper is organized as follows: section 2 presents the particle exhaust system of W7-X, including the vacuum system and a description of the sub-divertor geometry. Section 3 describes the numerical method and the imposed boundary conditions. Section 4 discusses the obtained numerical results. Finally, section 5 provides the conclusions of this study.
2. W7-X vacuum system and sub-divertor geometry
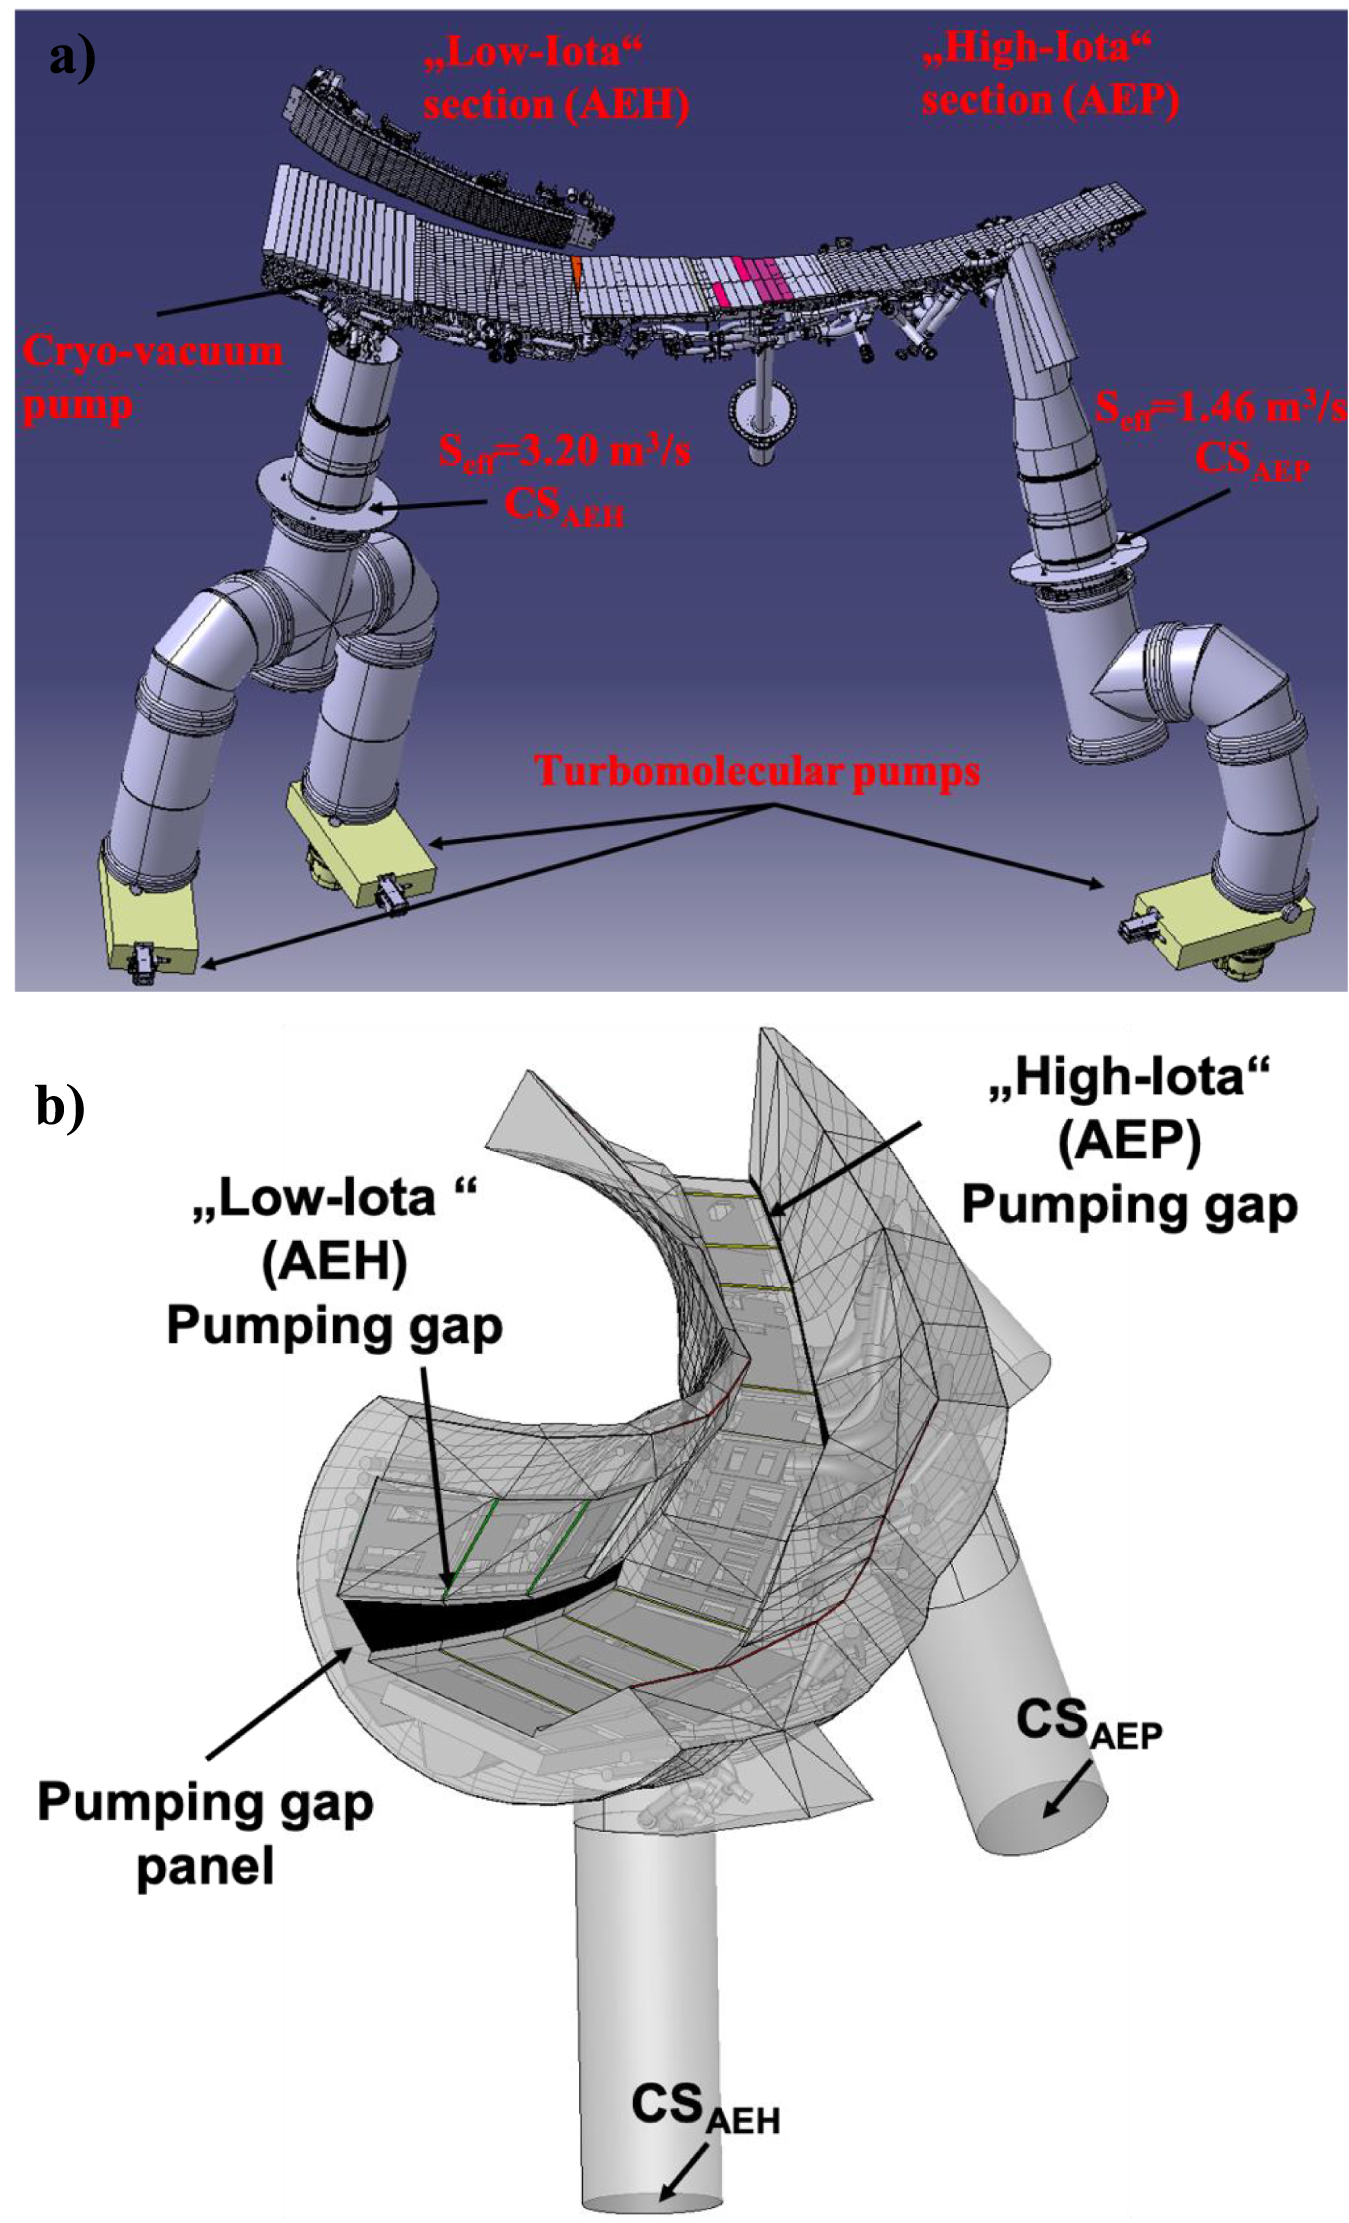
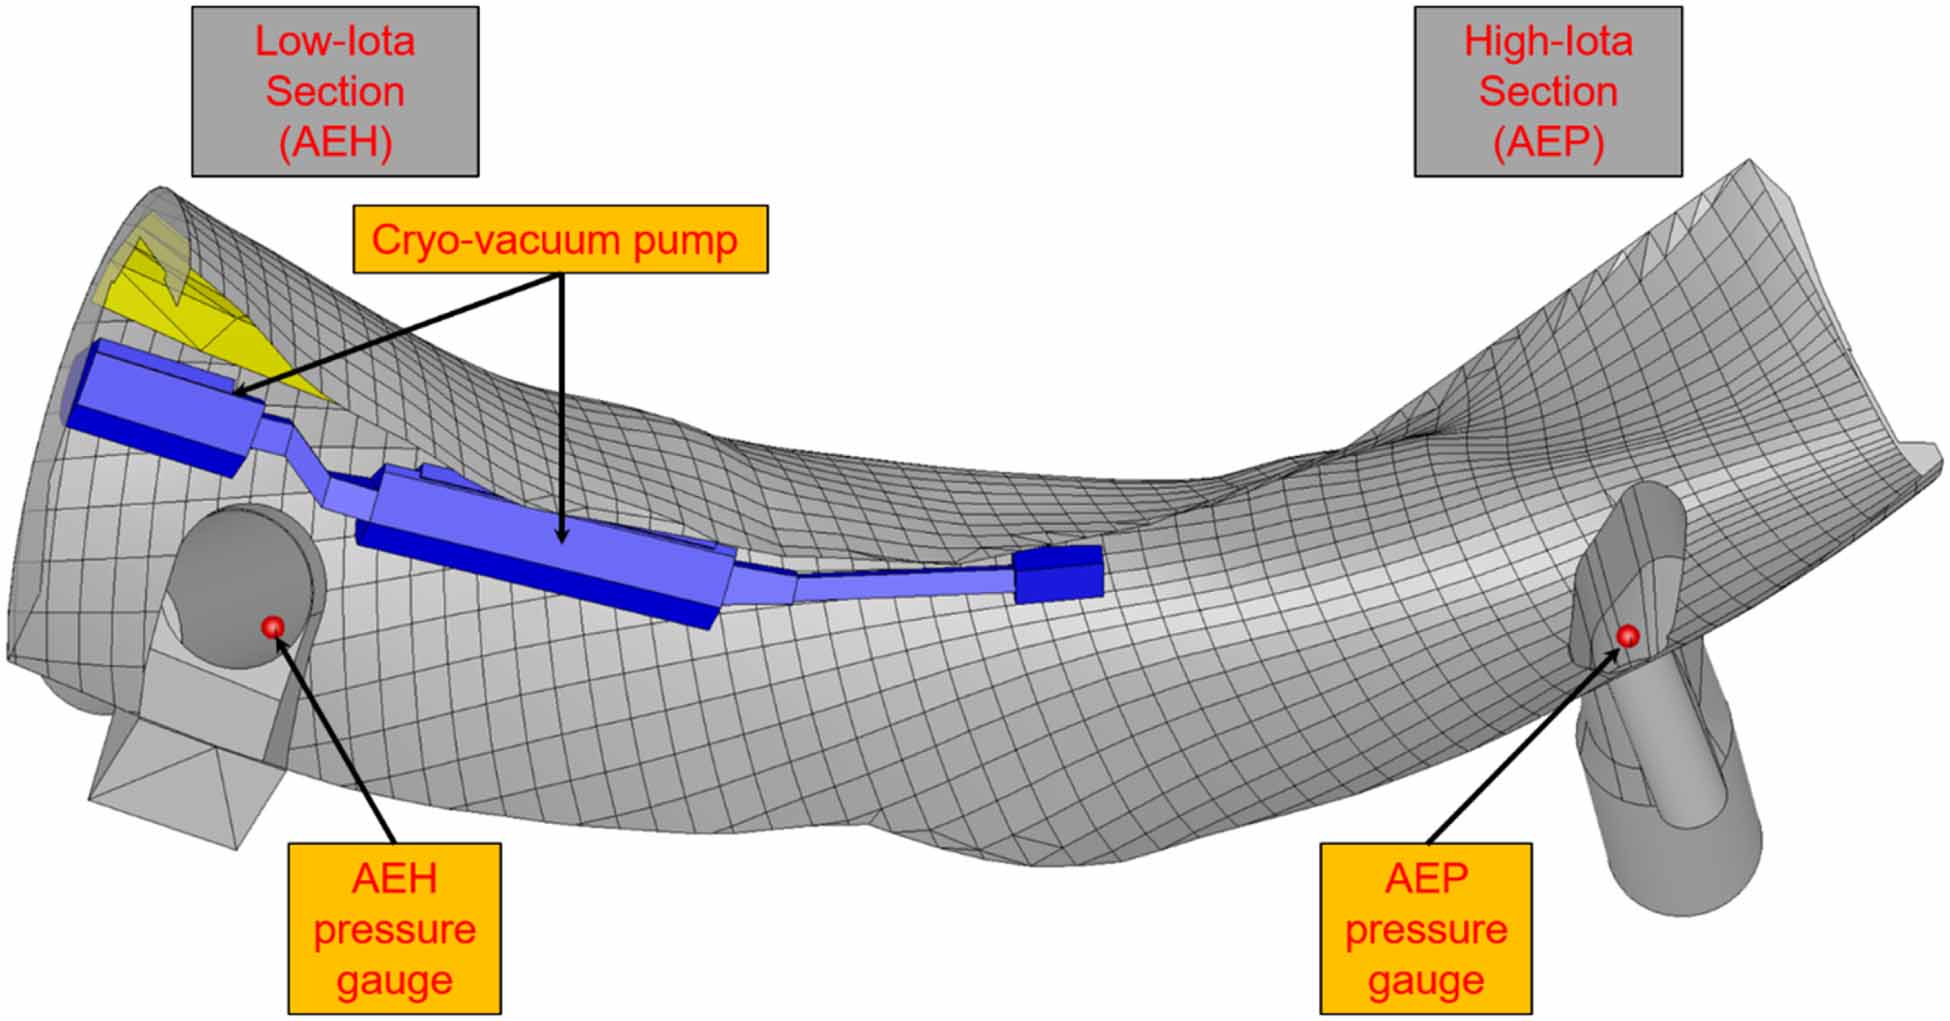
The present study is focused on the 3D numerical simulation of one out of ten divertor units in W7-X. The divertor unit is equipped with three TMPs; Two TMPs are located at the AEH section and one TMP is located at the AEP section (see figure 1(a)). The nominal pumping speed at the inlet of each TMP is equal to 3.73 m3 s−1. The effective pumping speed  at the cross-sections CSAEH and CSAEP (see figure 1(b)), based on Monte Carlo simulations, has been estimated to be 3.20 m3 s−1 and 1.46 m3 s−1 in the AEH and in the AEP section respectively [8]. Based on the assumption of a Maxwellian distribution function for the gas particles at the cross-sections CSAEH and CSAEP as well as free molecular flow conditions, the capture coefficient ξ, which is deduced by using the aforementioned values of the actual effective pumping speed
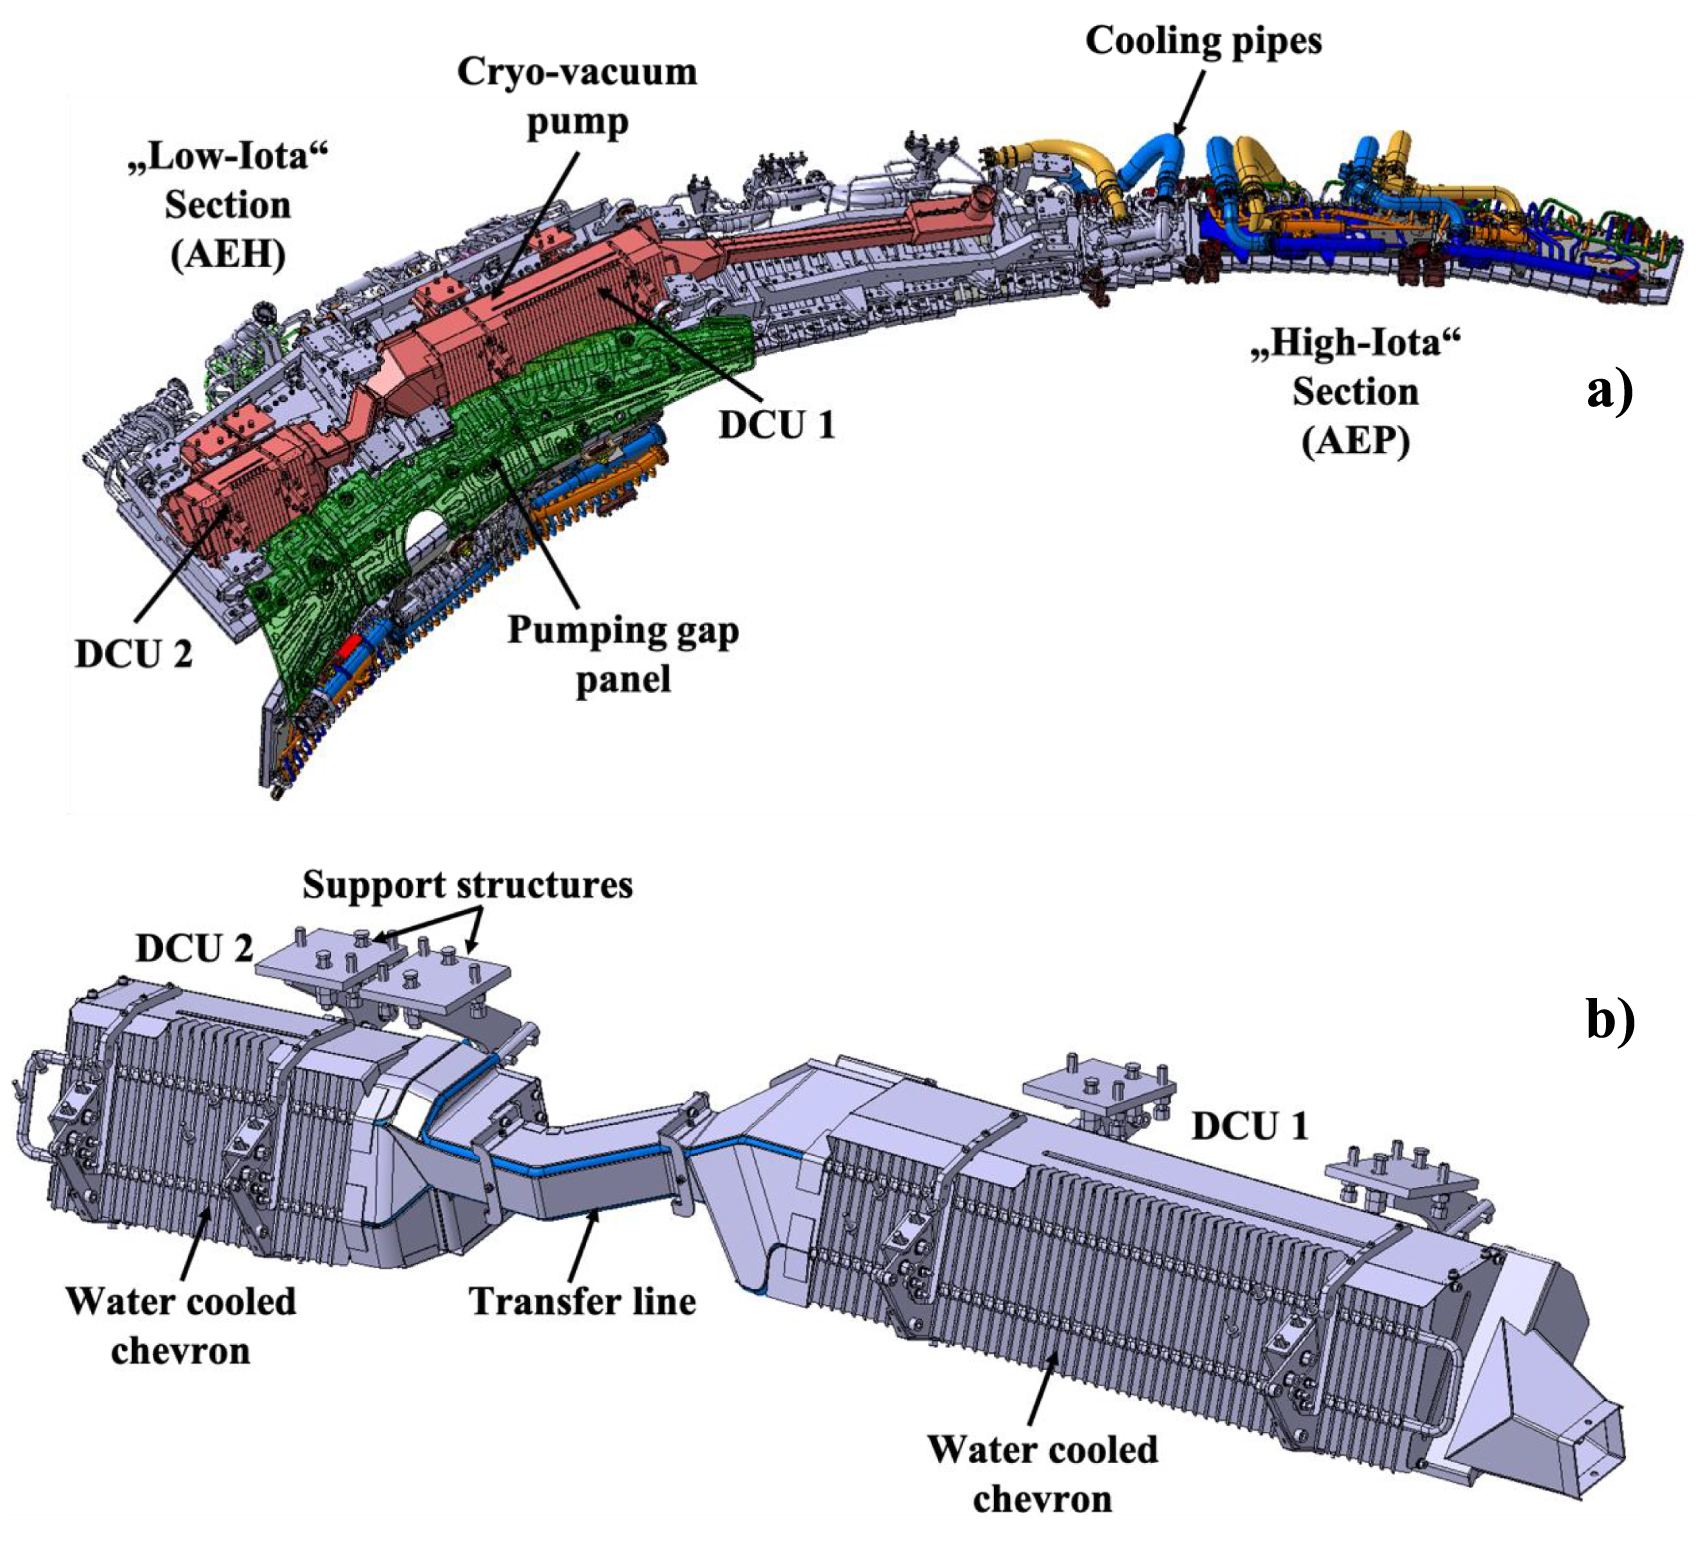
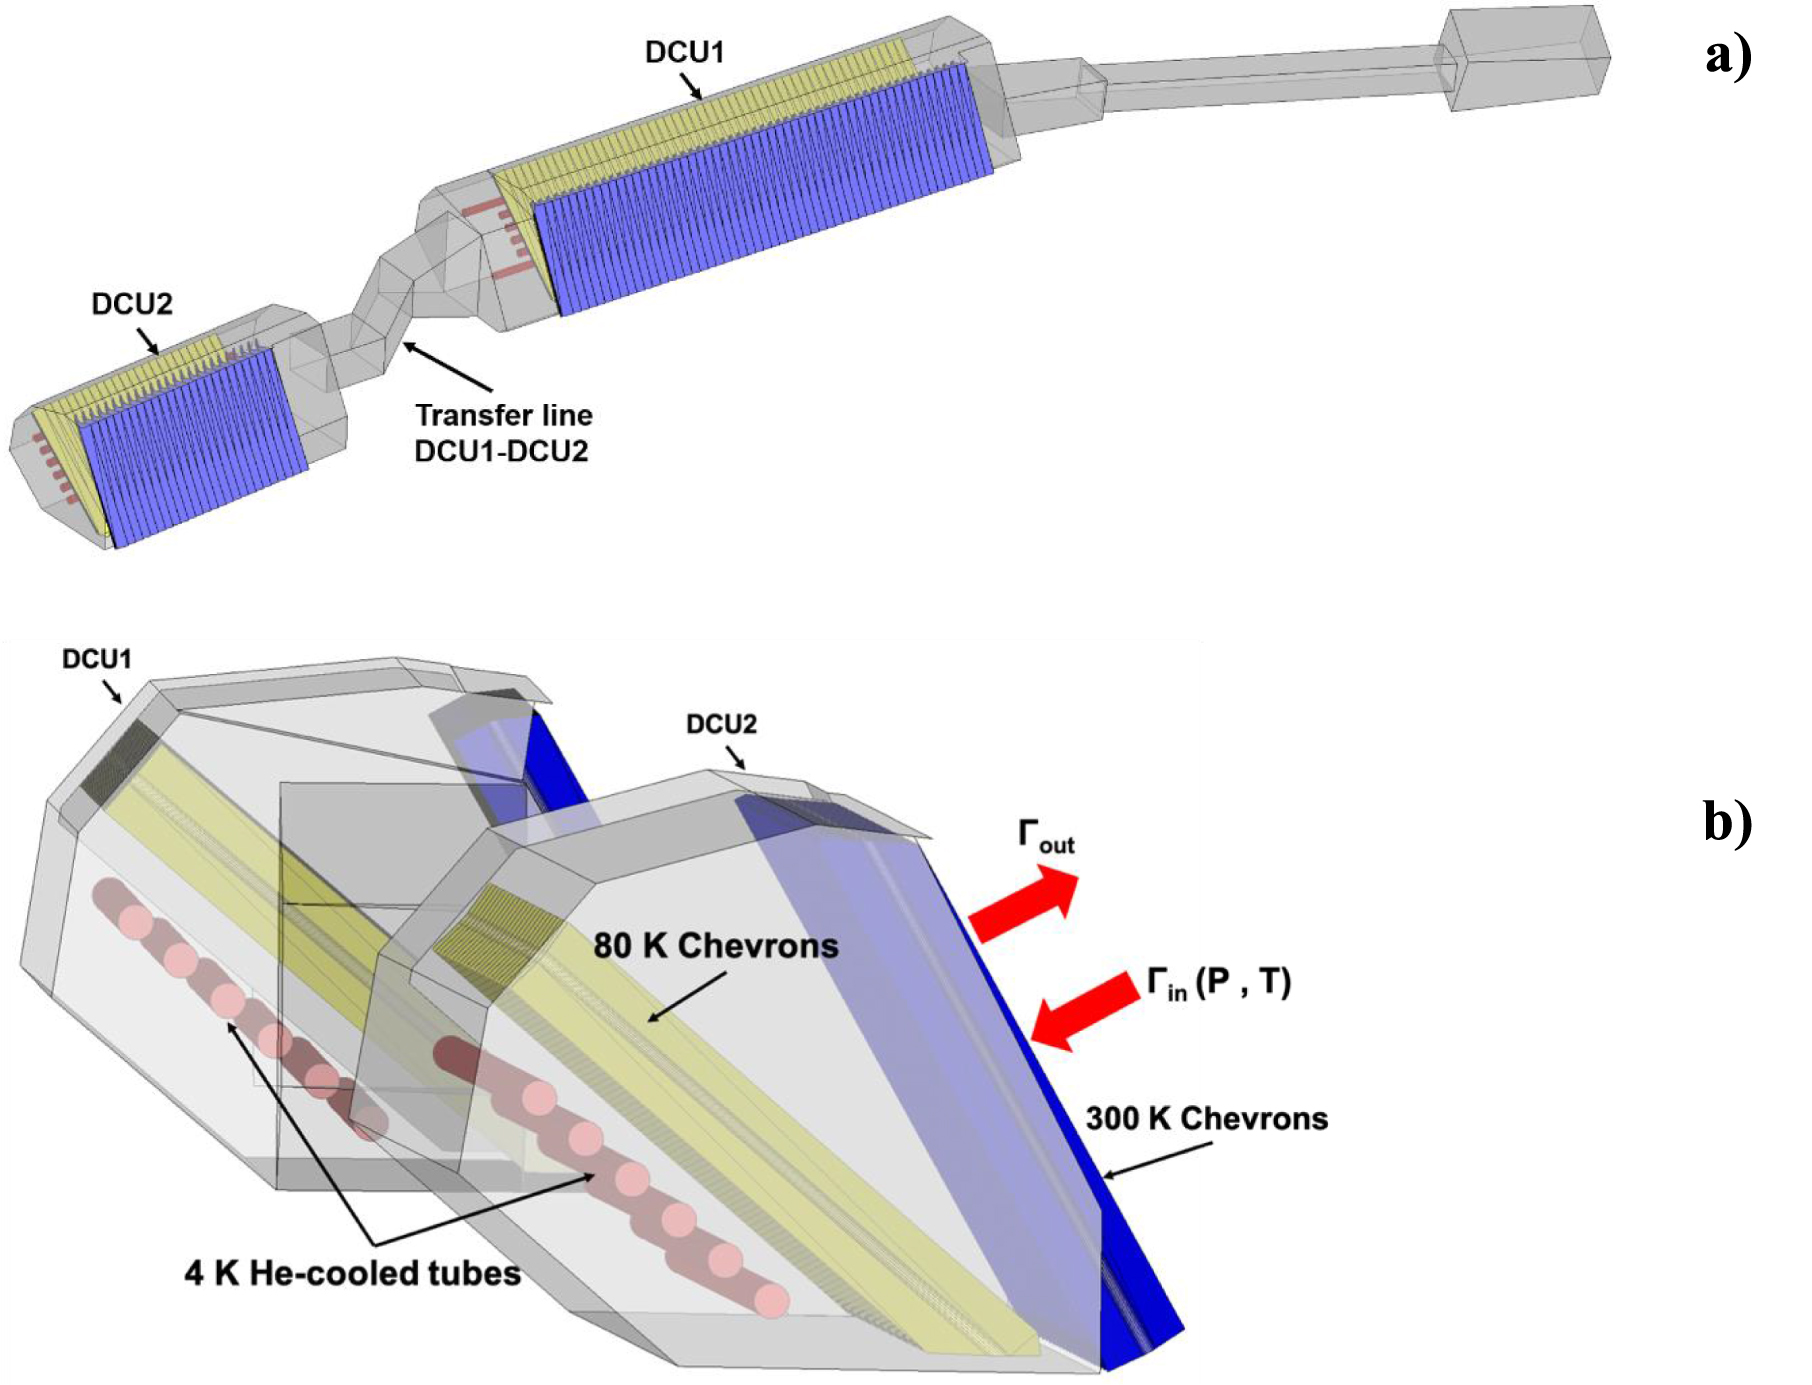
 , equals to ξ = 0.06 for the AEH section and ξ = 0.0264 for the AEP section respectively [1]. Additionally, in each divertor unit an in-vessel cryo-vacuum pump (CVP) has been installed and operated for the first time during the experimental campaign OP 2.1. The CVP is located behind the horizontal divertor target modules of the AEH section (see figure 2(a)) and is divided into two parts i.e DCU1 and DCU2, as shown in figure 2(b). Each, part consist of the He-tubes, the liquid nitrogen cooled chevrons and the water-cooled chevrons. The cooling of each structure is performed by providing supercritical helium at 4 K, liquid nitrogen at 80 K and cooling water at 303 K, respectively. More details about the cryo-vacuum pump and its characteristic are presented in [9].
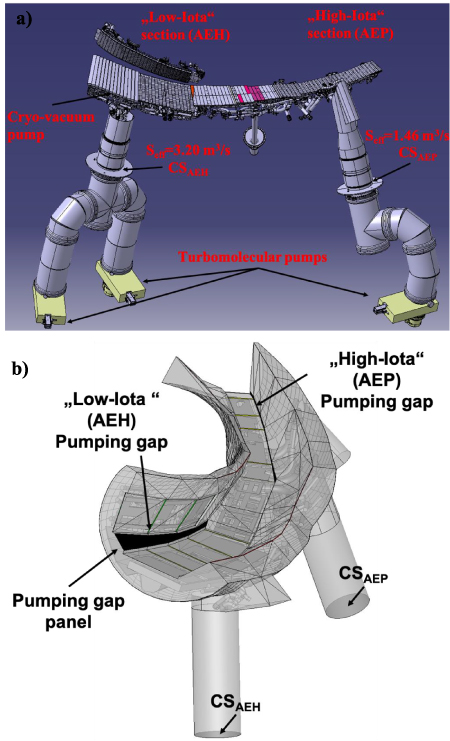
Figure 1. (a) W7-X plasma vessel pumping ports at the AEH and AEP sections in one of the ten divertor units. Reproduced from [1]. © 2024 The Author(s). Published by IOP Publishing Ltd on behalf of the IAEA. CC BY 4.0. (b) The 3D simplified model introduced in DIVGAS, including the pumping gaps, the pumping gap panel, cooling pipes, support structures and the cryo-vacuum pump.
Download figure:
Standard image High-resolution image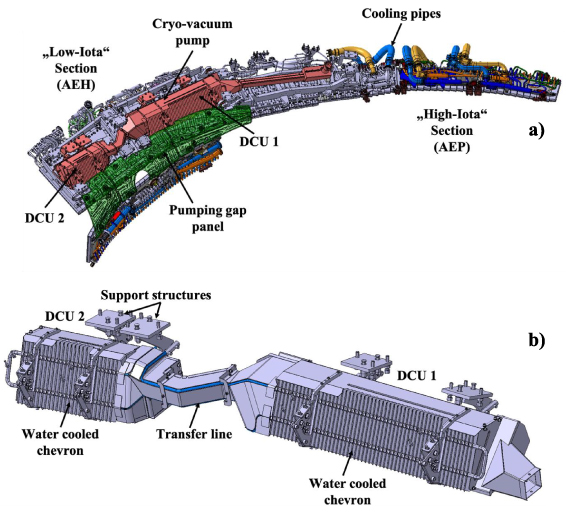
Figure 2. (a) The W7-X cryo-vacuum pump, located at the AEH section, as installed behind the horizontal target modules, (b) actual design of the cryo-vacuum pump.
Download figure:
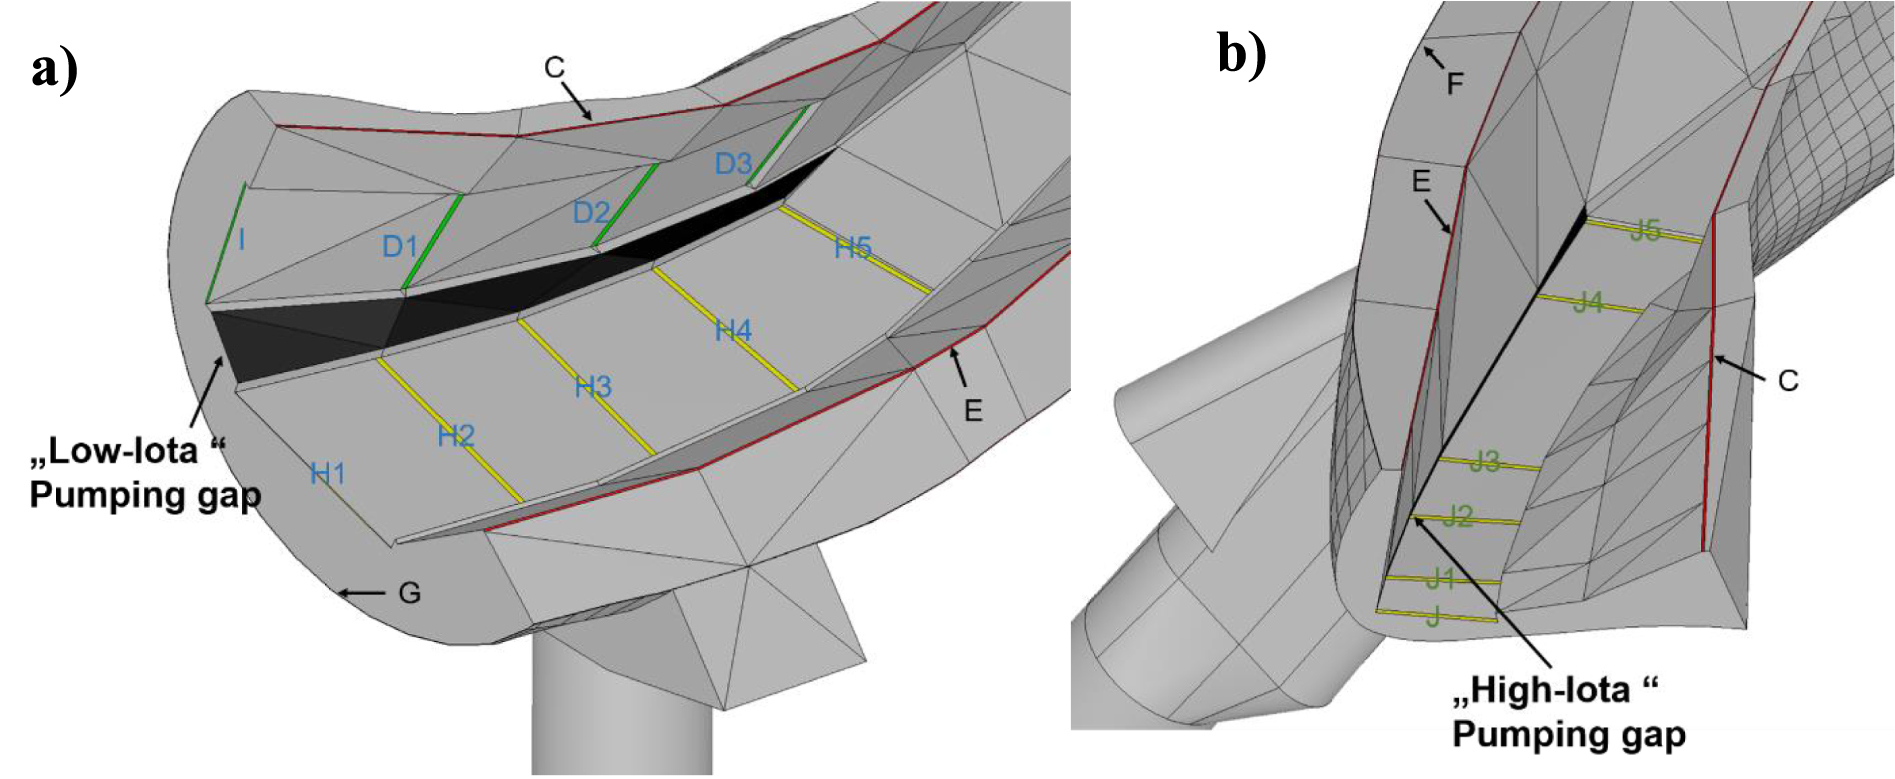
Standard image High-resolution imageThe present detailed 3D divertor geometry has been extracted from corresponding 3D CATIA models. More specifically, the divertor unit includes the divertor baffles and targets, the corresponding supporting structures and cooling pipes, the pumping gap panel found only in the AEH section, the vacuum vessel, the pumping gaps in both AEH and AEP sections, the corresponding pumping surfaces CSAEH and CSAEP as well as the cryo-vacuum pump (see figure 1(b)). Additionally, the toroidal and poloidal leakages between the baffle and target tiles as well as the baffles and the vacuum vessel, through which the neutrals can penetrate the plasma area are considered. In figure 3, the numbering and naming of each toroidal and poloidal leakage considered here, is highlighted. In total, 19 poloidal and toroidal leakages have been identified, while their individual name and area are provided in table 1.
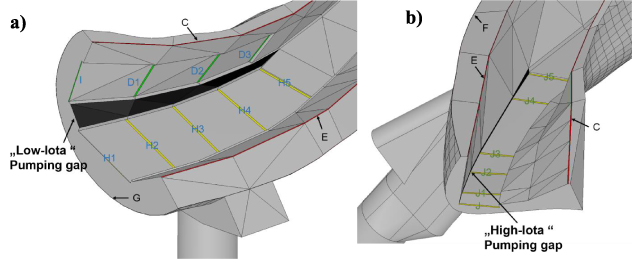
Figure 3. Toroidal and poloidal leakages considered in the 3D model of the W7-X sub-divertor.
Download figure:
Standard image High-resolution imageTable 1. Area of each individual leakage/opening considered in the AEH and AEP sections.
| Leakage/Opening | Area (m2) |
|---|---|
| I | 1.974 × 10−03 |
| D1 | 5.787 × 10−03 |
| D2 | 5.714 × 10−03 |
| D3 | 5.415 × 10−03 |
| H1 | 1.098 × 10−03 |
| H2 | 7.809 × 10−03 |
| H3 | 7.444 × 10−03 |
| H4 | 7.140 × 10−03 |
| H5 | 6.208 × 10−03 |
| C | 2.465 × 10−02 |
| E | 2.339 × 10−02 |
| F | 9.354 × 10−03 |
| G | 3.475 × 10−03 |
| Pumping gap (AEH) | 1.535 × 10−01 |
| CSAEH | 1.243 × 10−01 |
| J | 3.022 × 10−03 |
| J1 | 3.832 × 10−03 |
| J2 | 4.114 × 10−03 |
| J3 | 3.577 × 10−03 |
| J4 | 3.387 × 10−03 |
| J5 | 4.776 × 10−03 |
| Pumping gap (AEP) | 4.504 × 10−02 |
| CSAEP | 1.243 × 10−01 |
3. Numerical model of W7-X sub-divertor and boundary conditions
In the present study, the DSMC solver of the DIVGAS workflow has been employed. The DSMC method, is the most well-known and commonly applied numerical algorithm, capable of reproducing the solution of the Boltzmann Equation. Here, the detailed description of the DSMC method is omitted, but the reader may consult the following publications [10–18] for further details. The used molecular and atomic diameter for hydrogen equals to  =2.92 × 10⁻¹⁰ m and
 = 5.0 × 10⁻¹¹ m respectively.
For the modeling of the intermolecular collisions, the no-time-counter scheme supplemented by the hard sphere intermolecular potential model [2] have been applied. An optimum value of time step Δt= 0.1 μs, has been implemented, while the average number of model particles in each simulation, ranges between 1–3 × 10⁸. Those numbers assure that the statistical scattering of macroscopic quantities along the computational domain is less than 5%. In order to achieve the aforementioned convergence criterion, a time averaging of macroscopic quantities over 6–9 × 10⁶ time steps has been performed. The number of grid cells equals to ∼2 × 10⁷. The applied grid was chosen such that the cell size is smaller than the one third of the local mean free path, as proposed in [2]. This work has been performed on MARCONI HPC as well as on the NERSC HPC and each run exploits 6144 CPUs. The typical time for reaching steady state conditions is 48–72 h. For all simulated cases, the particle balance of the total incoming and outgoing particles in the flow domain is fully satisfied. In general, the particle balance in the sub-divertor area consists of the incoming neutral flux to the sub-divertor from the plasma side  , the pumped flux
 , the neutral flux through the pumping gap directed towards the plasma side
 , as well as the flux through the individual toroidal and poloidal leakages directed towards the plasma side Γleakage,i. with i the corresponding number of the leakage.
The imposed boundary conditions assume that molecular or atomic hydrogen enters the sub-divertor area through both AEH and AEP pumping gaps with a given particle flux  , which is proportional of the number density n0 of either atoms or molecules and the corresponding square root of the temperature T0. The particle fluxes
 ,
 and
 are estimated as an outcome of the simulation. In the present work, the incoming flux
 consists of an open input parameter and two main flow cases have been considered; (a) the incoming neutral flux
 of molecular hydrogen is uniformly distributed on both AEH and AEP pumping gaps and ranges between 1019 to 1024 (s−1), mimicking low to high plasma density scenarios. The corresponding molecular hydrogen number density n0 for the AEH (with area A= 0.1535 m2) and AEP (with area A = 0.045 m2) pumping gaps, varies between 1.04 × 10¹⁷−1.04 × 10²² m−3 and 3.53 × 10¹⁷–3.53 × 10²² m−3 respectively, while T0 = 600 K, (b) the incoming neutral flux
 of atomic and molecular hydrogen (H2 and H) varies along each pumping gap and it has been extracted from corresponding EMC3-EIRENE plasma simulations. Here, it is worth noted that the present EMC3-EIRENE simulations do not consider the effect of poloidal and toroidal leakages. In order to consider this inconsistency between the two models, an iterative process, in which the information about neutral fluxes through toroidal/poloidal leakages as well as neutral outflux from the DIVGAS simulations is imposed to EMC3-EIRENE simulations as neutral sources, then updated boundary conditions for DIVGAS are estimated by EMC3-EIRENE and new DIVGAS simulations are performed with updated incoming boundary conditions. This iterative map is terminated when a convergence criterion is satisfied. Such an iterative map usually needs few iterations to converge and it has been demonstrated in the case of JET sub-divertor [11]. Considering the high computational effort, such an iterative process is not within the scope of this work. Moreover, this analysis performs a wide parametric scan of incoming neutral flux to the sub-divertor, which includes as well the case which considers the above dynamic interaction between both numerical codes.
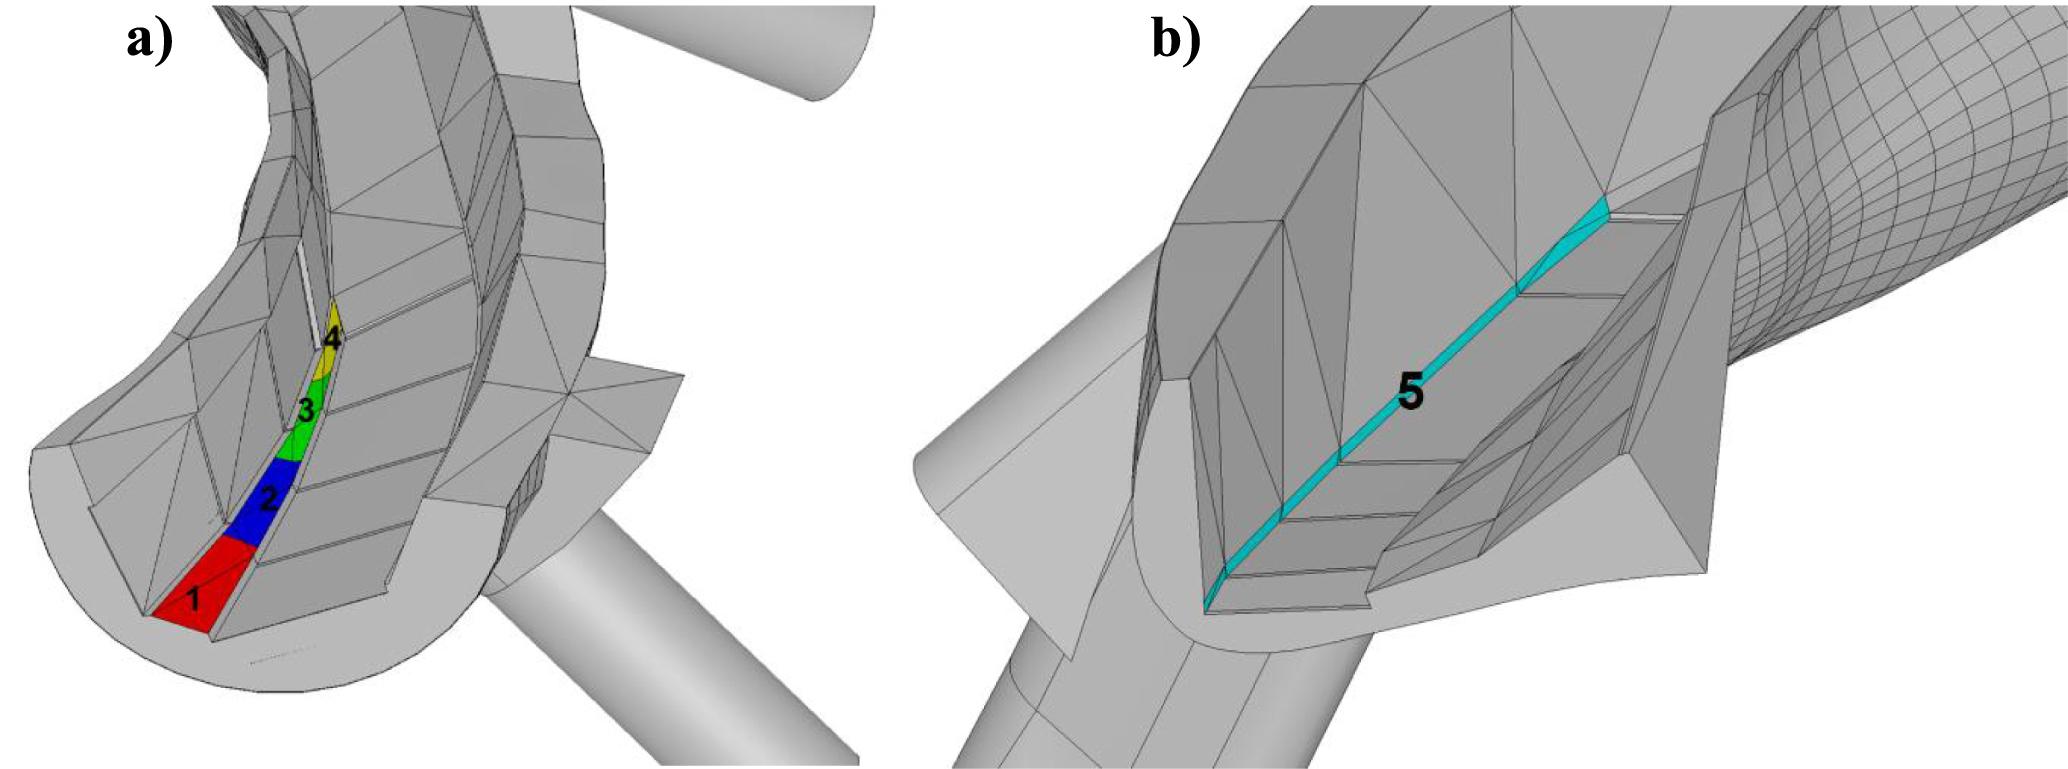
The AEH pumping gap is divided into 4 sections (each section corresponds to 5 degrees angle in the toroidal direction, according to the reference coordination system). In figure 4(a), the four sections as well as the corresponding numbering (i.e. #1 to #4) at the AEH pumping gap are presented. Moreover, the AEP pumping gap is considered as one individual section and is the section #5 in the present study (see figure 4(b)).
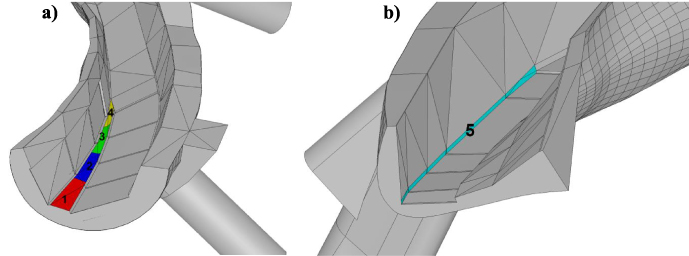
Figure 4. (a) The four sections and the corresponding numbering at the AEH pumping gap, (b) the pumping gap at the AEP section and the corresponding numbering.
Download figure:
Standard image High-resolution imageThree Standard magnetic configuration plasma scenarios have been considered with increasing heating power Pin and line integrated plasma density ne,l.i. The three scenarios as well as the corresponding plasma discharges, are presented in table 2. More details on these plasma simulations are provided in [19]. It is noted that the contribution of molecules to the overall neutral pressures examined in [19] is minimal. However, to investigate molecular temperatures and densities in greater detail, the set of neutral reactions included in the EMC3-EIRENE setup needs to be expanded, as has been done in the present study.
Table 2. The three considered plasma scenarios as well as the corresponding plasma discharges, on which these scenarios were based.
| Plasma Scenario | Plasma Discharge | Pin (MW) | ne,l.i (m−2) |
|---|---|---|---|
| A | 20 180 814.009 | 3 | 7.0x10¹⁹ |
| B | 20 180 814.009 | 3 | 1020 |
| C | 20 180 814.025 | 5 | 1020 |
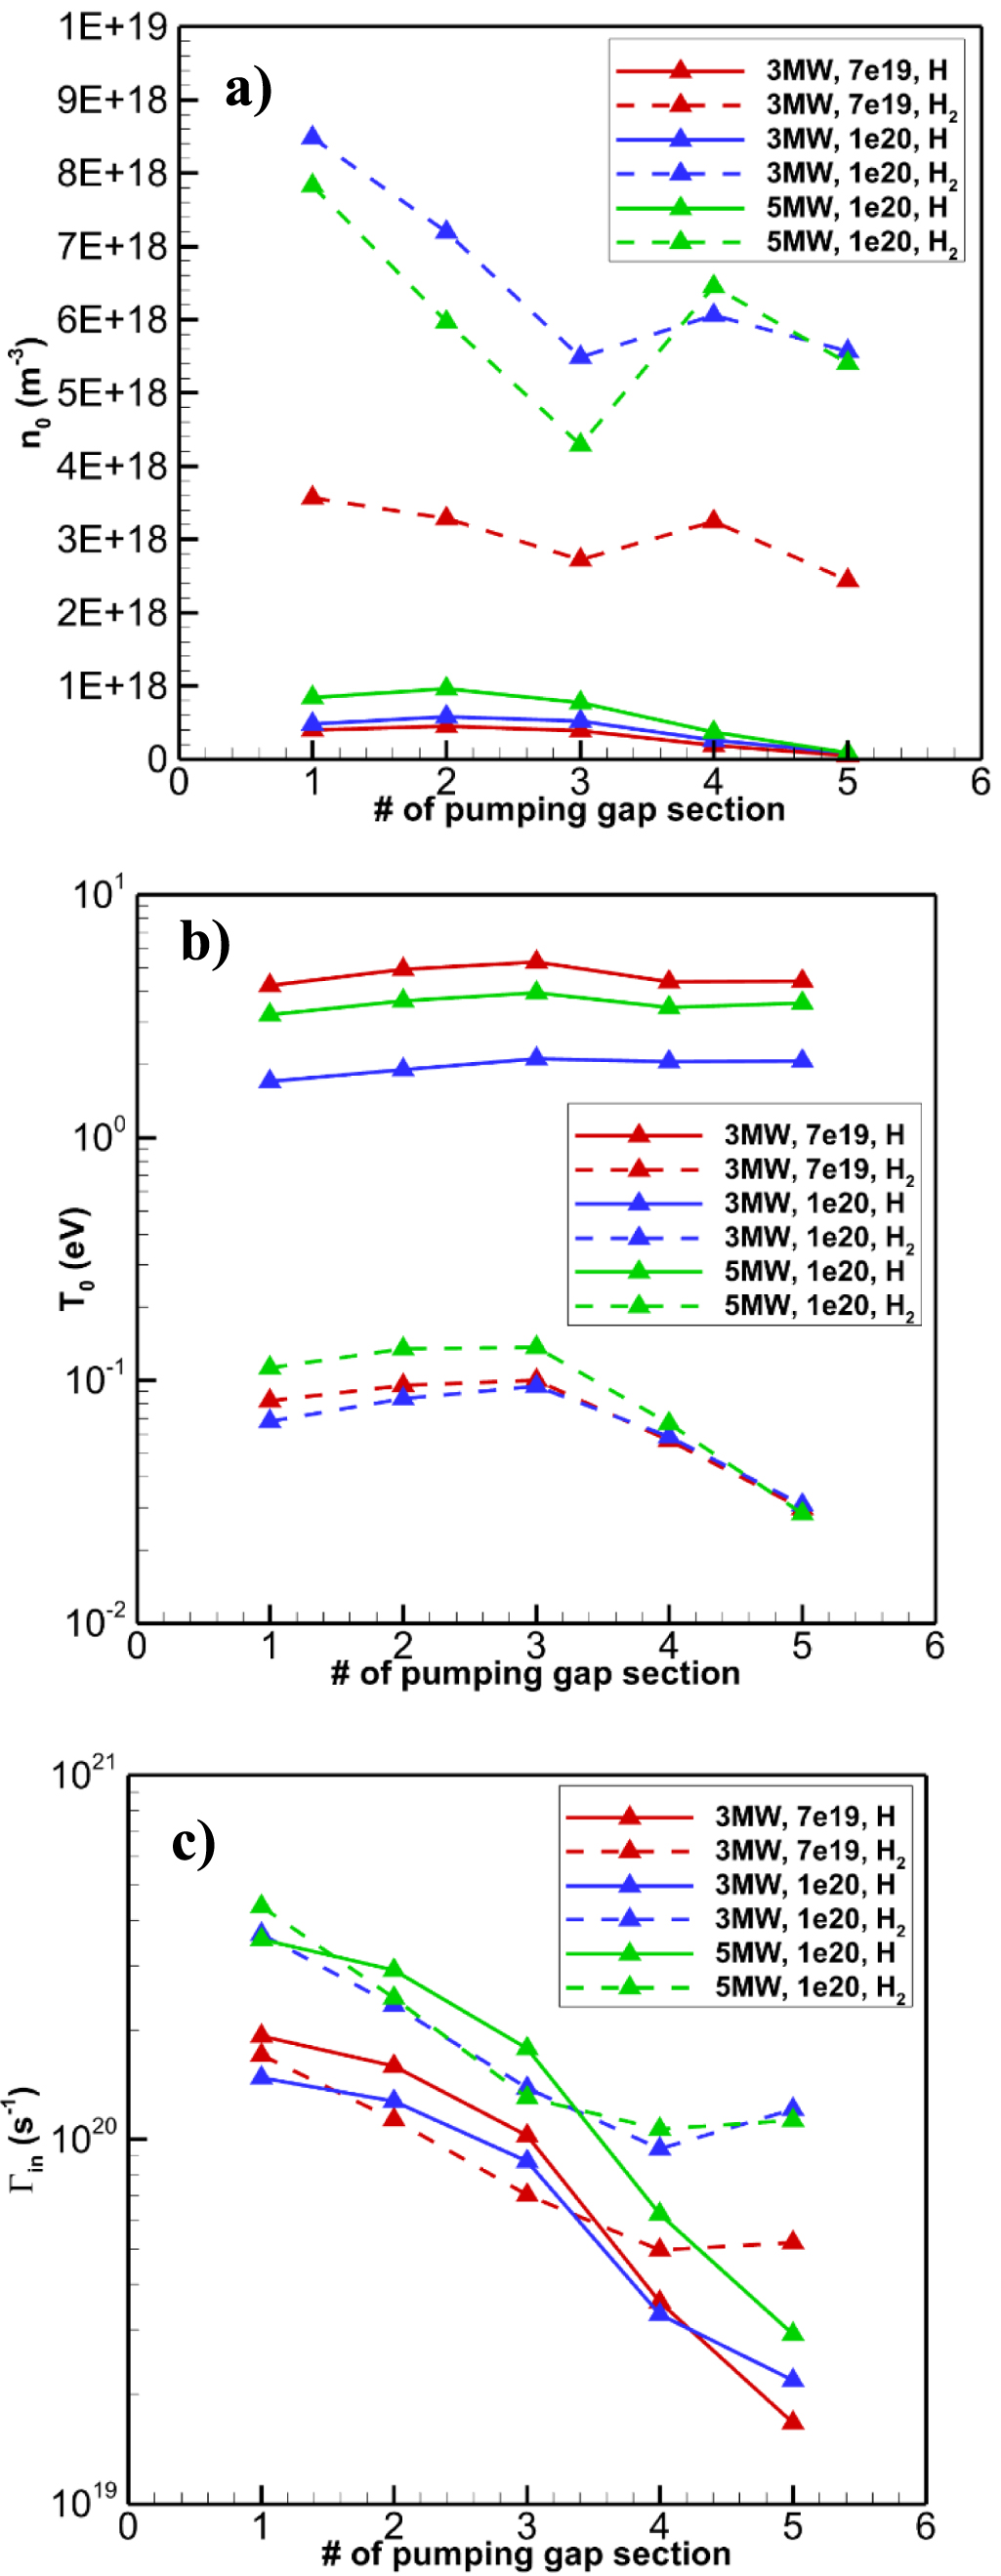
The neutral number density n0 and temperature T0 from the EMC3-EIRENE simulations, as well as the resulted incoming neutral flux  for the atomic and molecular hydrogen, are presented in figures 5(a)–(c) respectively. It is justified, that in the case of a Standard magnetic configuration, the total flux (sum of H2 and H) entering the sub-divertor area from the AEH pumping gap is always an order of magnitude higher than the one entering the AEP section. Moreover, it is seen that moving along the toroidal direction, from the ‘Low-Iota’ to the ‘High-Iota’ section, the flux of neutral particles entering the sub-divertor is not uniform and decreases (see figure 5(c)). Furthermore, it is observed that Scenario A has the lowest molecular hydrogen incoming flux compared to Scenarios B and C, which have similar molecular hydrogen incoming fluxes. On the other hand, Scenario B has the lowest atomic hydrogen incoming flux compared to Scenarios A and C. Additionally, by estimating the total incoming particle flux (i.e sum of H2 and H), it is deduced that the highest value corresponds to Scenario C compared to the ones estimated for the Scenarios A and B.
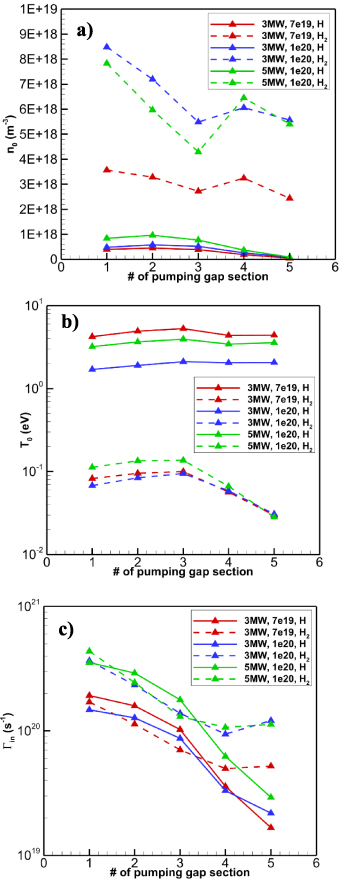
Figure 5. (a) Number density, (b) temperature and (c) particle flux of the incoming atomic and molecular hydrogen as provided by the EMC3-EIRENE simulations at the defined pumping gap sections as defined in figure 4.
Download figure:
Standard image High-resolution imageIt is noted that in the present work the ionization, dissociation and recombination processes in the gas phase have been neglected, as they do not contribute to the gas dynamics in the modeled sub-divertor region. Within the gas-surface interaction process, molecular hydrogen when hitting a surface are re-emitted from it following a Maxwellian distribution function, based on the surface temperature (i.e. full thermalization). For atomic hydrogen, surface recombination is assumed, namely when a hydrogen atom hits a stainless-steel surface, it recombines to a hydrogen molecule with an average probability of 0.8 [20], while with probability equal to 0.2 is reemitted, following a Maxwellian distribution function. The influence of the recombination probability on the sub-divertor total pressure is negligible, since by reducing the probability from 0.8 to 0.4 the total pressure (sum of H2 and H) in the sub-divertor remains unchanged and within 1%. The temperature of the back side of the divertor targets and baffles equals to TTargets = 400 K, while for the vacuum vessel the temperature is kept constant and equal to TVV = 303 K. Finally, it is assumed that the particles leaving the sub-divertor volume through the leakages and openings, undergo immediate ionization and are deleted from the computational domain.
4. Results and discussion
The detailed numerical results from the DIVGAS simulations are presented and thoroughly discussed. This includes the modeling of the cryo-vacuum pump and the estimation of the capture coefficient across a wide pressure range. Using the previously estimated CVP capture coefficient, we present the numerical modeling of the W7-X sub-divertor under a Standard magnetic plasma configuration and various plasma scenarios. We provide correlations linking the incoming neutral particle flux and the pumped flux to the sub-divertor pressure. Additionally, we quantitatively analyze the impact of switching off the CVP on sub-divertor pressures. Finally, we estimate the overall albedo coefficient at the pumping gaps for the plasma scenarios considered. The definition of the albedo coefficient is provided in section 4.4. This dataset will facilitate faster plasma simulations, serving as an input parameter and replacing completely the sub-divertor area.
4.1. Estimation of the capture coefficient for the cryo-vacuum pump
Given the high computational demand of modeling the entire neutral gas flow in the W7-X sub-divertor and the CVP, it was decided to separate these two modeling tasks. The models were then linked by independently estimating the cryo-vacuum pump’s overall capture coefficient, based on the neutral pressure in the sub-divertor. This estimated coefficient is subsequently used as an input for modeling the neutral gas dynamics in the sub-divertor. This numerical technique has been applied successfully in the past for modeling an ITER type cryo-vacuum pump [21, 22].
The numerical simulation of the installed CVP, has been conducted, using the DSMC method. The actual design of the cryo-vacuum pump, is shown in figure 2(b), while the simplified model, which considers all the internal structures, namely the 300 K and the 80 K chevrons as well as the 4 K tubes, on which the gas is adsorbed, is shown in figures 6(a) and (b).
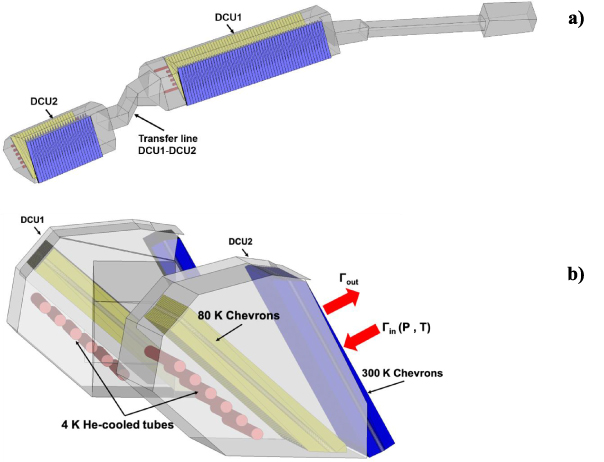
Figure 6. (a) The two modules of the cryo-vacuum pump, (b) a perspective view of the 4 K tubes, the 80 K and the 300 K chevrons.
Download figure:
Standard image High-resolution imageIn the considered 3D model, both CVP modules are subject to the same incoming pressure and temperature. The incoming gas temperature has been kept constant and equal to 300 K, which is relevant to the expected sub-divertor flow conditions. Moreover, the sticking coefficient of molecular hydrogen on the 4 K tubes is assumed equal to unity. Furthermore, the gas, which enters the CVP is able to flow through the connecting ducts from one module to the other. Finally, the area of the surface, through which the gas enters or leaves each of the CVP modules is 0.09 and 0.18 m2 (1:2) respectively.
Based on the simulation results, the overall capture coefficient of the cryo-vacuum pump has been estimated for the case of molecular hydrogen. The capture coefficient of the CVP is defined as  , where
 and
 are the outcoming and incoming neutral fluxes respectively, while
 is the pumped flux on the 4 K tubes. The incoming flow conditions cover a wide range of the neutral gas pressure in front of the pump, varying from 10−5 Pa to 100 Pa, thus covering the whole range of gas collisionality. It is noted that part of the aforementioned pressure range, namely 10−3 Pa to 0.1 Pa, represents the related flow conditions, within the OP2.x experimental campaigns at W7-X. Here, only crucial DSMC simulation parameters are mentioned. In brief, in all the CVP simulations an optimum value of time step Δt = 0.1 μs has been applied. The average number of particles in each CVP simulation is about ∼108, while the number of grid cells is ∼107. These numbers assure that the statistical scattering of macroscopic quantities along the CVP computational domain is sufficiently low (∼2%–3%). It is noted that each 3D CVP simulation last about 24 h to reach full convergence using 1536 CPUs of the MARCONI HPC.
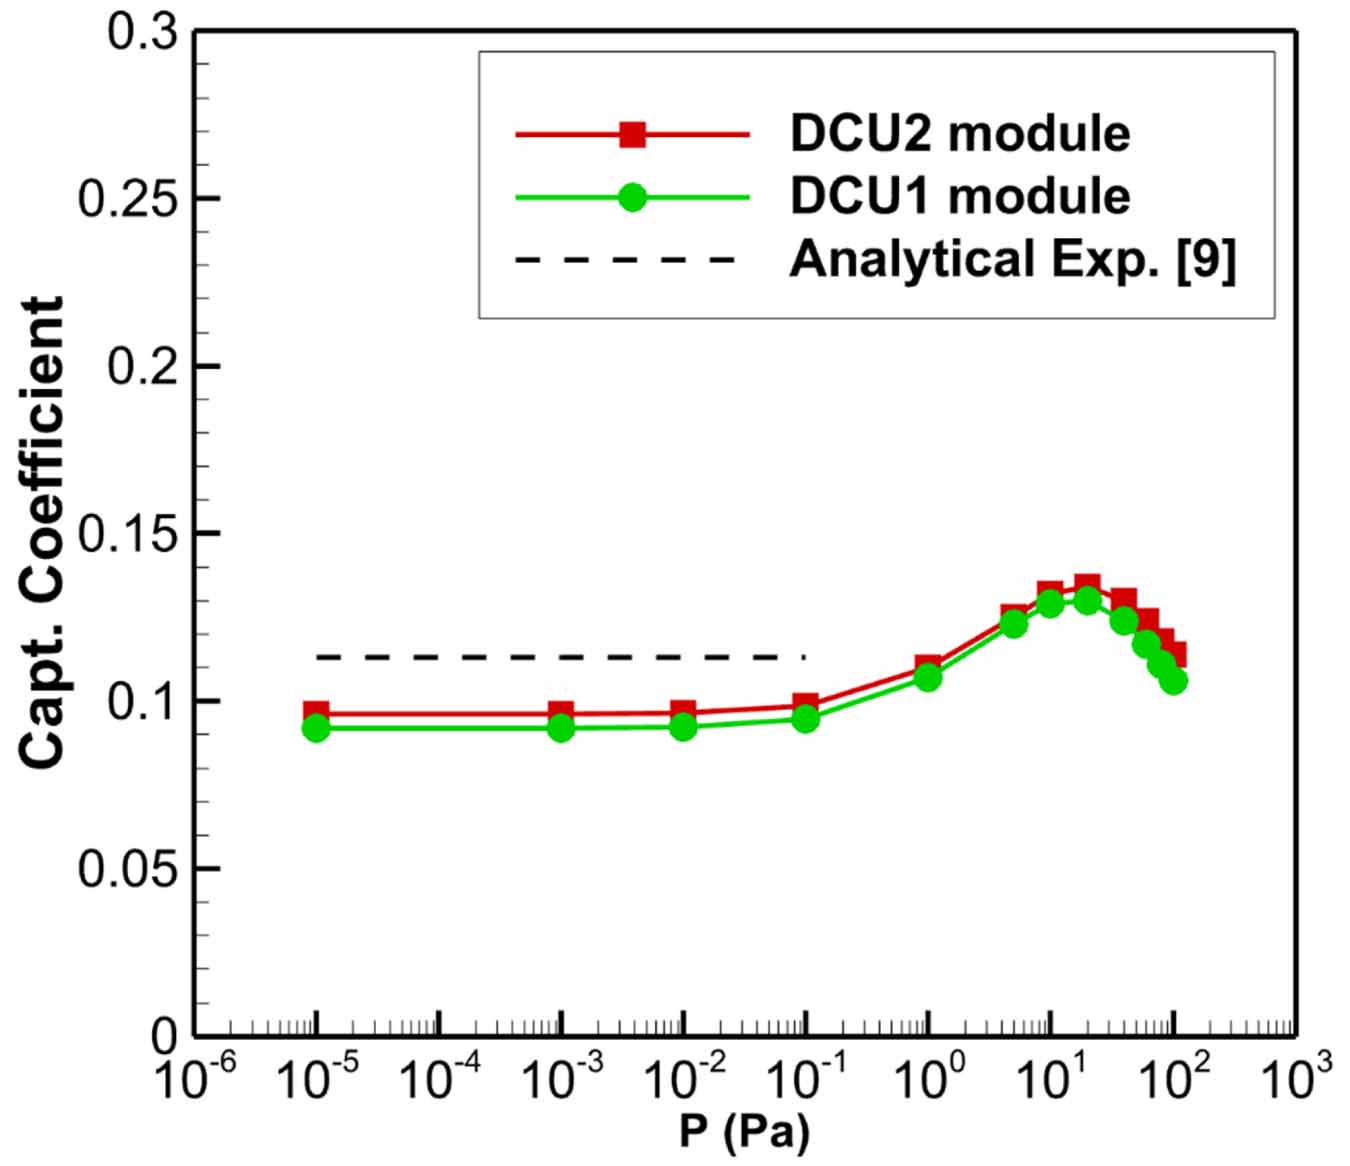
The results of the estimated capture coefficient in terms of the inlet neutral pressure, for each of the CVP modules, are presented in figure 7. It is shown that the capture coefficient, is almost the same for both CVP modules, with maximum relative deviation of ∼3%. Consequently, an average value of the capture coefficient for the complete CVP has been used. It is clearly observed that in the low-pressure range, namely 10−5–0.1 Pa, the capture coefficient remains constant and is directly linked with the free molecular flow conditions expected in this range. A comparison between the values of the capture coefficient based on the present numerical results and on the analytical expression provided in [9], has been performed.
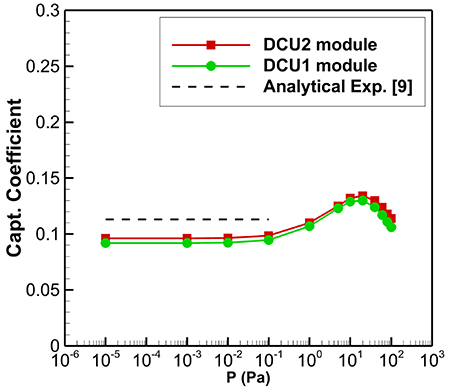
Figure 7. Capture coefficient of each CVP module in terms of gas pressure assuming sticking coefficient of molecular hydrogen on the 4 K tubes equal to unity.
Download figure:
Standard image High-resolution imageFor completeness purposes, it is reminded that in equation (2) of [9]. namely
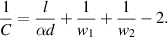
 is the capture coefficient, d= 12 mm is the diameter of the helium pipes, l = 21 mm is the distance between the centers of two adjacent helium pipes, w1 and w2 are the transmission probabilities of the particles passing through the water-cooled and LN2-cooled chevrons, which are taken as 0.22 according to Monte-Carlo simulations presented in figure 2.9 of [23, p 25] [24], (for Φ = 45° and A/B = 2). Moreover, the parameter α in the above equation is the sticking probability of the hydrogen molecules on the cryo-tubes and within the present study equals to unity. The value of the capture coefficient, based on the equation (2) and applying the above geometrical parameters, equals to
 , while the relative difference with the DIVGAS simulated values in the free molecular flow regime, equals to ∼16%. The benchmarking of the DIVGAS simulations using simple analytical expressions is deemed quite acceptable, given the geometric simplifications outlined in equation (2) of [9]. As the pressure in front of the cryo-vacuum pump increases, the capture coefficient also rises, reaching a peak at approximately 10 Pa. Quantitatively, when moving from P = 10−5 Pa (with an estimated mean free path of λ = ∼100 m) to P = 10 Pa (with an estimated mean free path of λ = ∼0.001 m), the relative difference in the capture coefficient is around 27%. At higher neutral pressures, the capture coefficient of the CVP decreases. This behavior is due to the fact that as the inlet pressure increases, both
 and
 increase at different rates. Specifically,
 increases more rapidly with pressure compared to
 , which leads to a decrease in the capture coefficient. Physically, this can be explained by the occurrence of choked-flow conditions at the pump inlet, as described in p 45 of [23].
4.2. Correlations of the incoming particle flux and the pumped flux in terms of the sub-divertor neutral pressure
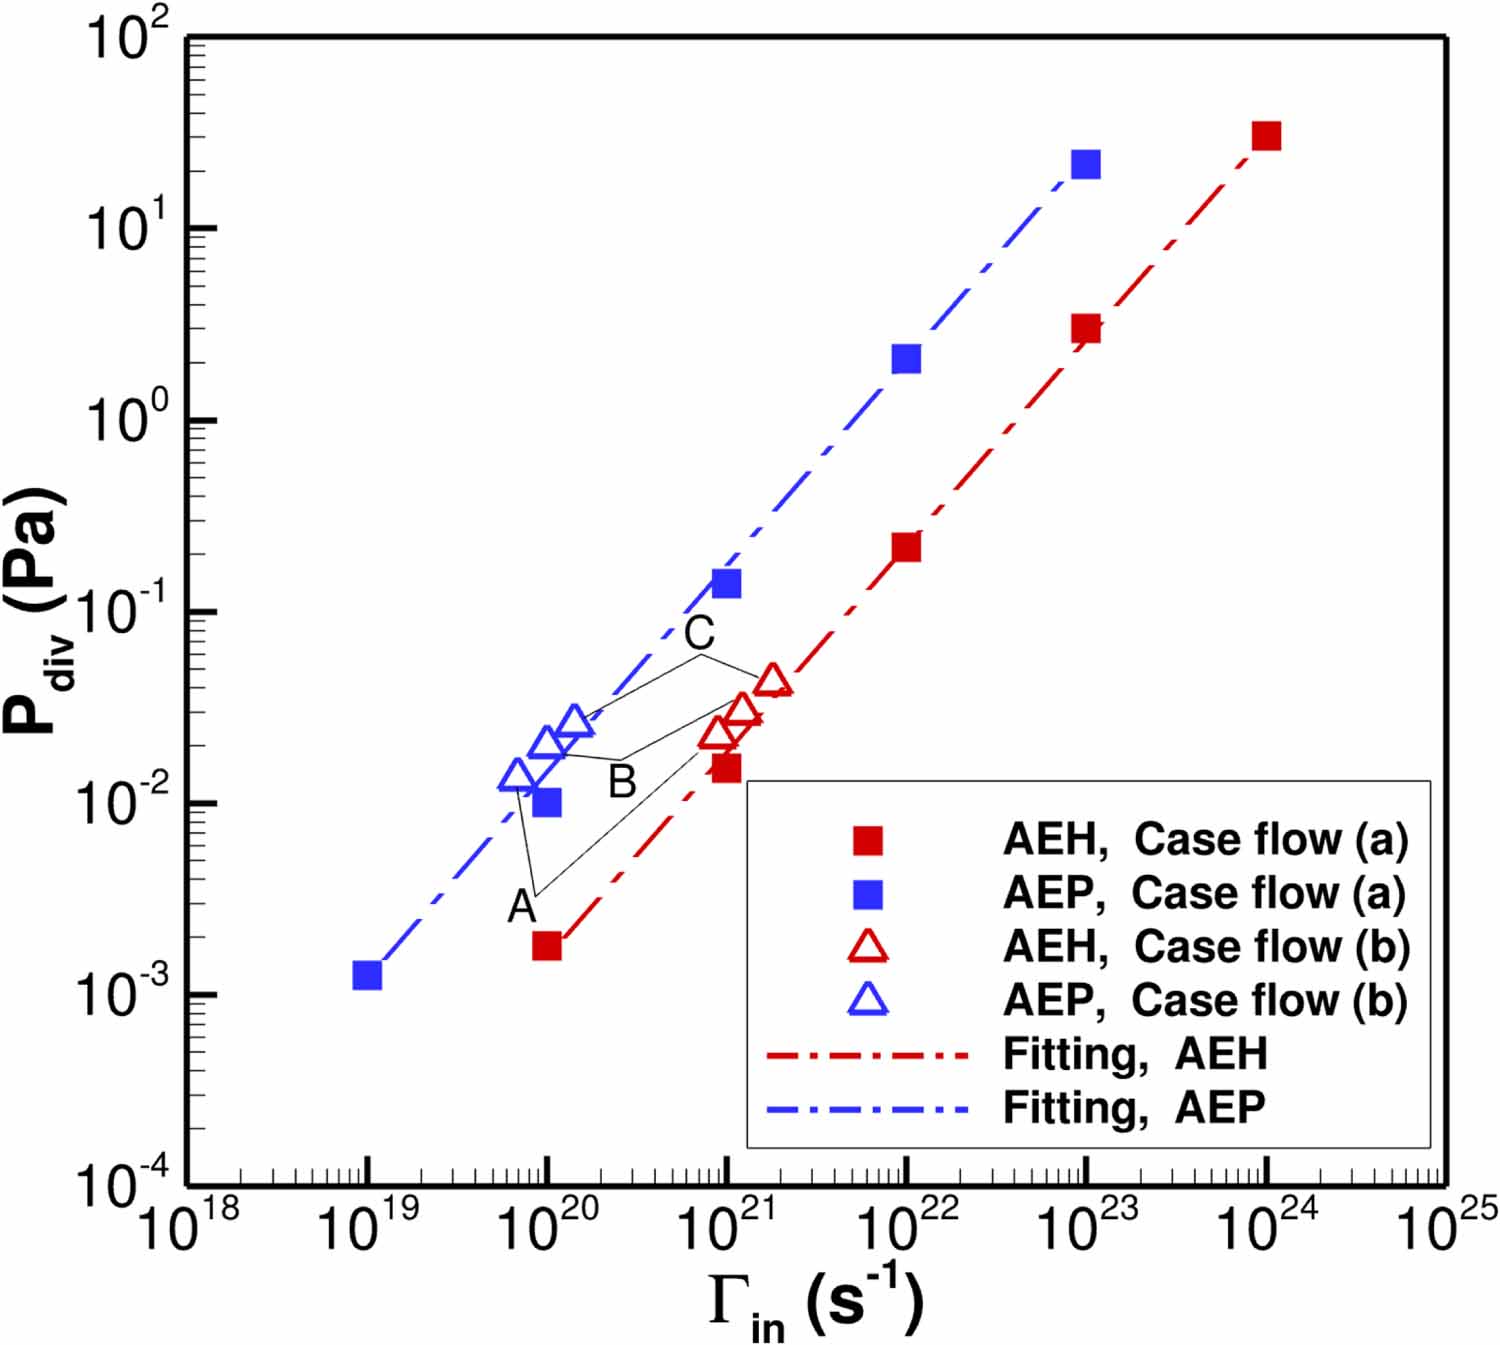
In figure 8, the divertor pressure  estimated by the DIVGAS simulations at the locations of the AEH and AEP pressure gauges respectively, as shown in figure 9, in terms of the total incoming particle flux
 at the corresponding pumping gap, is presented. The closed square symbols correspond to a parametric scan, in which the incoming particle flux
 at the AEH pumping gap varies between 1020 and 1024 (s−1) (filled red square symbols), while the
 at the AEP pumping gap is always an order of magnitude lower and varies between 1019 and 1023 (s−1) (filled blue square symbols). This case represents the flow case (a) as described in section 3. Such a choice aims to mimic a Standard magnetic plasma configuration. It is clearly seen that in a log-log scale, the sub-divertor neutral pressure
 is proportional to the incoming neutral particle flux
 in both AEH and AEP sections. Moreover, the simulated plasma scenarios A, B and C, in which a binary gas mixture of H2 and H is considered (i.e this case represents the flow case (b) as described in section 3), lie within the parametric scan considering a single gas flow of molecular hydrogen, having the same behavior in terms of
 vs
 . It is noted that in all three plasma scenarios, the estimated partial pressure of atomic hydrogen in the sub-divertor is 3–4 orders of magnitude lower compared to the ones for molecular hydrogen. Based on figure 8, correlations of the sub-divertor pressure
 with the total incoming particle flux
 at each of the AEH and AEP sections can be deduced. The scaling laws obtained for the case of AEH and AEP sections respectively are the following:
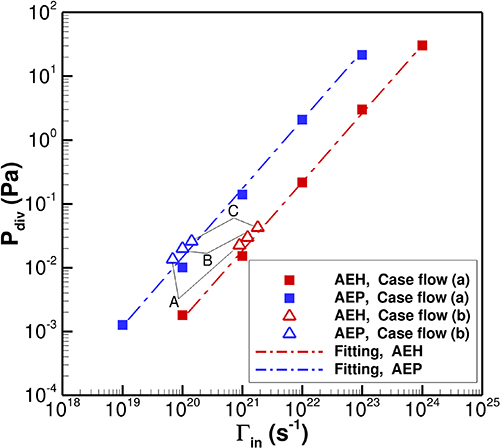
Figure 8. The sub-divertor pressure Pdiv estimated by DIVGAS at the locations of the AEH (red colour) and AEP (blue colour) pressure gauges respectively versus the total incoming particle flux Γin at the pumping gap. The filled squares correspond to the simulations considering single gas flow of molecular hydrogen (Case flow a), while the open triangles correspond to the coupled EMC3-EIRENE & DIVGAS simulations for plasma scenarios A, B and C, in which a gas mixture of H and H2 is considered (Case flow b).
Download figure:
Standard image High-resolution image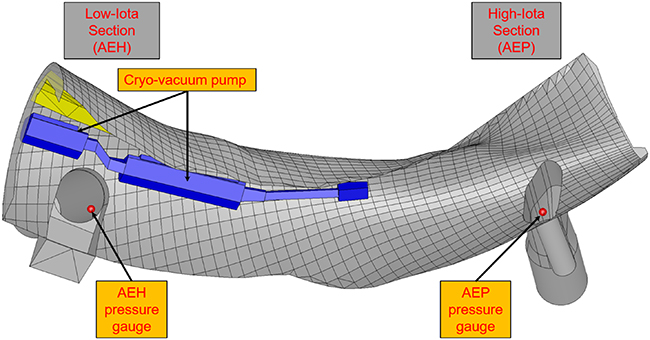
Figure 9. Exact position of the pressure gauges at the AEH and AEP sections.
Download figure:
Standard image High-resolution image (units Pa, s−1) and
 (units Pa, s−1). The coefficients of determination are
 and
 respectively. The significance of the above correlations lies in the fact that upstream plasma parameters—such as plasma density and temperature—can be used to estimate the incoming neutral particle flux in the sub-divertor. This neutral flux can then be linked to measurable quantities, such as the neutral pressure in the sub-divertor. In this way, information about exhaust parameters (e.g. neutral pressure) may provide valuable insights into the plasma conditions.
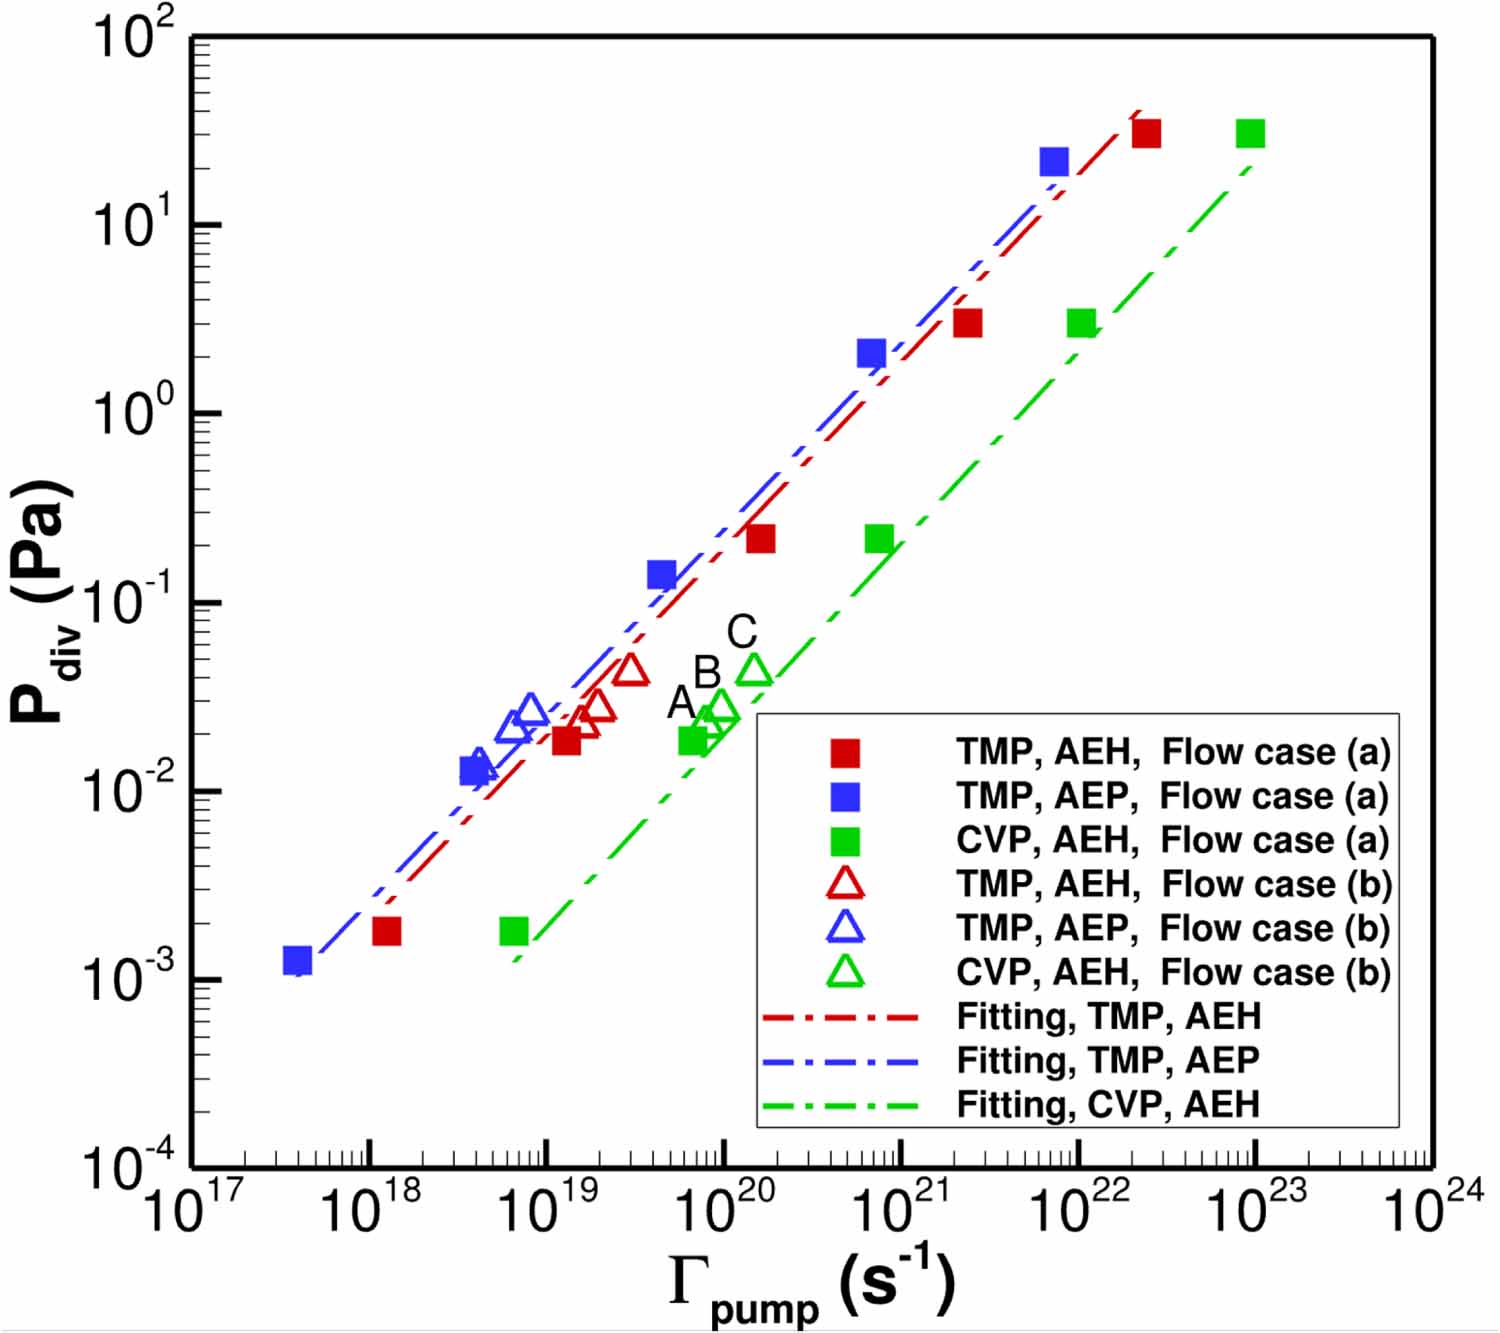
In figure 10, the divertor pressure  estimated by the DIVGAS simulations at the locations of the AEH and AEP pressure gauges respectively, in terms of the individual pumped flux
 at the pumping surfaces CSAEH and CSAEP (for the case of the TMPs) and at the CVP inlet surfaces respectively, is presented. Also in this case, in log-log scale and assuming steady-state conditions, the sub-divertor neutral pressure
 is proportional to the individual pumped flux, with the effective pumping speed to be a constant of proportionality. The same qualitative behavior has been experimentally as well as numerically observed, for the cases of ASDEX-Upgrade [25] and DTT [18] respectively. The average estimated effective pumping speed, which is deduced at the CSAEH surface, equals to
 m3 s−1, while for the CSAEP surface is
 m3 s−1. The effective pumping speed of the inlet surfaces of the cryo-vacuum pump CVP located at the AEH section, equals to
 m3 s−1. It is noted that in the case of TMPs, the yielded effective pumping speed is always smaller than the corresponding nominal pumping speed, given in section 2. This is attributed to the conductance, which intervenes between the inlet of the pump and the measurement point. For the case of the cryo-vacuum pump CVP, the yielded effective pumping speed is higher than the experimentally measured value of ∼7 m3 s−1 for one island divertor unit [9]. The main reason for overestimating the pumping speed of the CVP is the assumed sticking probability α, which in all cases equals to unity and consists a limit case. In reality, the sticking probability α takes lower values and may range between 0.6 and 0.8 [9]. Based on the above analysis, correlations of the sub-divertor pressure
 with the individual pumped flux
 for each pump can be deduced. The scaling laws obtained for the case of TMPs at the AEH and AEP sections as well as for the CVP at the AEH section respectively are the following:
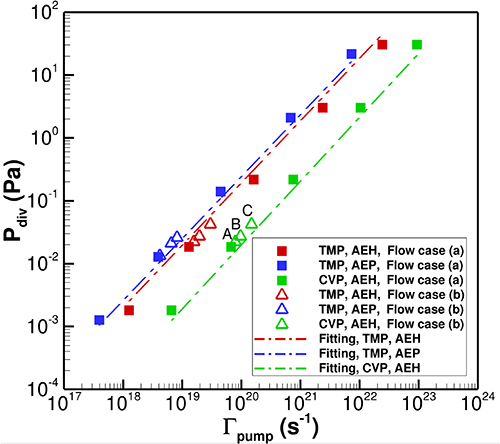
Figure 10. The sub-divertor pressure Pdiv estimated by DIVGAS at the locations of the AEH (red colour) and AEP (blue colour) pressure gauges respectively versus the pumped flux Γpump from TMPs and CVP. The filled squares correspond to the simulations considering single gas flow of molecular hydrogen (Case flow a), while the open triangles correspond to the coupled EMC3-EIRENE & DIVGAS simulations for plasma scenarios A, B and C, in which a gas mixture of H and H2 is considered (Case flow b).
Download figure:
Standard image High-resolution image (units Pa, s−1),
 (units Pa, s−1). and
 . The coefficient of determination equals to
 for all provided correlations.
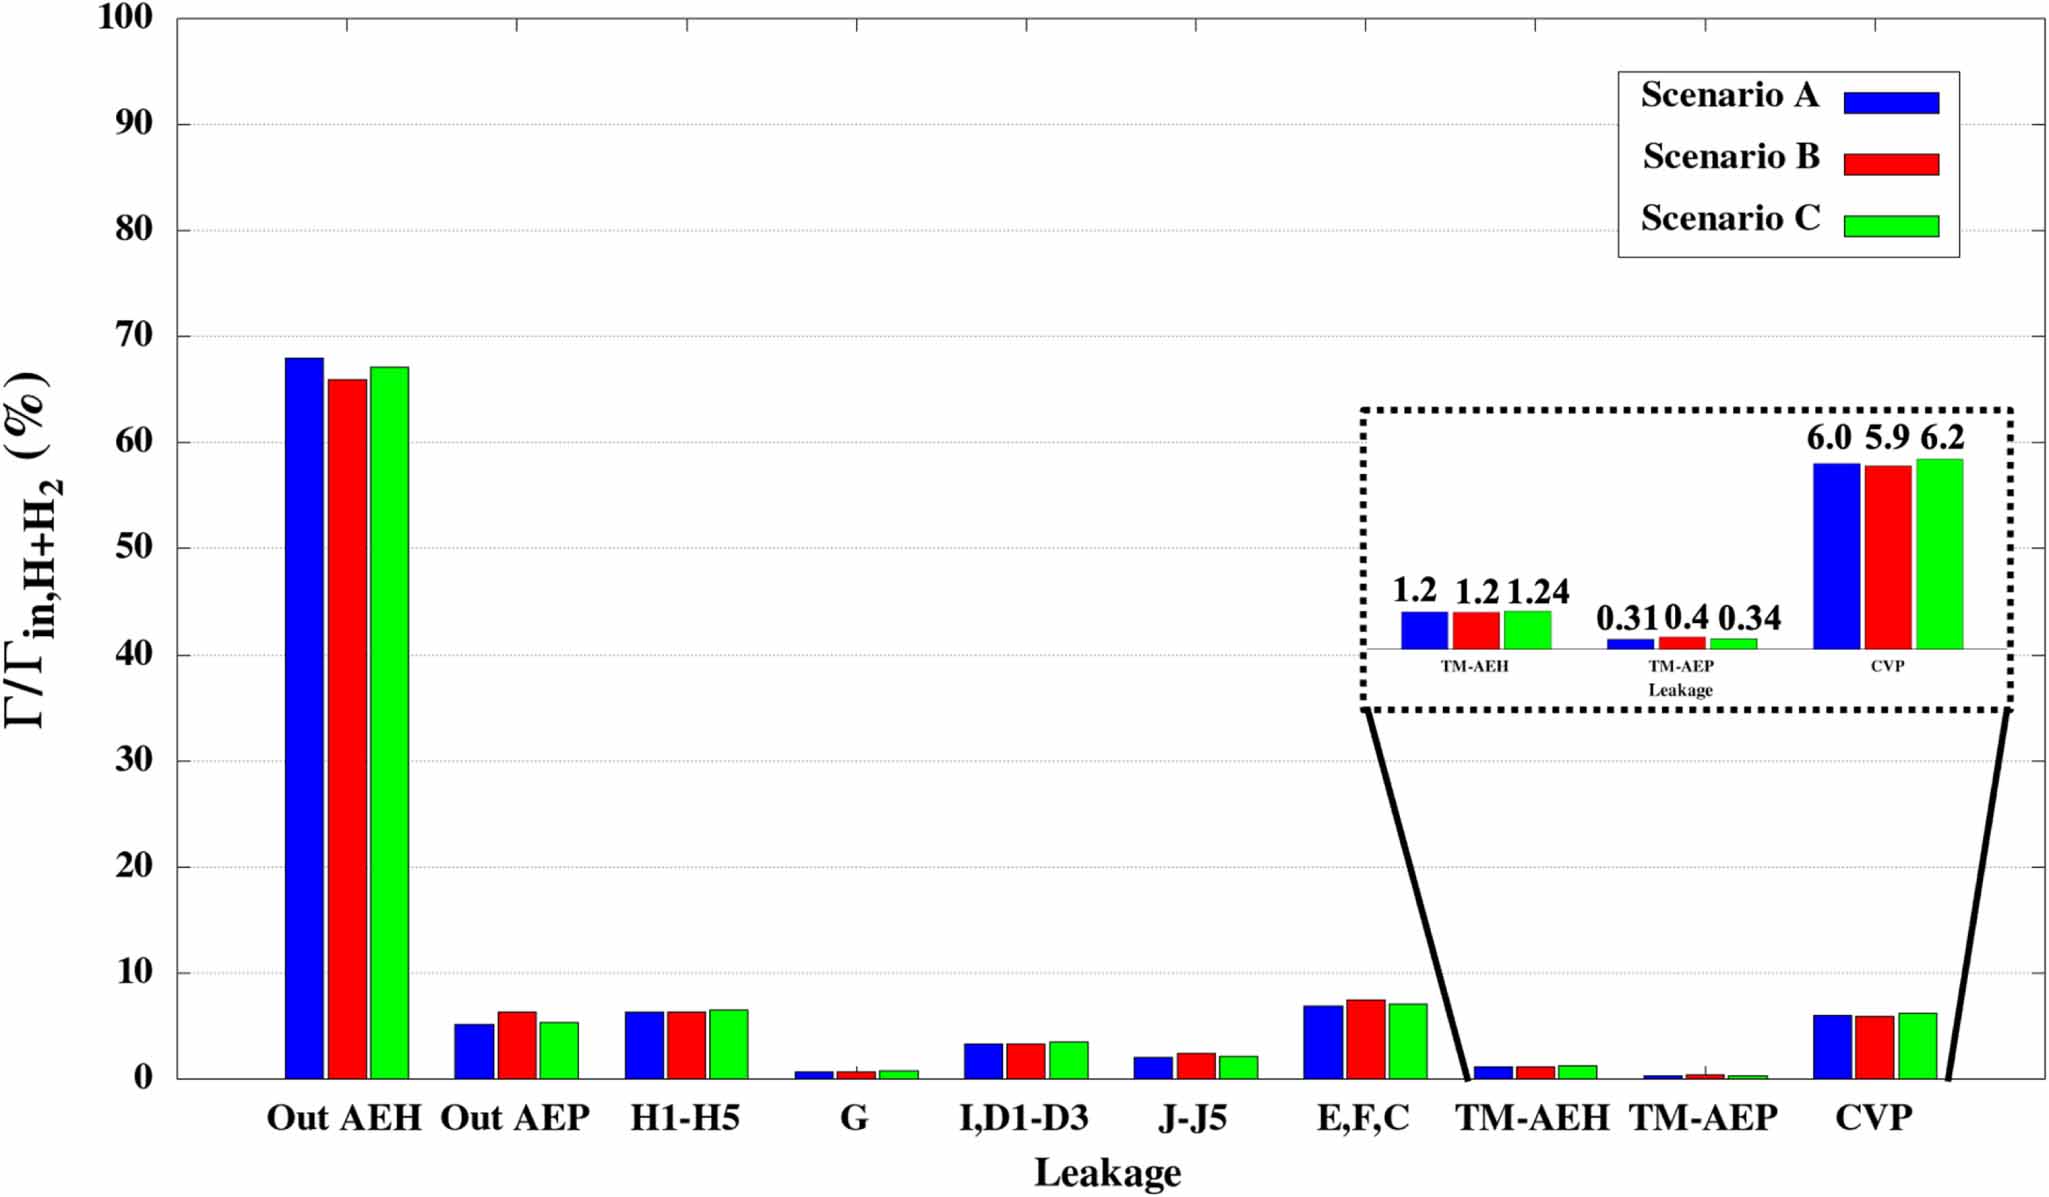
Figure 11 shows that among the three plasma scenarios considered, i.e the flow case (b) as described in section 3, scenario C has the highest pumping efficiency, with approximately ∼7.8% of the total pumped flux (i.e sum of the pumped flux from the turbomolecular and cryo-vacuum pumps, as presented in the enlarged inset of figure 11), compared to plasma scenarios A and B with total pumped flux equal to ∼7.5%. This is mainly due to the fact that scenario C has the highest total incoming particle flux in the sub divertor and indicates the potential of an improved particle exhaust by increasing the heating power. All three scenarios exhibit a high neutral outflux in the AEH section, around ∼68% of the total incoming particle flux  . Additionally, the neutral flux through the horizontal targets (H1 to H5 in figure 3(a)) and the toroidal leakages (E, F, and C in figure 3(b)) is the highest among the considered leakages. Closing these openings could further enhance the overall pumping efficiency.
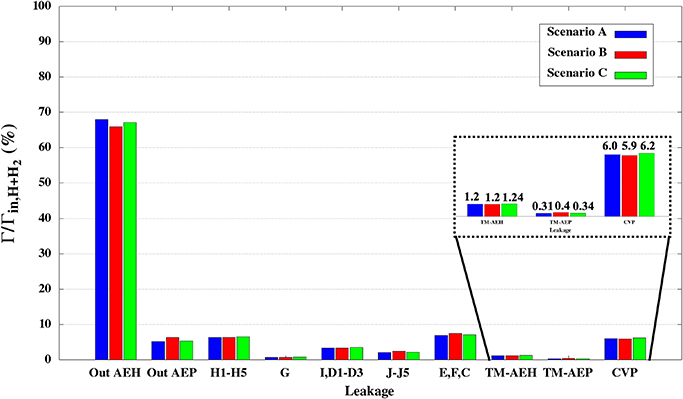
Figure 11. Percentage of total incoming particle flux Γin (i.e sum of H and H2), which goes through each of the individual leakages and openings, for the considered plasma scenarios A, B and C.
Download figure:
Standard image High-resolution image4.3. Influence of the cryo-vacuum pump on the sub-divertor neutral pressure
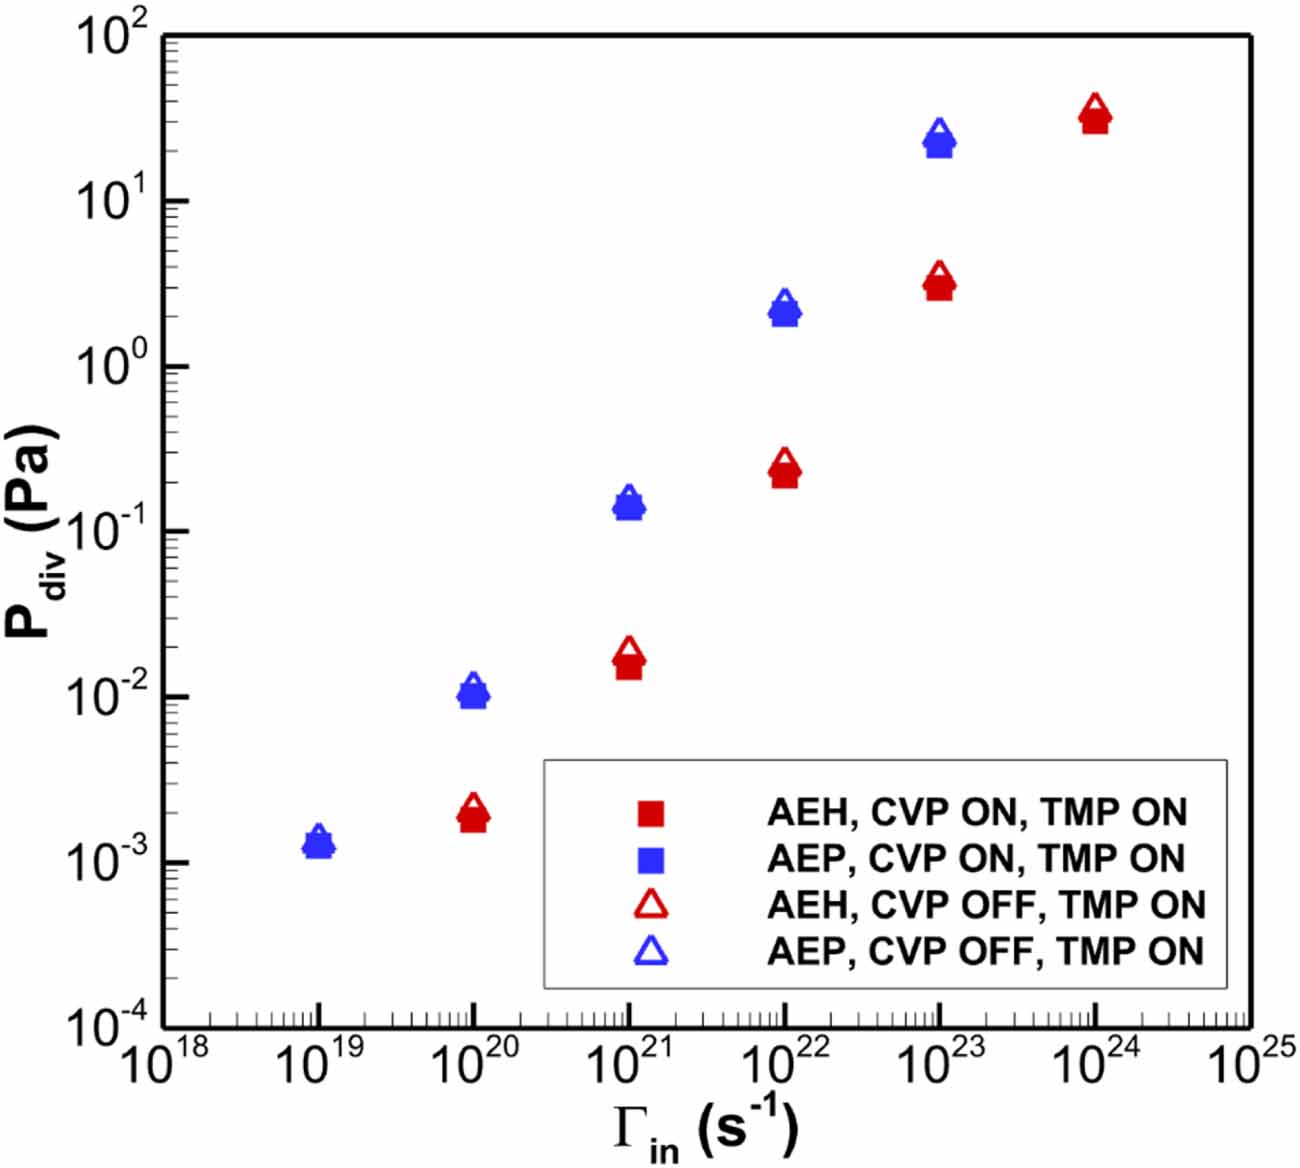
Figure 12 shows the estimated sub-divertor pressure at the AEH and AEP sections as a function of the incoming particle flux  for both CVP ON and OFF scenarios. It is observed that switching off the CVP increases the pressure in the AEH and AEP sub-divertor sections by approximately 15% and 9%, respectively. This indicates that the CVP has a moderate effect on sub-divertor neutral pressure. As noted in figure 7, the CVP’s pumping speed for H2 increases within the pressure range of 0.1–10 Pa. However, at higher sub-divertor pressures, the CVP’s pumping speed decreases, due to choked-flow conditions as previously described in section 4.1 and illustrated in figure 7. Therefore, the CVP performs optimally when the plasma scenario results in sub-divertor pressures around 10 Pa.
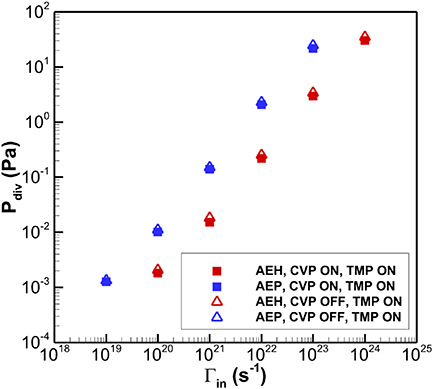
Figure 12. The sub-divertor pressure Pdiv estimated at the locations of the AEH (red colour) and AEP (blue colour) pressure gauges respectively versus the total incoming particle flux Γin at the pumping gap. The filled squares correspond to the simulations considering both TMPs and CVP ON, while the open triangles correspond to the case with TMPs ON and CVP OFF.
Download figure:
Standard image High-resolution image4.4. Estimation of the albedo coefficient at the pumping gaps
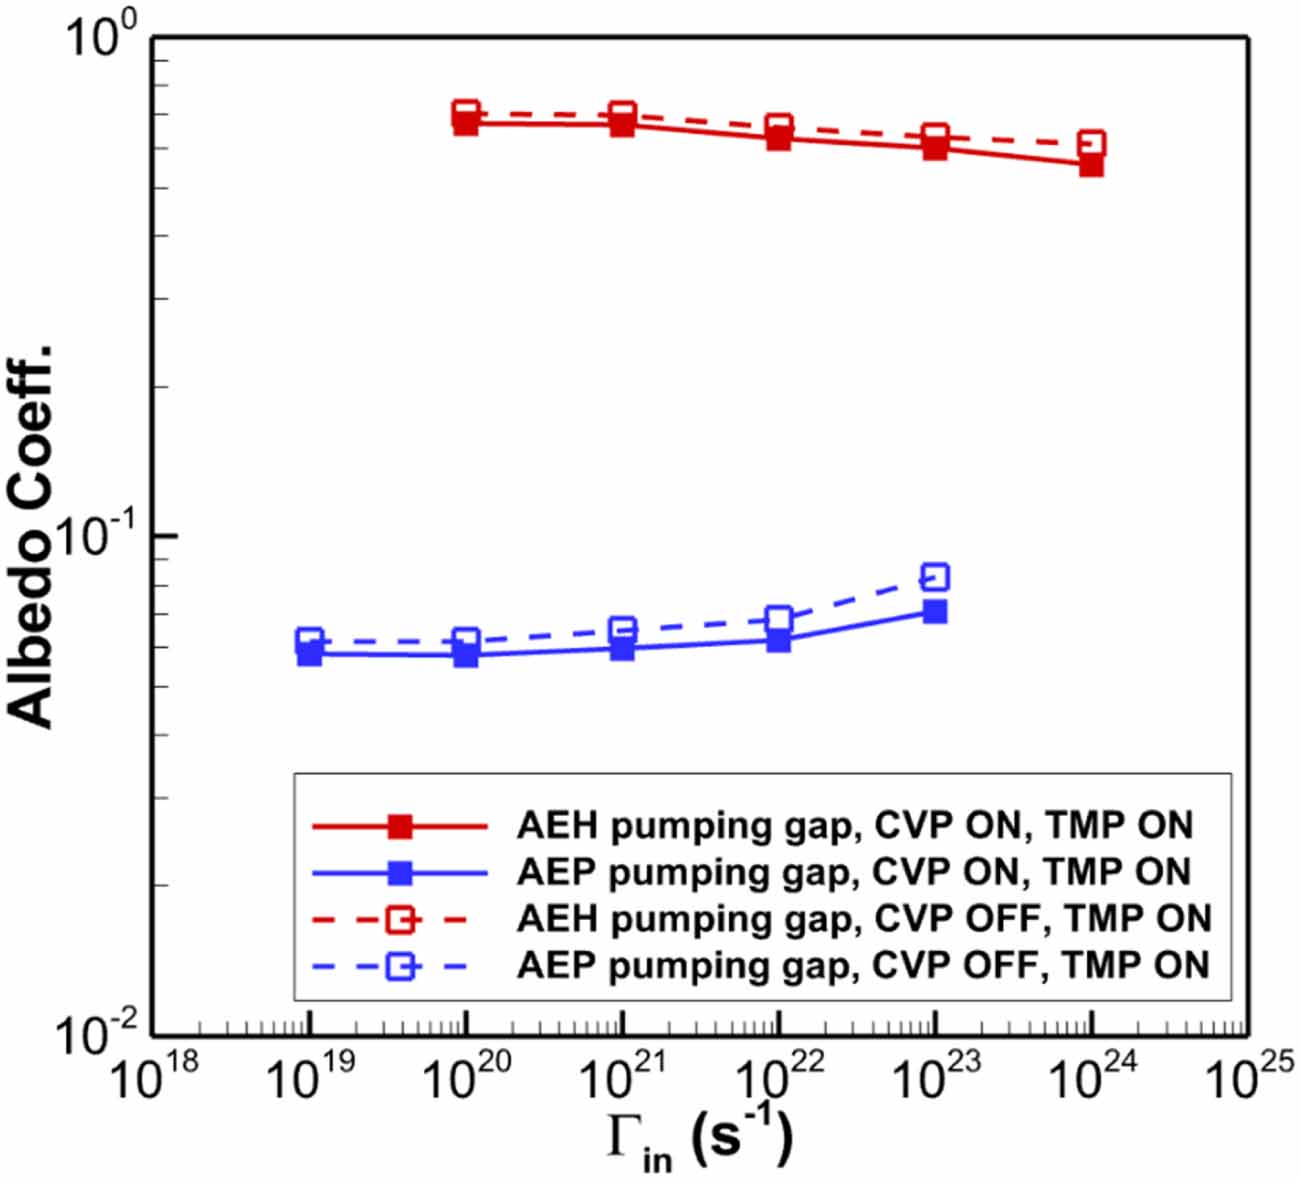
Figure 13 illustrates the albedo coefficient, which represents the probability of a neutral particle, after entering the sub-divertor area through the pumping gap, to travel back towards the plasma vessel. That said, the albedo coefficient at the pumping gap is defined as  . For the AEH pumping gap, as
 increases, the albedo coefficient slightly decreases. This is primarily due to the transition from free molecular flow to viscous flow, which reduces direct reflection from the pumping gap panel in the AEH section under viscous flow conditions. Specifically, increasing
 by four orders of magnitude results in a 17.3% decrease in the albedo coefficient. Moreover, it is reminded that the high value of the albedo coefficient in the AEH section compared to the AEP section is attributed to the existence of the pumping gap panel, which has a crucial contribution on the neutral outflux, as presented in [1]. On the other hand, the AEP pumping gap exhibits an increase in the albedo coefficient by approximately 17.8%, following the overall particle balance in the sub-divertor volume. When the CVP is switched off, the albedo coefficient increases by an average of 6% and 10% in the AEH and AEP pumping gaps, respectively. Although the effective pumping speed of the CVP is much larger than the one of TMPs, by switching off the cryo-vacuum pump, the previously pumped flux is distributed along the opening/leakages and only very few percent of it contributes to the increase of the outflux, namely only few percent increase in the albedo is observed. This behavior is valid for all the examined pressure range.
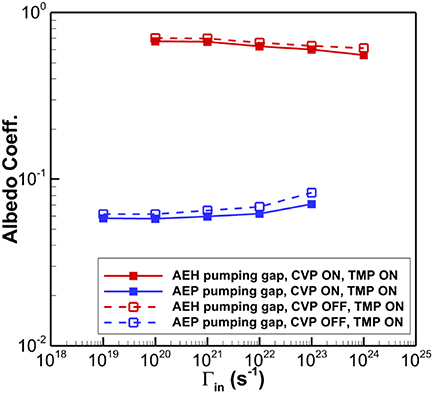
Figure 13. The albedo coefficient at the AEH (red colour) and AEP (blue colour) pumping gaps respectively versus the total incoming particle flux Γin for the case of CVP ON and OFF.
Download figure:
Standard image High-resolution imageFor completeness purposes, the estimated albedo coefficients are provided in tabulated form in table 3. It is highlighted that the albedo coefficient at both pumping gaps can be utilized as an input parameter in future EMC3-EIRENE simulations. This approach allows the EMC3-EIRENE simulation to account for the sub-divertor geometry, neutral gas dynamics, and the corresponding pumping scenario, while reducing the required computational effort by excluding the sub-divertor volume.
Table 3. The albedo coefficient in tabulated form, at the AEH and AEP pumping gaps respectively versus the corresponding incoming particle flux Γin. The pumping scenarios with CVP ON and OFF are considered.
| Incoming particle flux Γin (s−1) @ AEH pumping gap | Incoming particle flux Γin (s−1) @ AEP pumping gap | albedo@AEH pumping gap, CVP ON, TMP, ON | albedo@AEP pumping gap, CVP ON, TMP, ON | albedo@AEH pumping gap, CVP OFF, TMP, ON | albedo@AEP pumping gap, CVP OFF, TMP, ON |
|---|---|---|---|---|---|
| 1.0 × 10²⁰ | 1.0 × 10¹⁹ | 0.67 | 0.058 | 0.704 | 0.062 |
| 1.0 × 10²¹ | 1.0 × 10²⁰ | 0.67 | 0.058 | 0.699 | 0.062 |
| 1.0 × 10²² | 1.0 × 10²¹ | 0.62 | 0.060 | 0.658 | 0.065 |
| 1.0 × 10²³ | 1.0 × 10²² | 0.60 | 0.062 | 0.631 | 0.068 |
| 1.0 × 1024 | 1.0 × 10²³ | 0.56 | 0.071 | 0.610 | 0.083 |
5. Conclusions
In the present work the DSMC solver of the DIVGAS workflow has been successfully applied for modeling the 3D neutral gas flow in the sub-divertor region of the W7-X, for the case of the Standard magnetic configuration. The main conclusions, which can be extracted from the above numerical analysis could be summarized as follows; The coupling between EMC3-EIRENE and DIVGAS, which consider the fact that the incoming neutral particle flux at the sub-divertor is based on realistic plasma background, has been demonstrated. Three plasma scenarios have been considered, for which is clearly seen that by increasing the heating power, the neutral pressure as well as the resulting pumping efficiency is increased. The obtained numerical results of the neutral pressure in the sub-divertor at both AEH and AEP sections lie within a more general scan matrix, which assumes a wider range of incoming particle flux, namely 1019–1024 (s−1).
It has been presented that under steady-state conditions, the sub-divertor neutral pressure is proportional to the incoming neutral particle flux in both AEH and AEP sections, with the effective pumping speed to be a constant of proportionality. Such a behavior of the sub-divertor pressure in terms of the incoming neutral flux allows for disentangling the flow conditions in the gas exhaust of W7-X with the upstream plasma parameters. Furthermore, based on the present simulations, correlations of the sub-divertor pressure with the total incoming particle flux as well as the total pumped flux at each of the AEH and AEP sections have been deduced. These expressions can be used for engineering and design purposes.
Moreover, it has been observed that the influence of switching off the cryo-vacuum pump on the sub-divertor pressure is rather modest and an increase of the neutral pressure in the AEH and AEP sub-divertor sections by ∼15% and ∼9% respectively should be expected.
Finally, it has been demonstrated that the influence of the incoming neutral particle flux on the albedo coefficients at the AEH and AEP pumping gaps is relative weak. The provided albedo database can potentially accelerate future EMC3-EIRENE simulations, by replacing the sub-divertor area, while adequately considering all neutral gas dynamics and pumping conditions. All the above numerical findings will support the optimization of the W7-X particle exhaust, in preparation for the ongoing/upcoming experimental campaigns.
Acknowledgment
This work has been carried out within the framework of the EUROfusion Consortium, funded by the European Union via the Euratom Research and Training Programme (Grant Agreement No 101052200—EUROfusion). Views and opinions expressed are however those of the author(s) only and do not necessarily reflect those of the European Union or the European Commission. Neither the European Union nor the European Commission can be held responsible for them.
The work performed by D. Boeyaert was funded by the U.S. Department of Energy under Grant Numbers DE-SC0014210.
In addition, this work was performed within the 6th and 7th cycles of MARCONI-FUSION HPC (project STEL-KIT). Moreover, this research used resources of the National Energy Research Scientific Computing Center, a DOE Office of Science User Facility supported by the Office of Science of the U.S. Department of Energy under Contract No. DE-AC02-05CH11231 using NERSC Award FES-ERCAP0028693. Finally, we acknowledge support by the KIT-Publication Fund of the Karlsruhe Institute of Technology.