Abstract
Deuterium and tritium are easy to permeate into the fusion reactor internals, and Fe–Al/Al2O3 composite coating can effectively hinder the permeation behavior of hydrogen isotopes. However, the temperature in the preparation process of Fe–Al/Al2O3 coating in many literatures is high, which will affect the mechanical properties of 316 l stainless steel. In this paper, Fe–Al/Al2O3 coating was prepared by pack aluminizing, heat treatment and in-situ oxidation at low temperature of 700 °C or less. The aluminized layer gradually transforms from Fe2Al5 and FeAl3 to FeAl and Fe3Al during heat treatment. Compared with the aluminized layer prepared at 650 °C, the aluminized layer prepared at 600 °C is thinner and the heat treatment time is shorter. The thickness of the oxide layer prepared at 700 °C for 10 h and 24 h in pure O2 atmosphere is 87 nm and 131 nm. The oxide layer has the microstructure of polycrystalline γ-Al2O3 mixed with amorphous Al2O3. The sample aluminized at 600 °C and oxidized in pure O2 atmosphere at 700 °C for 24 h has the best deuterium permeation resistance, and the deuterium permeation reduction factor (PRF) in the range of 450 °C–600 °C is higher than 5000. The PRF increases with the increase of temperature. The possible reason is that the deuterium permeability of 316 LSS substrate increases greatly with the increase of temperature, while that of the coating samples is less affected by the temperature change. The excellent deuterium permeation resistance of the coating is due to the high density of the Al2O3 layer.

Original content from this work may be used under the terms of the Creative Commons Attribution 4.0 license. Any further distribution of this work must maintain attribution to the author(s) and the title of the work, journal citation and DOI.
1. Introduction
Stainless steel (316 LSS) is one of the candidate materials for the international thermonuclear experimental reactor (ITER) in-vessel components. The main nuclear reaction in ITER is deuterium–tritium reaction [1, 2]. Deuterium and tritium are easy to permeate into structural materials, which affects the safety and self-sustainability of ITER. Therefore, the permeation behavior of hydrogen isotope has great research significance [3–12]. One of the solutions to reduce tritium permeation is to prepare a tritium permeation barrier coating on the surface of the material [13–18].
Al2O3 is a candidate material for tritium permeation barrier coating due to its excellent tritium permeation resistance, high temperature resistance and corrosion resistance [19–24]. The preparation methods of Al2O3 include metal organic decomposition (MOD), magnetron sputtering, sol-gel, in-situ oxidation, etc. The Al2O3 coating prepared by MOD showed excellent deuterium permeation resistance, however, there are many voids and cracks in Al2O3 by MOD, which need to be sealed [25, 26]. The magnetron sputtering technology is not convenient to coat intricate shapes [27]. The sol-gel method possesses long processing time, therefore is not convenient for engineering application [28]. Compared with the above method, the in-situ oxidation method is a promising method for preparing dense and uniform tritium permeation barrier coating and is suitable for engineering applications [29, 30]. This is the reason why the Al2O3 layer is prepared by in-situ oxidation method in this paper. As a tritium permeation barrier coating, the irradiation resistance of Al2O3 is worthy of attention [31]. With the increase of Au2+ ion irradiation dose, the amorphous Al2O3 gradually transforms into crystalline γ-Al2O3 and the permeation reduction factor (PRF) value of the Al2O3 coating decreases by less than one order of magnitude when the irradiation dose reaches 5 dpa [32, 33]. In addition, the deuterium permeation resistance of α-Al2O3 coating can be improved by doping element. Long et al found that the diffusion barrier can be increased by doping tungsten, thereby improving the deuterium permeation resistance of α-Al2O3 coatings [34]. The hydrogen migration barrier of α-Al2O3 coating can also be increased by doping iron [35]. Moreover, the microstructure and corrosion resistance of Al2O3 coating were investigated [36, 37]. Amorphous, γ and α phase Al2O3 were obtained at different calcination temperatures [36]. The Al2O3 coating still maintains structural integrity after 1000 h long-term lead–lithium corrosion test [37].
Al2O3 has attracted much attention as a promising candidate material for tritium permeation barrier coatings. However, thermal stress is easily generated at the coating-substrate interface due to the difference of thermal expansion coefficient between substrate and Al2O3 coating [38]. It is necessary to solve this problem before the application of Al2O3 as tritium permeation barrier coating. Therefore, researchers have devoted themselves to the investigation of composite coatings that combine the advantages of different coatings. For example, the Fe–Al layer in the Fe–Al/Al2O3 composite coating is suitable as a transition layer between the substrate and the Al2O3 layer, which can provide an aluminum source for the self-healing of the Al2O3 layer [39]. Fe–Al transition layer can be prepared by many methods, such as pack aluminizing, magnetron sputtering, hot-dip aluminizing and so on [40–44]. The magnetron sputtering technology is difficult to be applied to the surface coating preparation of complex structural components [27]. The Fe–Al layer prepared by HDA is inhomogeneous and many cracks and holes appear in the Fe–Al layer [45]. Considering the convenience of engineering application, pack aluminizing is a popular method for preparing Fe–Al layer [44, 46, 47].
The microstructure of the composite coating is worthy of attention for the reason that the integrity of the coating is a key factor in the deuterium permeation resistance of the Fe–Al/Al2O3 coating [48]. The phase transformation process of Al2O3 in Fe–Al/Al2O3 coating was analyzed by Majumdar et al [49]. The Al/Fe/O interface in the Fe–Al/Al2O3 coating is beneficial to reduce the permeation of hydrogen [50]. In addition to the deuterium permeation resistance, the Fe–Al/Al2O3 coating exhibits excellent thermal shock resistance, irradiation resistance and lead–bismuth corrosion resistance [51–53]. As a tritium permeation barrier coating, the Fe–Al/Al2O3 coating needs to maintain the integrity of structure and function in the irradiation environment. The Fe–Al/Al2O3 coating still exhibited excellent lead-bismuth corrosion resistance after 6 MeV Au2+ irradiation [52]. Moreover, the Fe–Al/Al2O3 coating exhibits excellent irradiation resistance in Fe3+ ion irradiation experiments [53]. The optimization of Fe–Al/Al2O3 coating performance can be achieved by doping elements. Liu et al found that the lead-bismuth corrosion resistance of Fe–Al/Al2O3 coating can be improved by doping Er2O3 [54]. Furthermore, the bonding strength of Fe–Al/Al2O3 coating can be improved by doping yttrium [55]. However, the experimental temperature during the preparation of many Fe–Al/Al2O3 coatings is high. The deuterium permeation resistance of Al2O3 coating decreased after annealing at high temperature (800 °C) [56]. It is of great significance to explore the low temperature preparation process of Fe–Al/Al2O3 composite coating.
In this paper, the preparation process of Fe–Al/Al2O3 coating on 316LSS substrate was optimized. The preparation temperature of the coating does not exceed 700 °C. The Fe–Al aluminized layer was prepared by pack aluminizing and converted into FeAl phase by heat treatment. The surface of the aluminized layer after heat treatment was polished, and then the Al2O3 layer was prepared by in-situ oxidation. The microstructure and deuterium resistance of Fe–Al/Al2O3 coating were investigated.
2. Materials and methods
2.1. Preparation of coating
The substrate was 316LSS and was cut into discs with a diameter of 12 mm and a thickness of 0.5 mm. The substrate was polished with 2000# sandpaper, ultrasonically cleaned in alcohol and dried. The Fe–Al layer was prepared by pack aluminizing. The aluminizing agent includes Al powder, Al2O3 powder and AlCl3 powder, and the mass ratio is 20:27:3. The details of pack aluminizing process are shown in [42]. Two groups of aluminized samples were prepared at 600 °C and 650 °C respectively, and the aluminizing time was 2 h. The 650 °C-2 h aluminized samples were named A-1 samples, and the 600 °C-2 h aluminized sample were named A-2 samples. Subsequently, the aluminized samples were placed in a pure Ar atmosphere at 700 °C for heat treatment, and the samples after heat treatment for 10 h and 30 h were named as H-10 and H-30 samples, respectively. The surface of the heat-treated samples was polished with 2000# sandpaper, and then mechanically polished with 3 μm polishing slurry. The polished heat-treated samples were placed in a tube furnace and subjected to in-situ oxidation in a pure O2 atmosphere to obtain Fe–Al/Al2O3 composite coating samples. The samples oxidized for 10 h and 24 h were named as O-10 and O-24 samples, respectively. The naming of samples with different heat treatment time and oxidation time follows the same format. Among them, the 1000-O-2 sample was oxidized at 1000 °C, and the other oxidized samples were oxidized at 700 °C. The Sample parameters are shown in table 1.
Table 1. Sample parameters.
| Sample name | Aluminizing | Heat treatment | Oxidation |
|---|---|---|---|
| A-1 | 650 °C for 2 h | / | / |
| A-2 | 600 °C for 2 h | / | / |
| A-1/H-10 | 650 °C for 2 h | 700 °C for 10 h | / |
| … | … | … | … |
| A-1/H-250 | 650 °C for 2 h | 700 °C for 250 h | / |
| A-2/H-30 | 600 °C for 2 h | 700 °C for 30 h | / |
| … | … | … | … |
| A-2/H-60 | 600 °C for 2 h | 700 °C for 60 h | / |
| A-1/H-250/O-10 | 650 °C for 2 h | 700 °C for 250 h | 700 °C for 10 h |
| A-1/H-250/O-24 | 650 °C for 2 h | 700 °C for 250 h | 700 °C for 24 h |
| A-1/H-250/1000-O-2 | 650 °C for 2 h | 700 °C for 250 h | 1000 °C for 2 h |
| A-2/H-60/O-10 | 600 °C for 2 h | 700 °C for 60 h | 700 °C for 10 h |
| A-2/H-60/O-24 | 600 °C for 2 h | 700 °C for 60 h | 700 °C for 24 h |
| A-2/H-60/O-50 | 600 °C for 2 h | 700 °C for 60 h | 700 °C for 50 h |
2.2. Microstructure characterization
A field emission scanning electron microscope (FE-SEM, JSM-IT800) equipped with an energy dispersive spectrometer (EDS, Oxford-AZtecLive UltimMax 100) was used to obtain the surface morphology and element distribution of the coating. X-ray diffractometer (XRD, Empyrean) and x-ray photoelectron spectroscopy (XPS, Thermo Fisher Escalab Xi+) were used to analyze the phase of the coating. Field emission transmission electron microscopy (FE-TEM, Thermo Fisher Talos F200X G2) was used to analyze the microstructure and element distribution of the coating cross-section. TEM cross-section samples were prepared by focused ion beam (FIB, Thermo Fisher HELIOS 5UX Ultimax100&Symetry).
2.3. Deuterium permeation experiment
Deuterium permeation experiment was performed using a gas-driven deuterium permeation device. The details of device and experiment are shown in [57]. In the deuterium permeation experiment, the deuterium pressure on the upstream side of the samples was 100 kPa, and the downstream side was continuously vacuumed. The temperature range is 450 °C–600 °C. Before the experiment, the downstream coating samples were removed and only the coating on the upstream coating was retained.
3. Results and discussion
3.1. Microstructure of heat treated samples
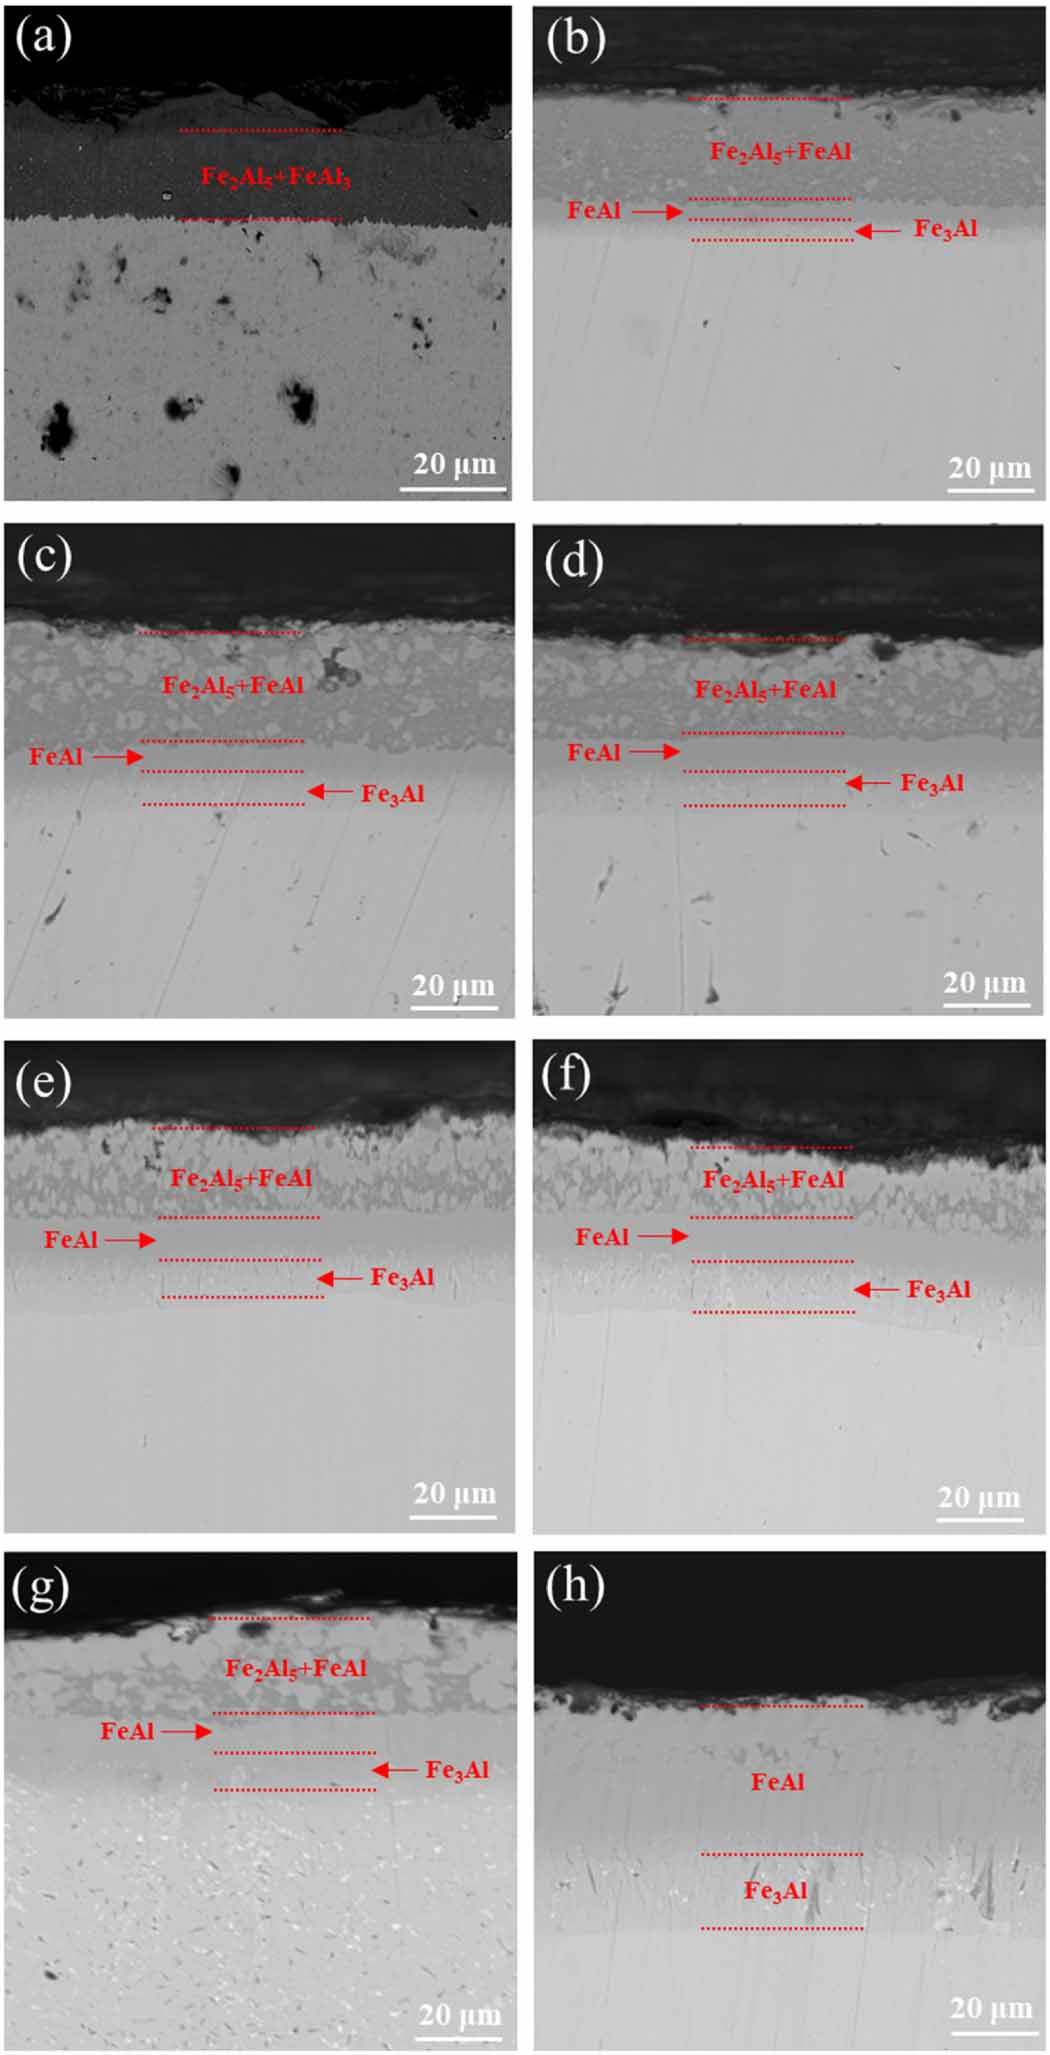
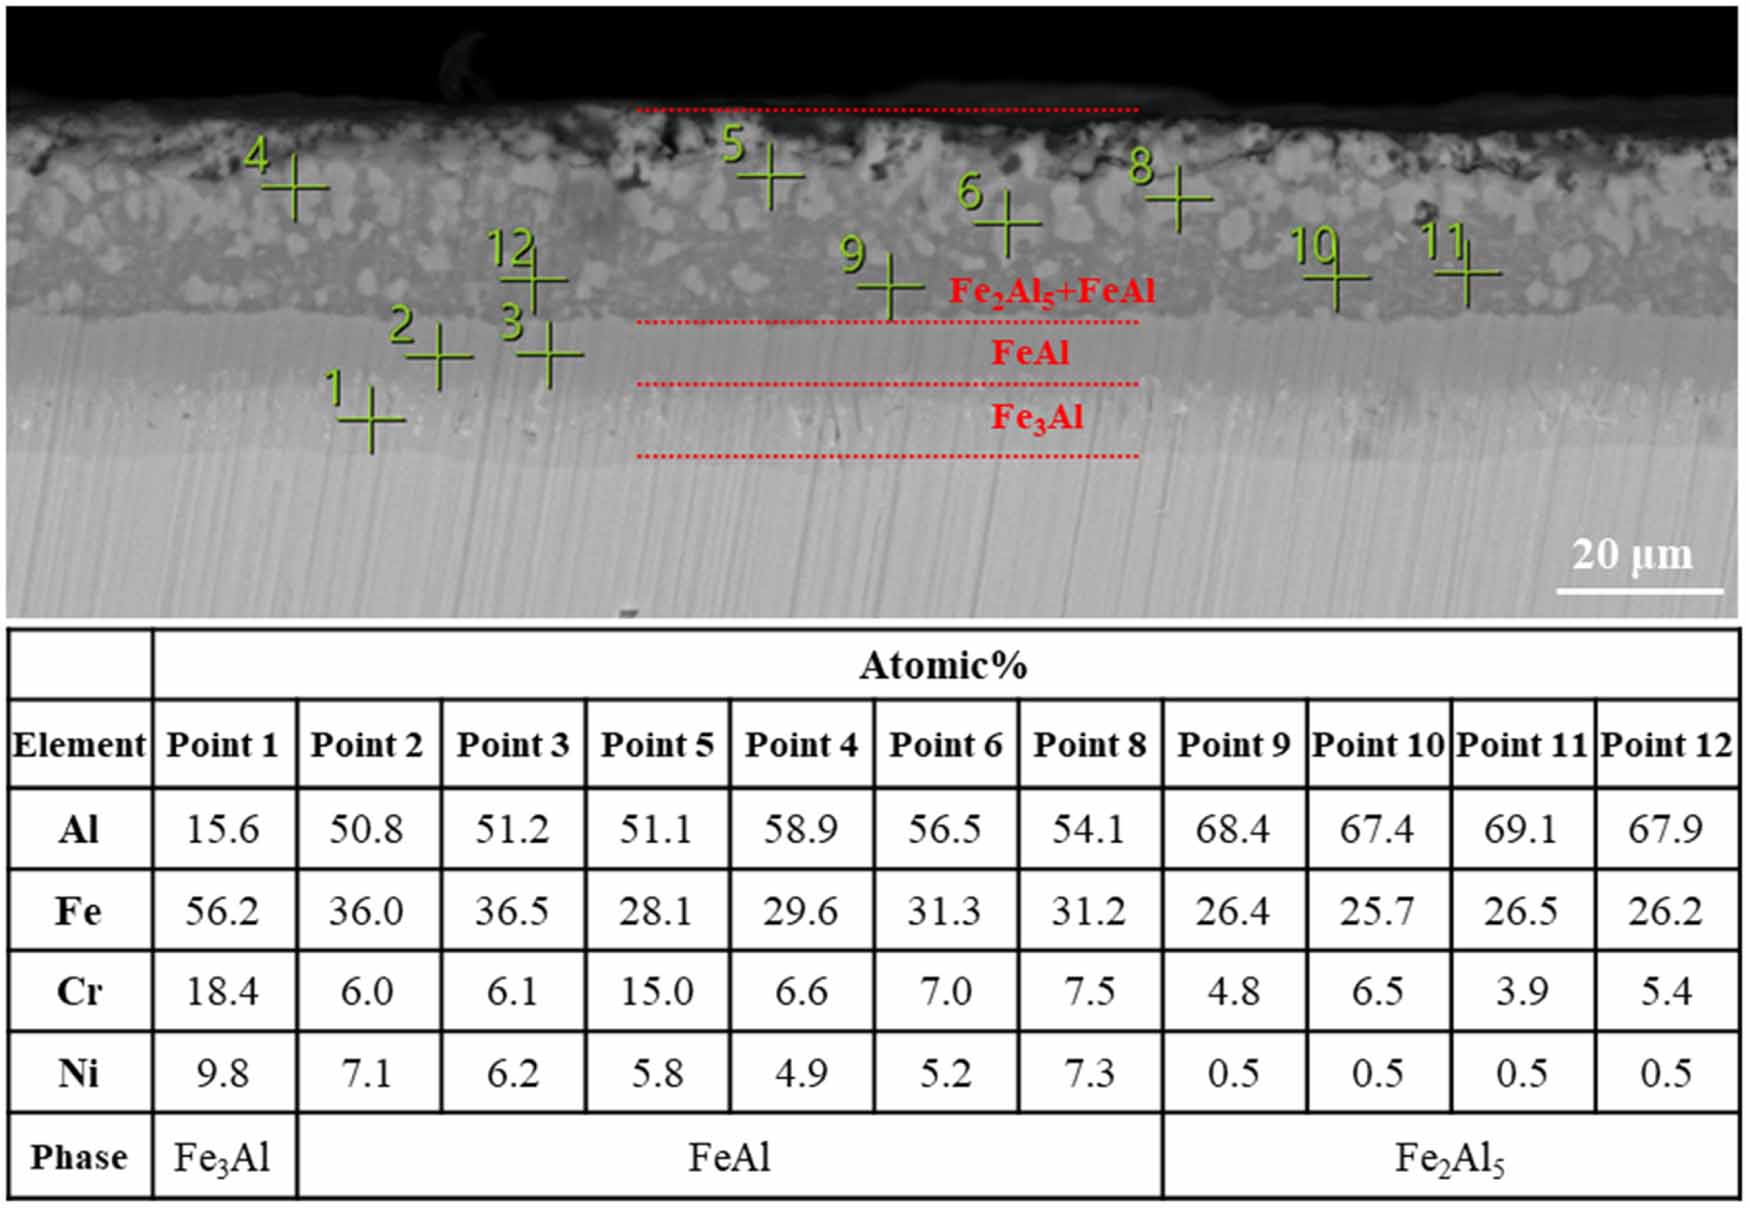
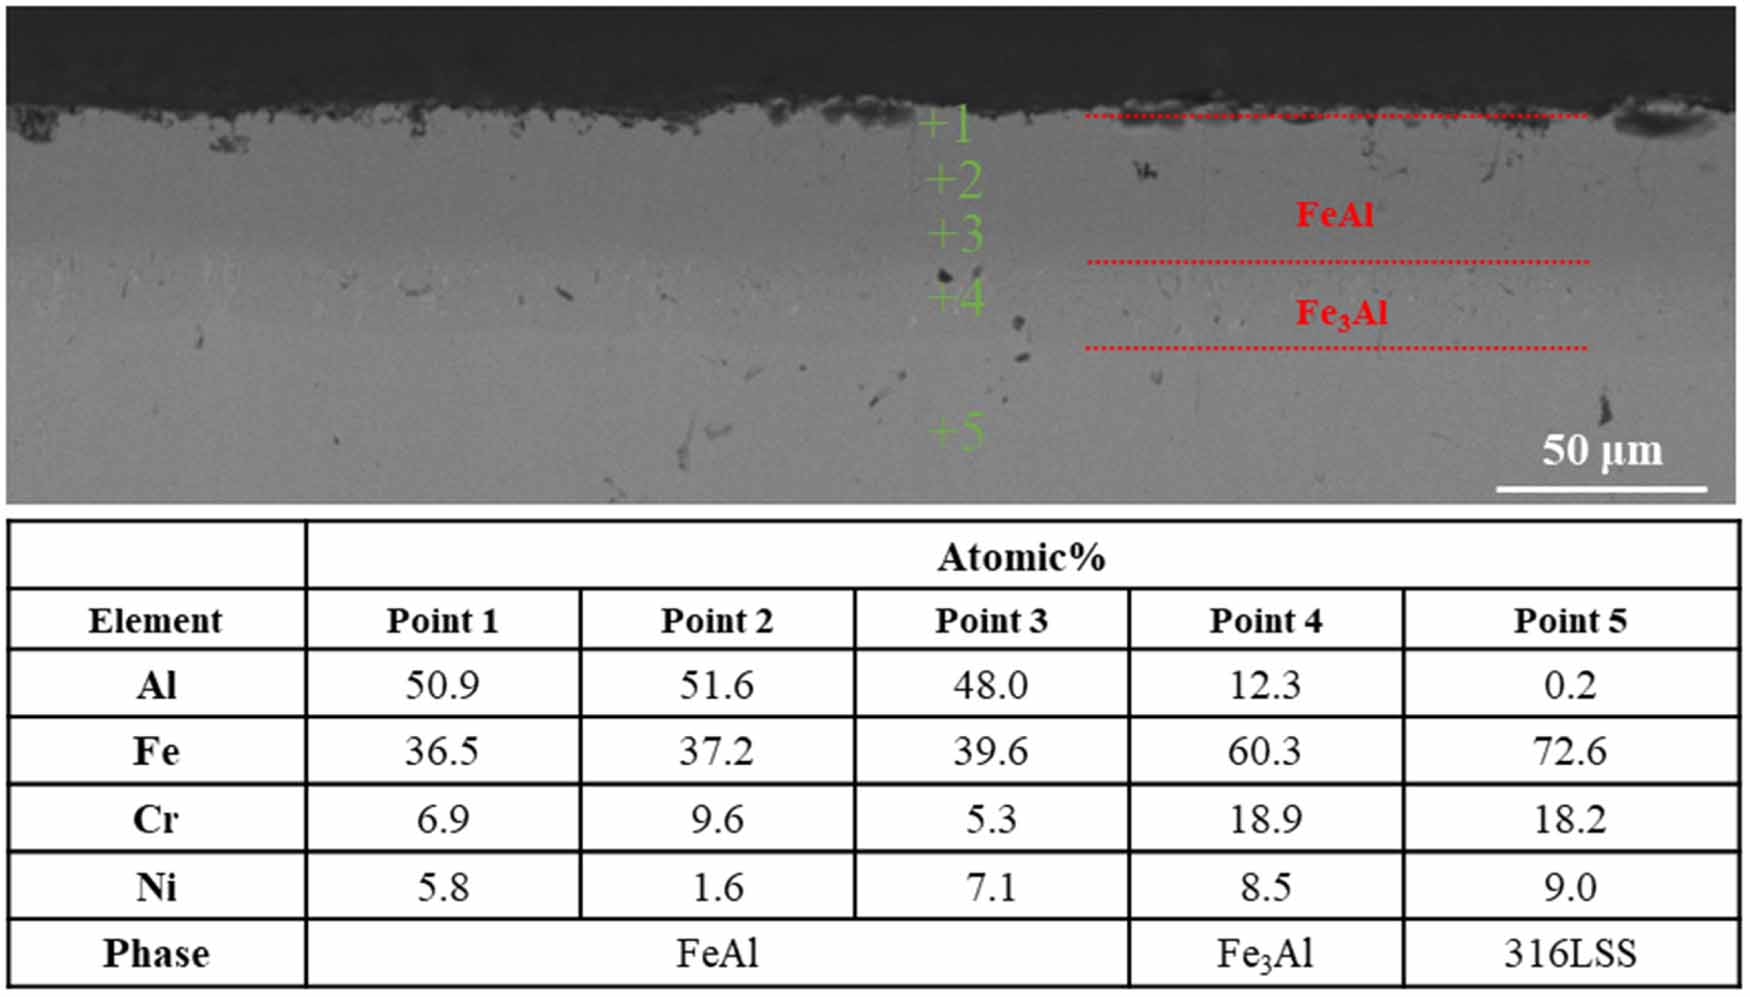
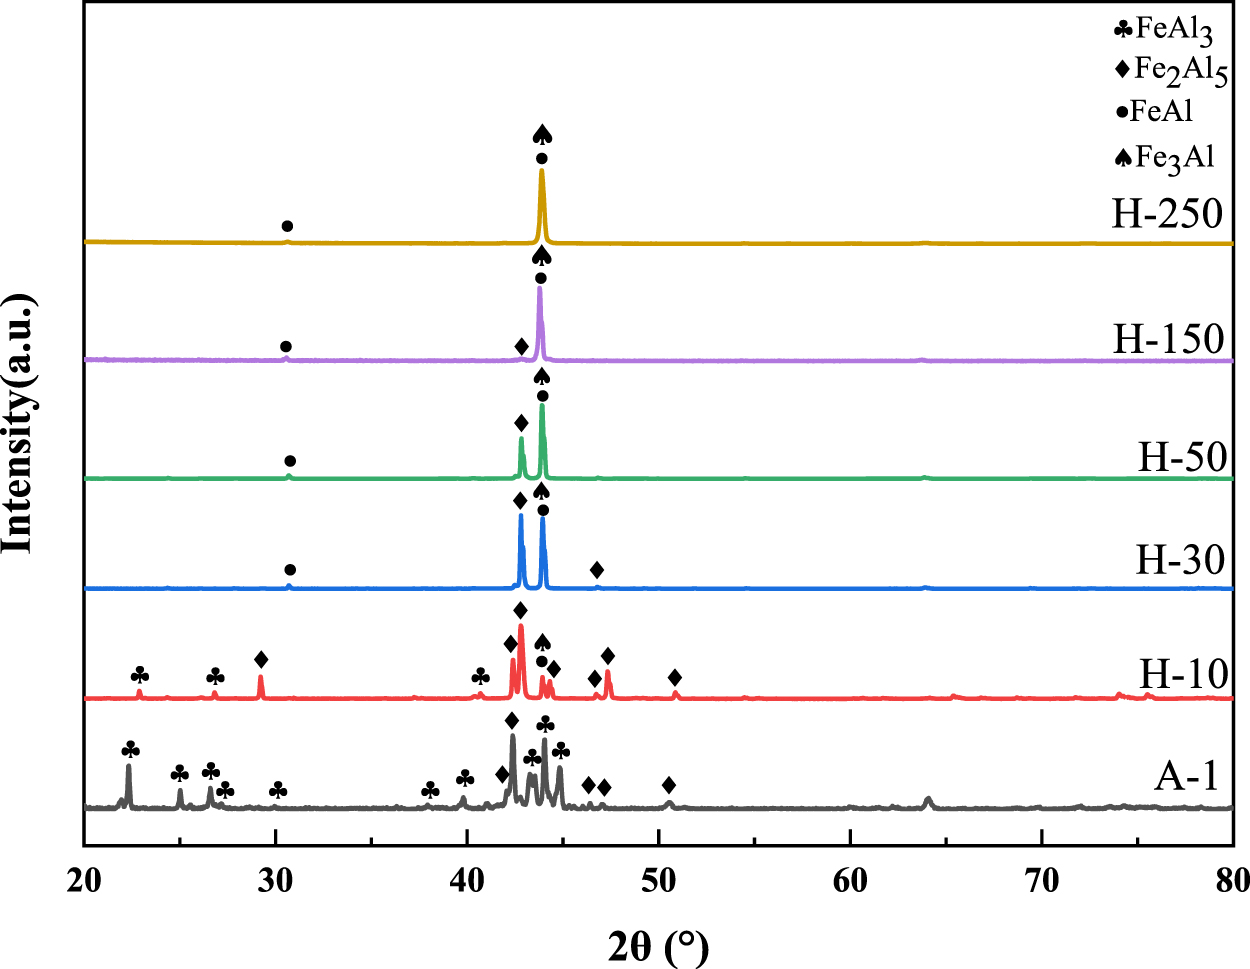
Figure 1 shows the cross-sectional morphology of A-1 samples after heat treatment for different time. Figure 2 shows the EDS results of the cross section of the sample aluminized at 650 °C for 2 h and heat treated at 700 °C for 50 h. As shown in figure 1(a), the phase of the aluminized layer of the aluminized sample without heat treatment is Fe2Al5 and FeAl3. As shown in figures 1(b)–(g), with the increase of heat treatment time, the Fe2Al5 and FeAl3 phase gradually change into FeAl phase, and the FeAl phase near the substrate changes into Fe3Al phase. The aluminized layer is divided into three regions, which are Fe2Al5 and FeAl phase coexistence region, FeAl phase region and Fe3Al phase region. As shown in figure 2, the black contrast phase in the coexistence region of Fe2Al5 and FeAl phase is Fe2Al5 (points 9, 10, 11, 12), and the white contrast phase is FeAl (points 4, 5, 6, 8). Point 1 is located in the Fe3Al phase region, and points 2 and 3 are located in the FeAl phase region. As shown in figure 1(h), the phase transformation is completed after heat treatment for 250 h, and the aluminized layer is composed of outer FeAl phase and inner Fe3Al phase. Figure 3 shows the EDS results of the cross section of the sample aluminized at 650 °C for 2 h and heat treated at 700 °C for 250 h. Points 1, 2, 3 are located in the FeAl phase region, point 4 is located in the Fe3Al phase region, and point 5 is located in the 316LSS substrate region. Figure 4 shows the XRD patterns of A-1 samples after heat treatment for different time. The phase of the coating of the A-1 sample without heat treatment is FeAl3 and Fe2Al5. When the heat treatment time reaches 30 h, the FeAl3 phase disappears, and the number of peaks of the Fe2Al5 phase is greatly reduced. The peak at 2θ=42.8° increases during the heat treatment process, reflecting the transformation of FeAl3 to Fe2Al5 phase. With the increase of heat treatment time, the peak of Fe2Al5 phase peak at 2θ = 42.8° gradually decreases until it disappears, and the peaks of FeAl phase and Fe3Al phase gradually increase, which indicates that Fe2Al5 with high Al content gradually transforms into FeAl and Fe3Al with low Al content during heat treatment, which is consistent with the characterization results of cross-section morphology. The heat treatment time required for the A-1 sample is 250 h.
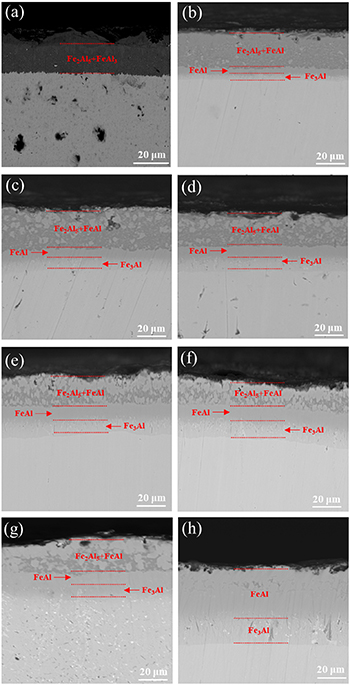
Figure 1. Cross-sectional morphology of the samples aluminized at 650 °C for 2 h after heat treatment for different time, (a) 0 h, (b) 10 h, (c) 30 h, (d) 50 h, (e) 80 h, (f) 100 h, (g) 150 h, (h) 250 h.
Download figure:
Standard image High-resolution image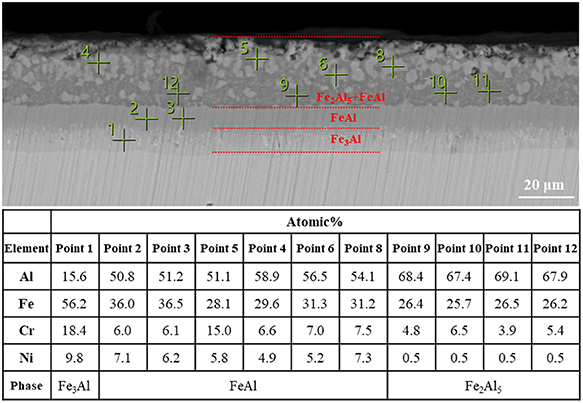
Figure 2. EDS results of the cross section of the sample aluminized at 650 °C for 2 h and heat treated at 700 °C for 50 h.
Download figure:
Standard image High-resolution image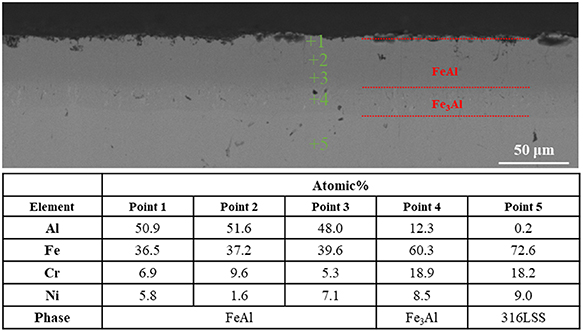
Figure 3. EDS results of the cross section of the sample aluminized at 650 °C for 2 h and heat treated at 700 °C for 250 h.
Download figure:
Standard image High-resolution image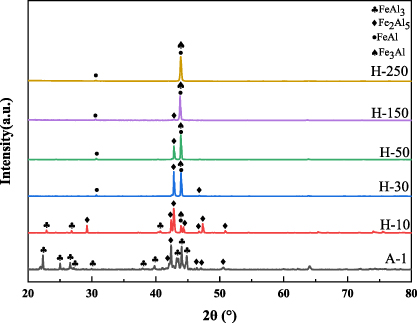
Figure 4. XRD patterns of the samples aluminized at 650 °C for 2 h after heat treatment for different time. The samples after heat treatment for 10 h and 30 h were named as H-10 and H-30 samples, respectively. The naming of samples with different heat treatment time follows the same format. The A-1 sample was not heat-treated.
Download figure:
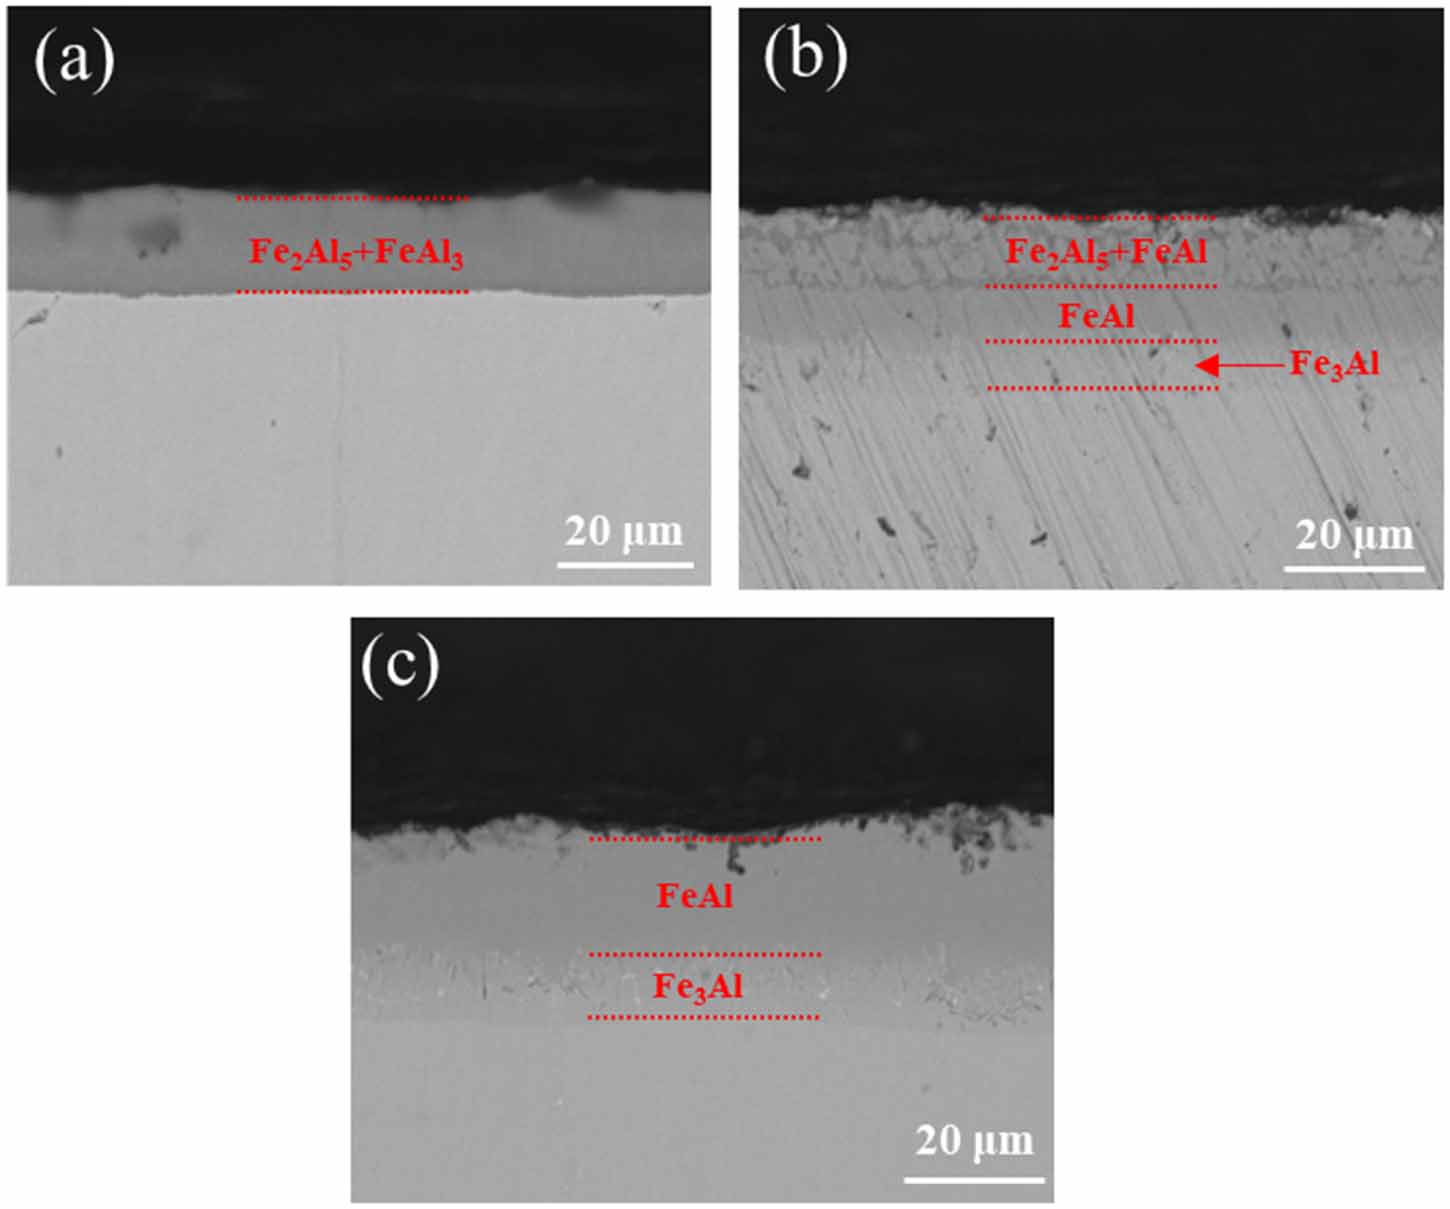
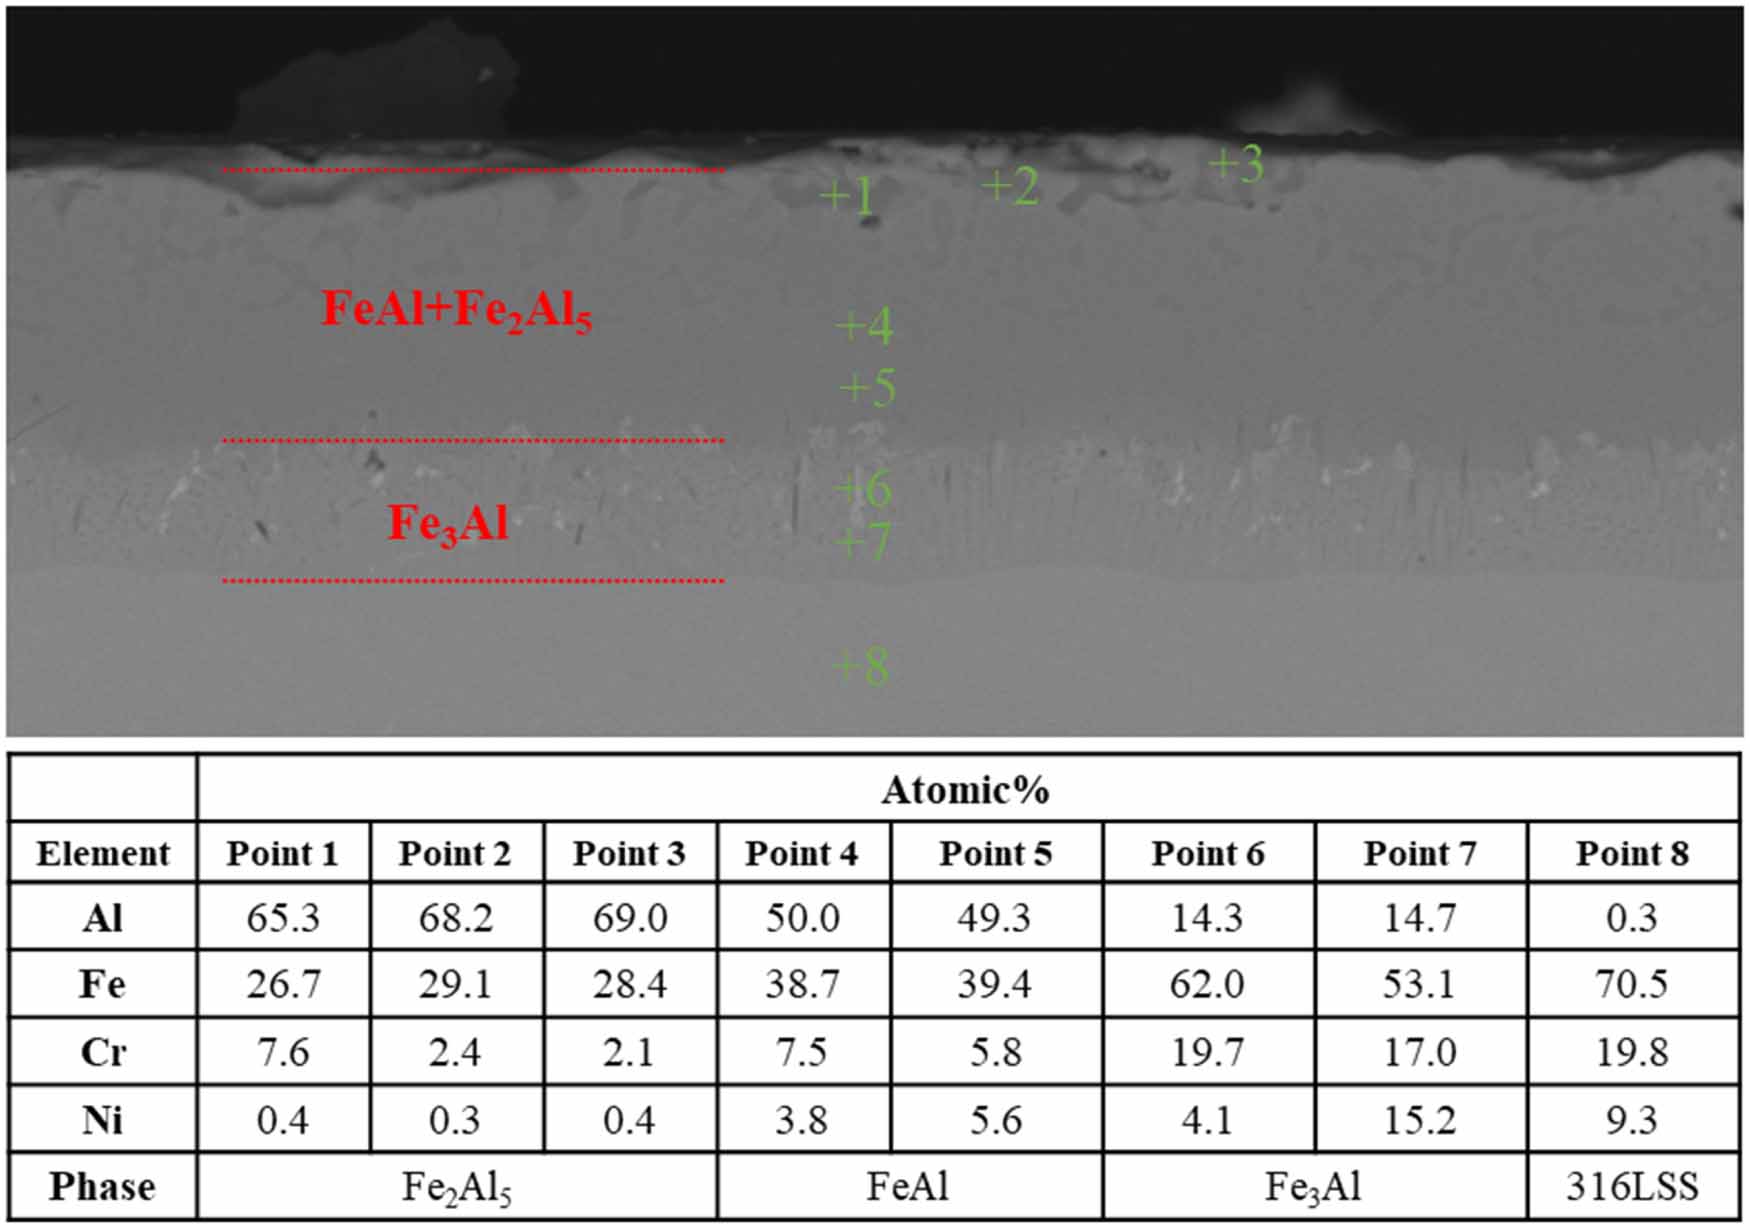
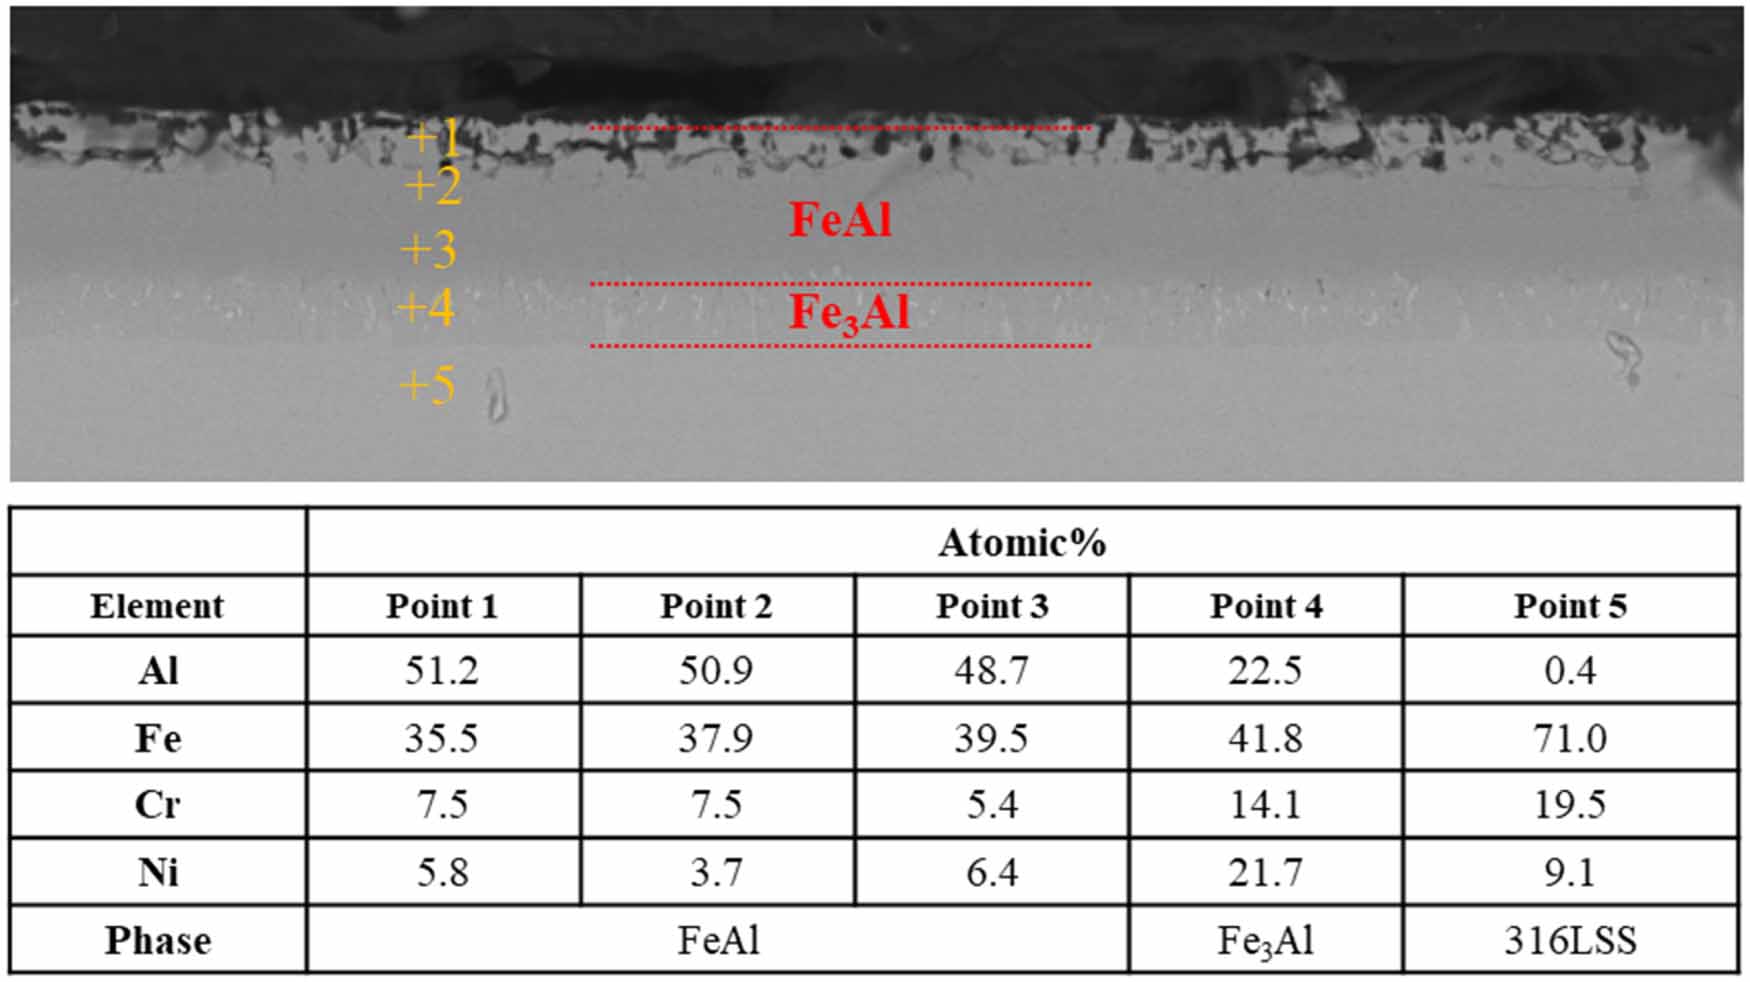
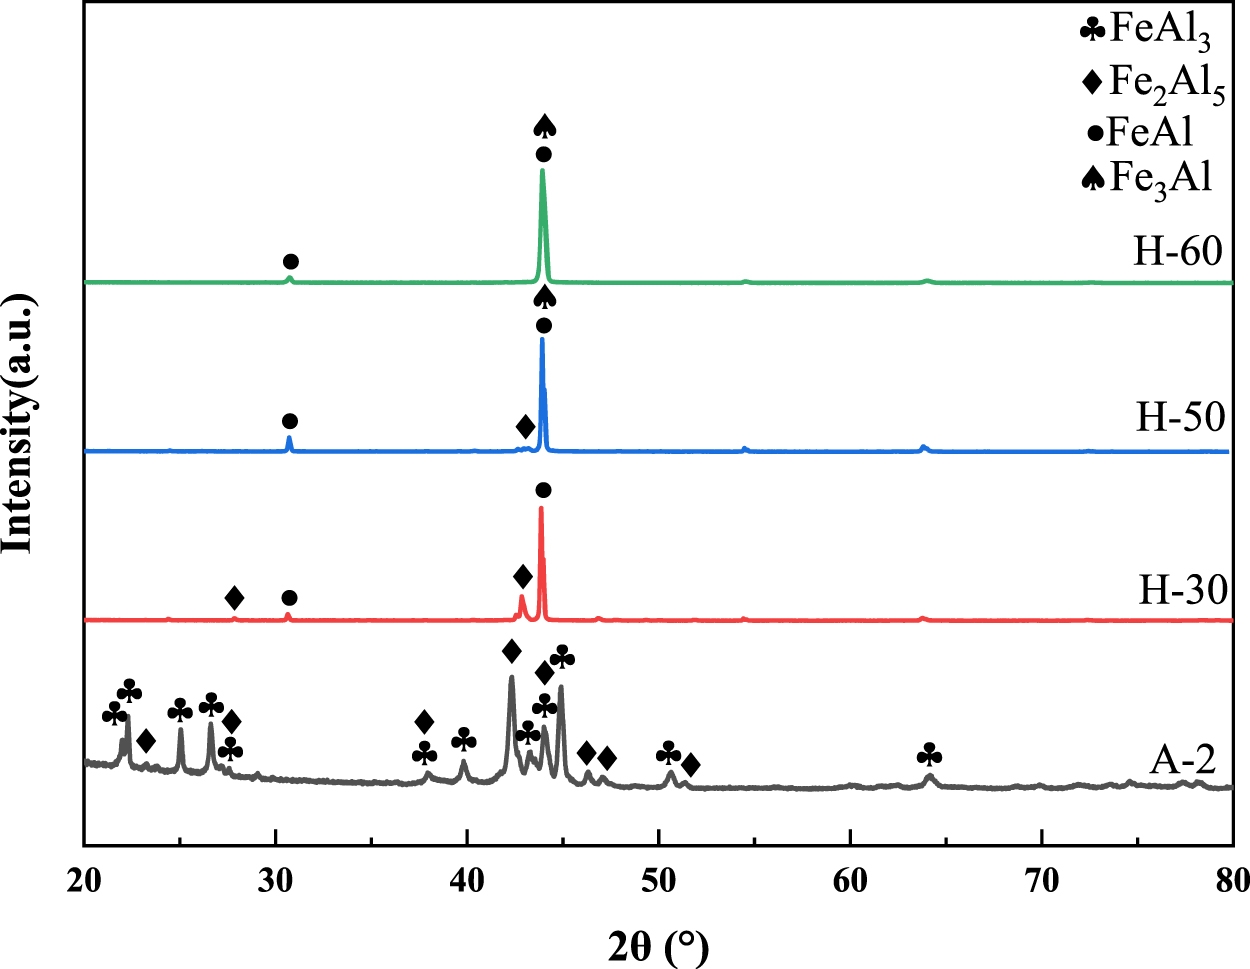
Standard image High-resolution imageFigure 5 shows the cross-sectional morphology of A-2 samples after heat treatment for different time. As shown in figure 5(a), the aluminized layer without heat treatment is Fe2Al5 phase and FeAl3 phase. As shown in figure 5(b), Fe2Al5 phase gradually transforms into FeAl phase and Fe3Al phase during heat treatment, and Fe2Al5 phase still exists after heat treatment for 30 h. Figure 6 shows the EDS results of the cross section of the sample aluminized at 600 °C for 2 h and heat treated at 700 °C for 30 h. Points 1, 2 and 3 are located in Fe2Al5 phase region, points 4 and 5 are located in FeAl phase region, points 6 and 7 are located in Fe3Al phases, and point 8 is located in the 316LSS substrate region. As shown in figure 5(c), the phase transformation is completed after heat treatment for 60 h, and the aluminized layer is composed of the outer FeAl phase and the inner Fe3Al phase. Figure 7 shows the EDS results of the cross section of the sample aluminized at 600 °C for 2 h and heat treated at 700 °C for 60 h. Points 1, 2, 3 are located in the FeAl phase region, point 4 is located in the Fe3Al phase region, and point 5 is located in the 316LSS matrix region. Figure 8 shows the XRD patterns of A-2 samples after heat treatment for different time. The phase of the coating of the A-2 sample without heat treatment is FeAl3 and Fe2Al5. With the increase of heat treatment time, the peaks of FeAl3 and Fe2Al5 gradually disappear, and the peaks of FeAl and Fe3Al phases increase, reflecting the process of phase transformation from high aluminum content to low aluminum content, which is consistent with the change of cross-sectional morphology. The heat treatment time required for A-2 sample to complete the phase transformation is 60 h, which is much less than that of A-1 sample.
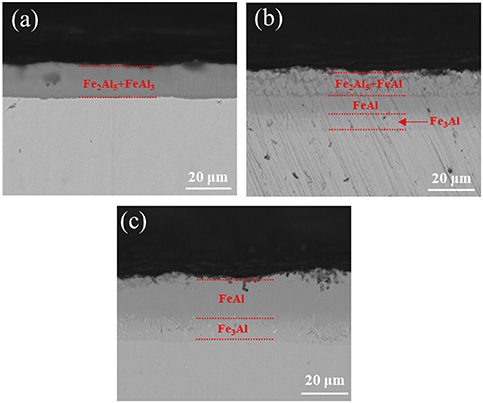
Figure 5. Cross-sectional morphology of the samples aluminized at 600 °C for 2 h after heat treatment for different time, (a) 0 h, (b) 30 h, (c) 60 h.
Download figure:
Standard image High-resolution image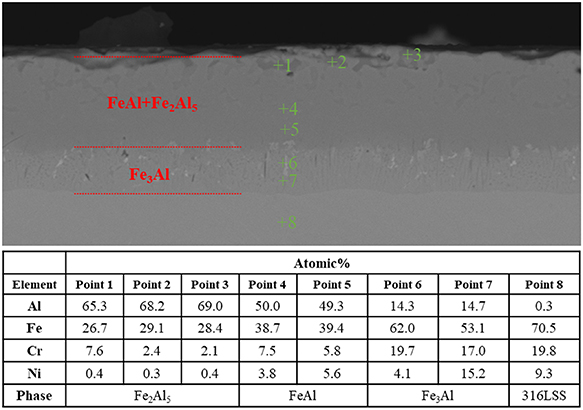
Figure 6. EDS results of the cross section of the sample aluminized at 600 °C for 2 h and heat treated at 700 °C for 30 h.
Download figure:
Standard image High-resolution image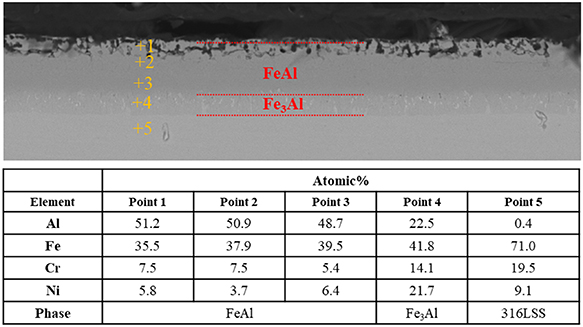
Figure 7. EDS results of the cross section of the sample aluminized at 600 °C for 2 h and heat treated at 700 °C for 60 h.
Download figure:
Standard image High-resolution image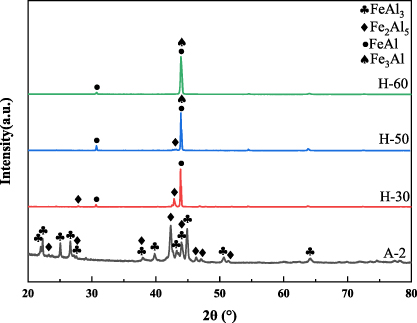
Figure 8. XRD patterns of the samples aluminized at 600 °C for 2 h after heat treatment for different time. The samples after heat treatment for 30 h, 50 h and 60 h were named as H-30, H-50 and H-60 samples, respectively. The A-2 sample was not heat-treated.
Download figure:
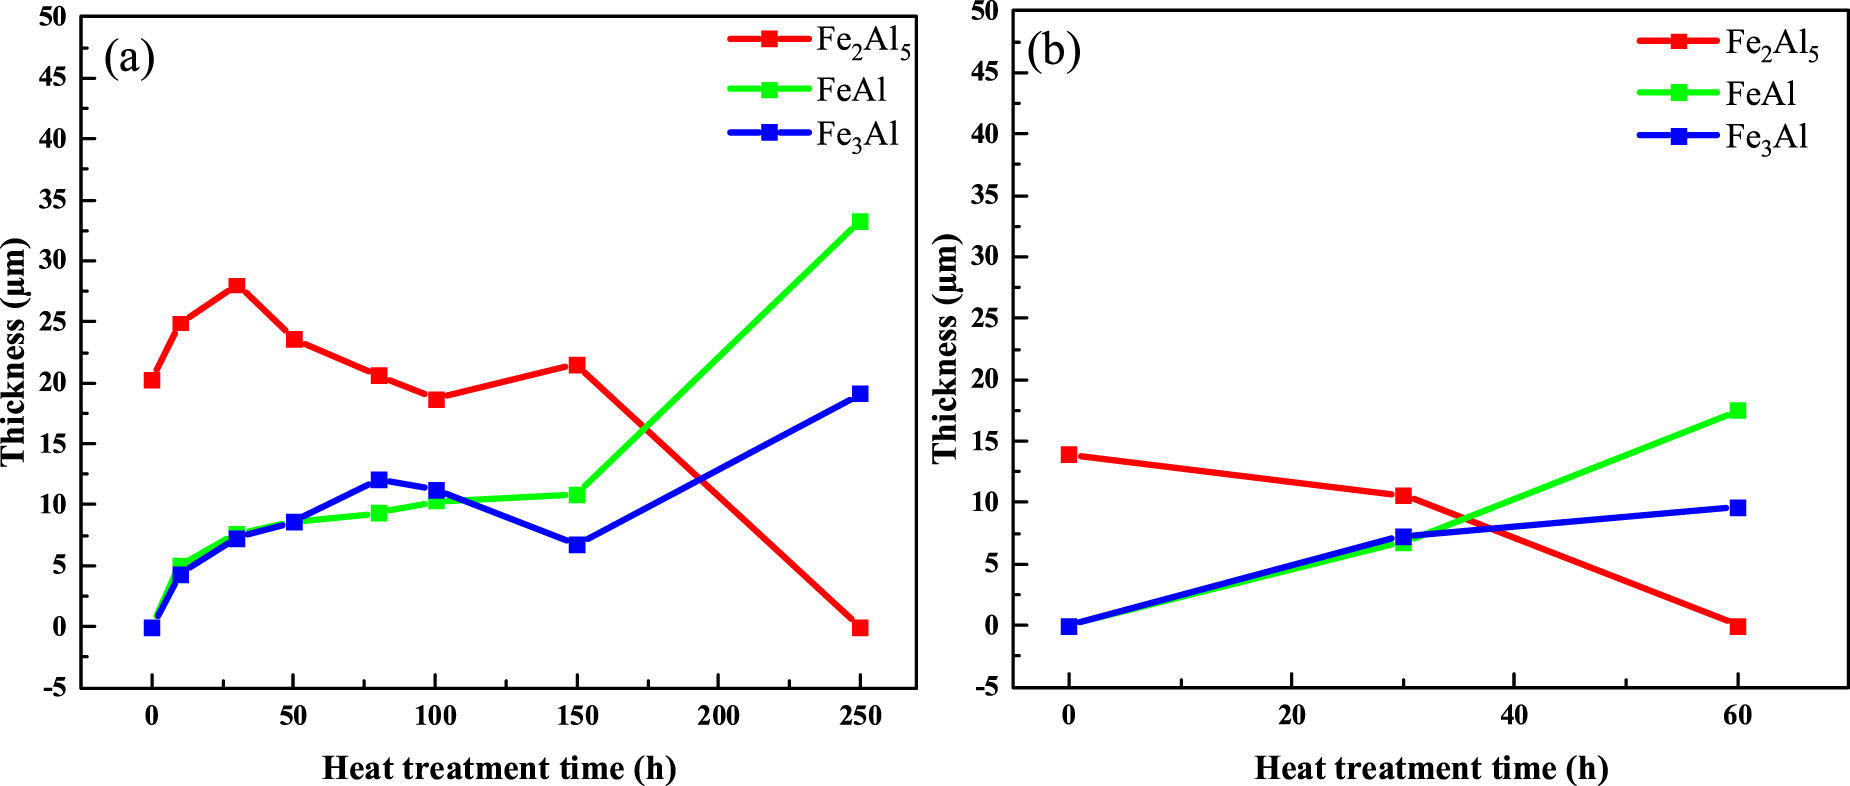
Standard image High-resolution imageFigure 9 shows the thickness change of each phase of the aluminized layer of A-1 samples and A-2 samples. As shown in figure 9(a), the thickness of Fe2Al5 phase increases first and then stabilizes, and finally decreases, while the thickness of FeAl phase and Fe3Al phase increases in A-1 samples. During the heat treatment process, Fe2Al5 is transformed into FeAl and Fe3Al, and the Al element in the aluminized layer diffuses into the 316LSS substrate, which increases the overall thickness of the aluminized layer. In the early stage of heat treatment, the aluminized layer is composed of phases with high aluminum content. The concentration gradient of Al element between the aluminized layer and the substrate is enormous, the diffusion rate of Al element into the substrate is high, and the thickness of the aluminized layer increases rapidly. With the increase of heat treatment time, most of the phases with high aluminum content in the aluminized layer were transformed into phases with low aluminum content. The Al element concentration gradient between the aluminized layer and the substrate decreases, the Al element diffusion rate decreases, and the aluminized layer thickness growth rate decreases. As shown in figure 9(b), the thickness of Fe2Al5 phase decreases, and the thickness of FeAl phase and Fe3Al phase increases in A-2 samples. The time of heat treatment to complete phase transformation is 60 h, which is much lower than that of A-1 sample. Compared with the A-1 samples, the A-2 samples prepared at a lower aluminizing temperature can significantly reduce the heat treatment time required to obtain the aluminized layer dominated by FeAl phase, which is more advantageous in the coating preparation process.
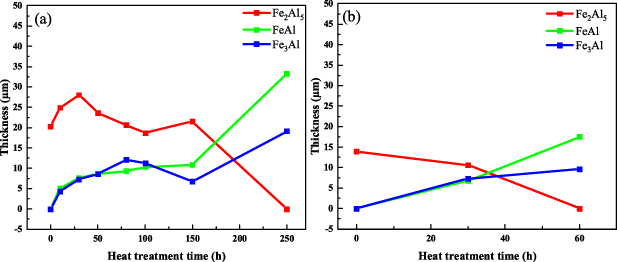
Figure 9. Thickness change of each phase of the aluminized layer of (a) the samples aluminized at 650 °C for 2 h, (b) the samples aluminized at 600 °C for 2 h.
Download figure:
Standard image High-resolution image3.2. Microstructure of oxidized samples
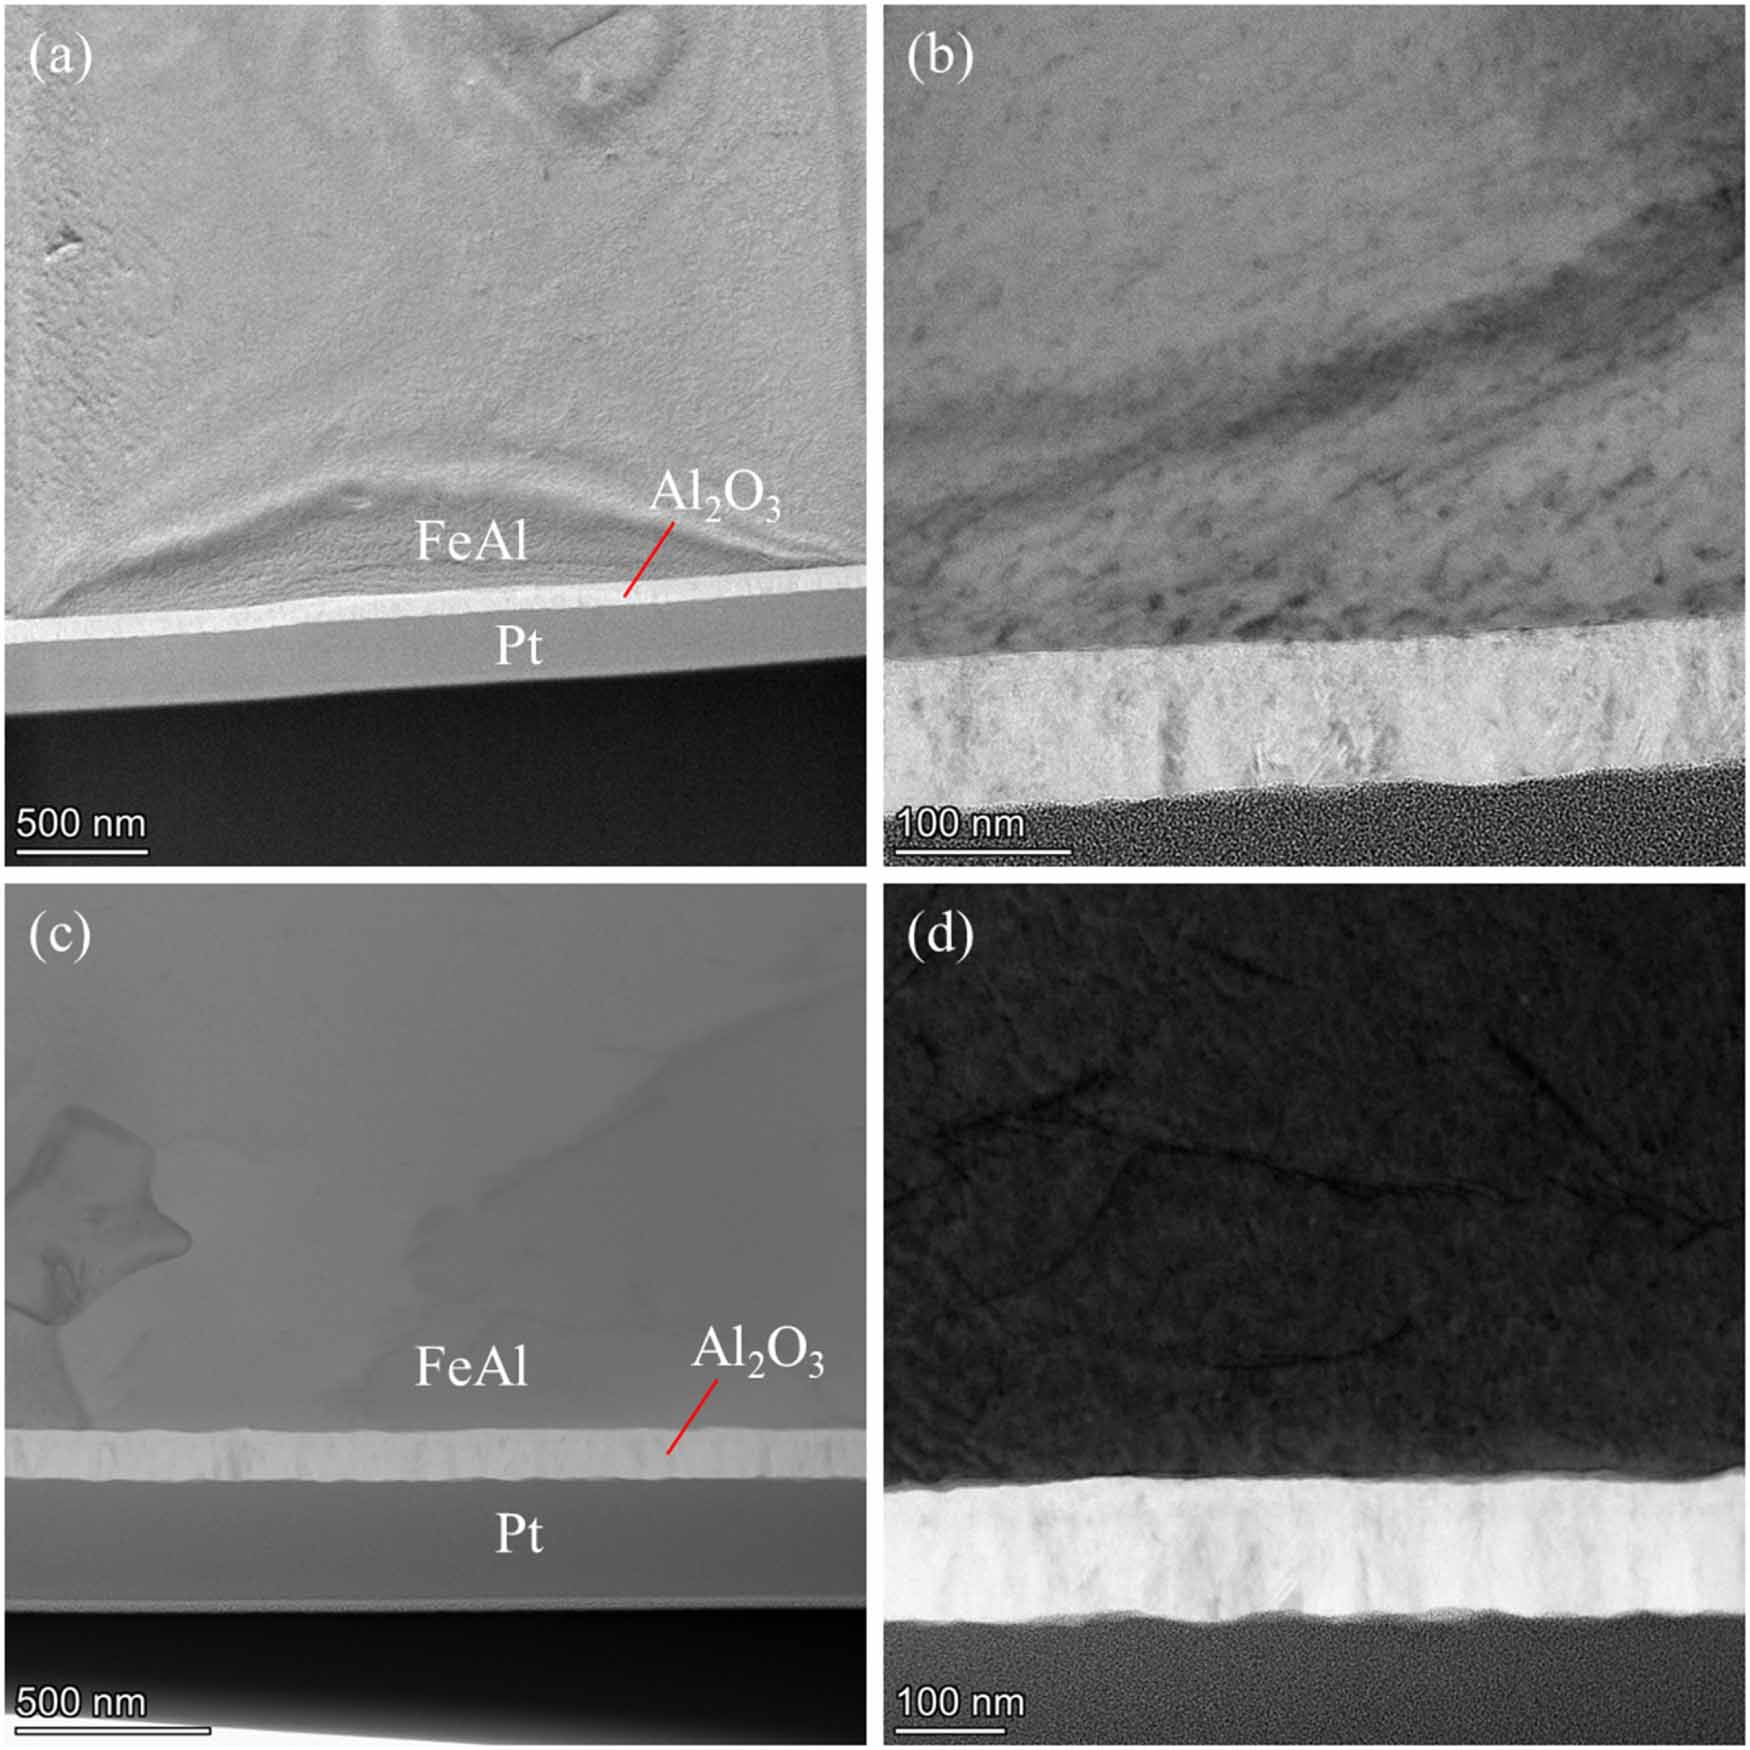
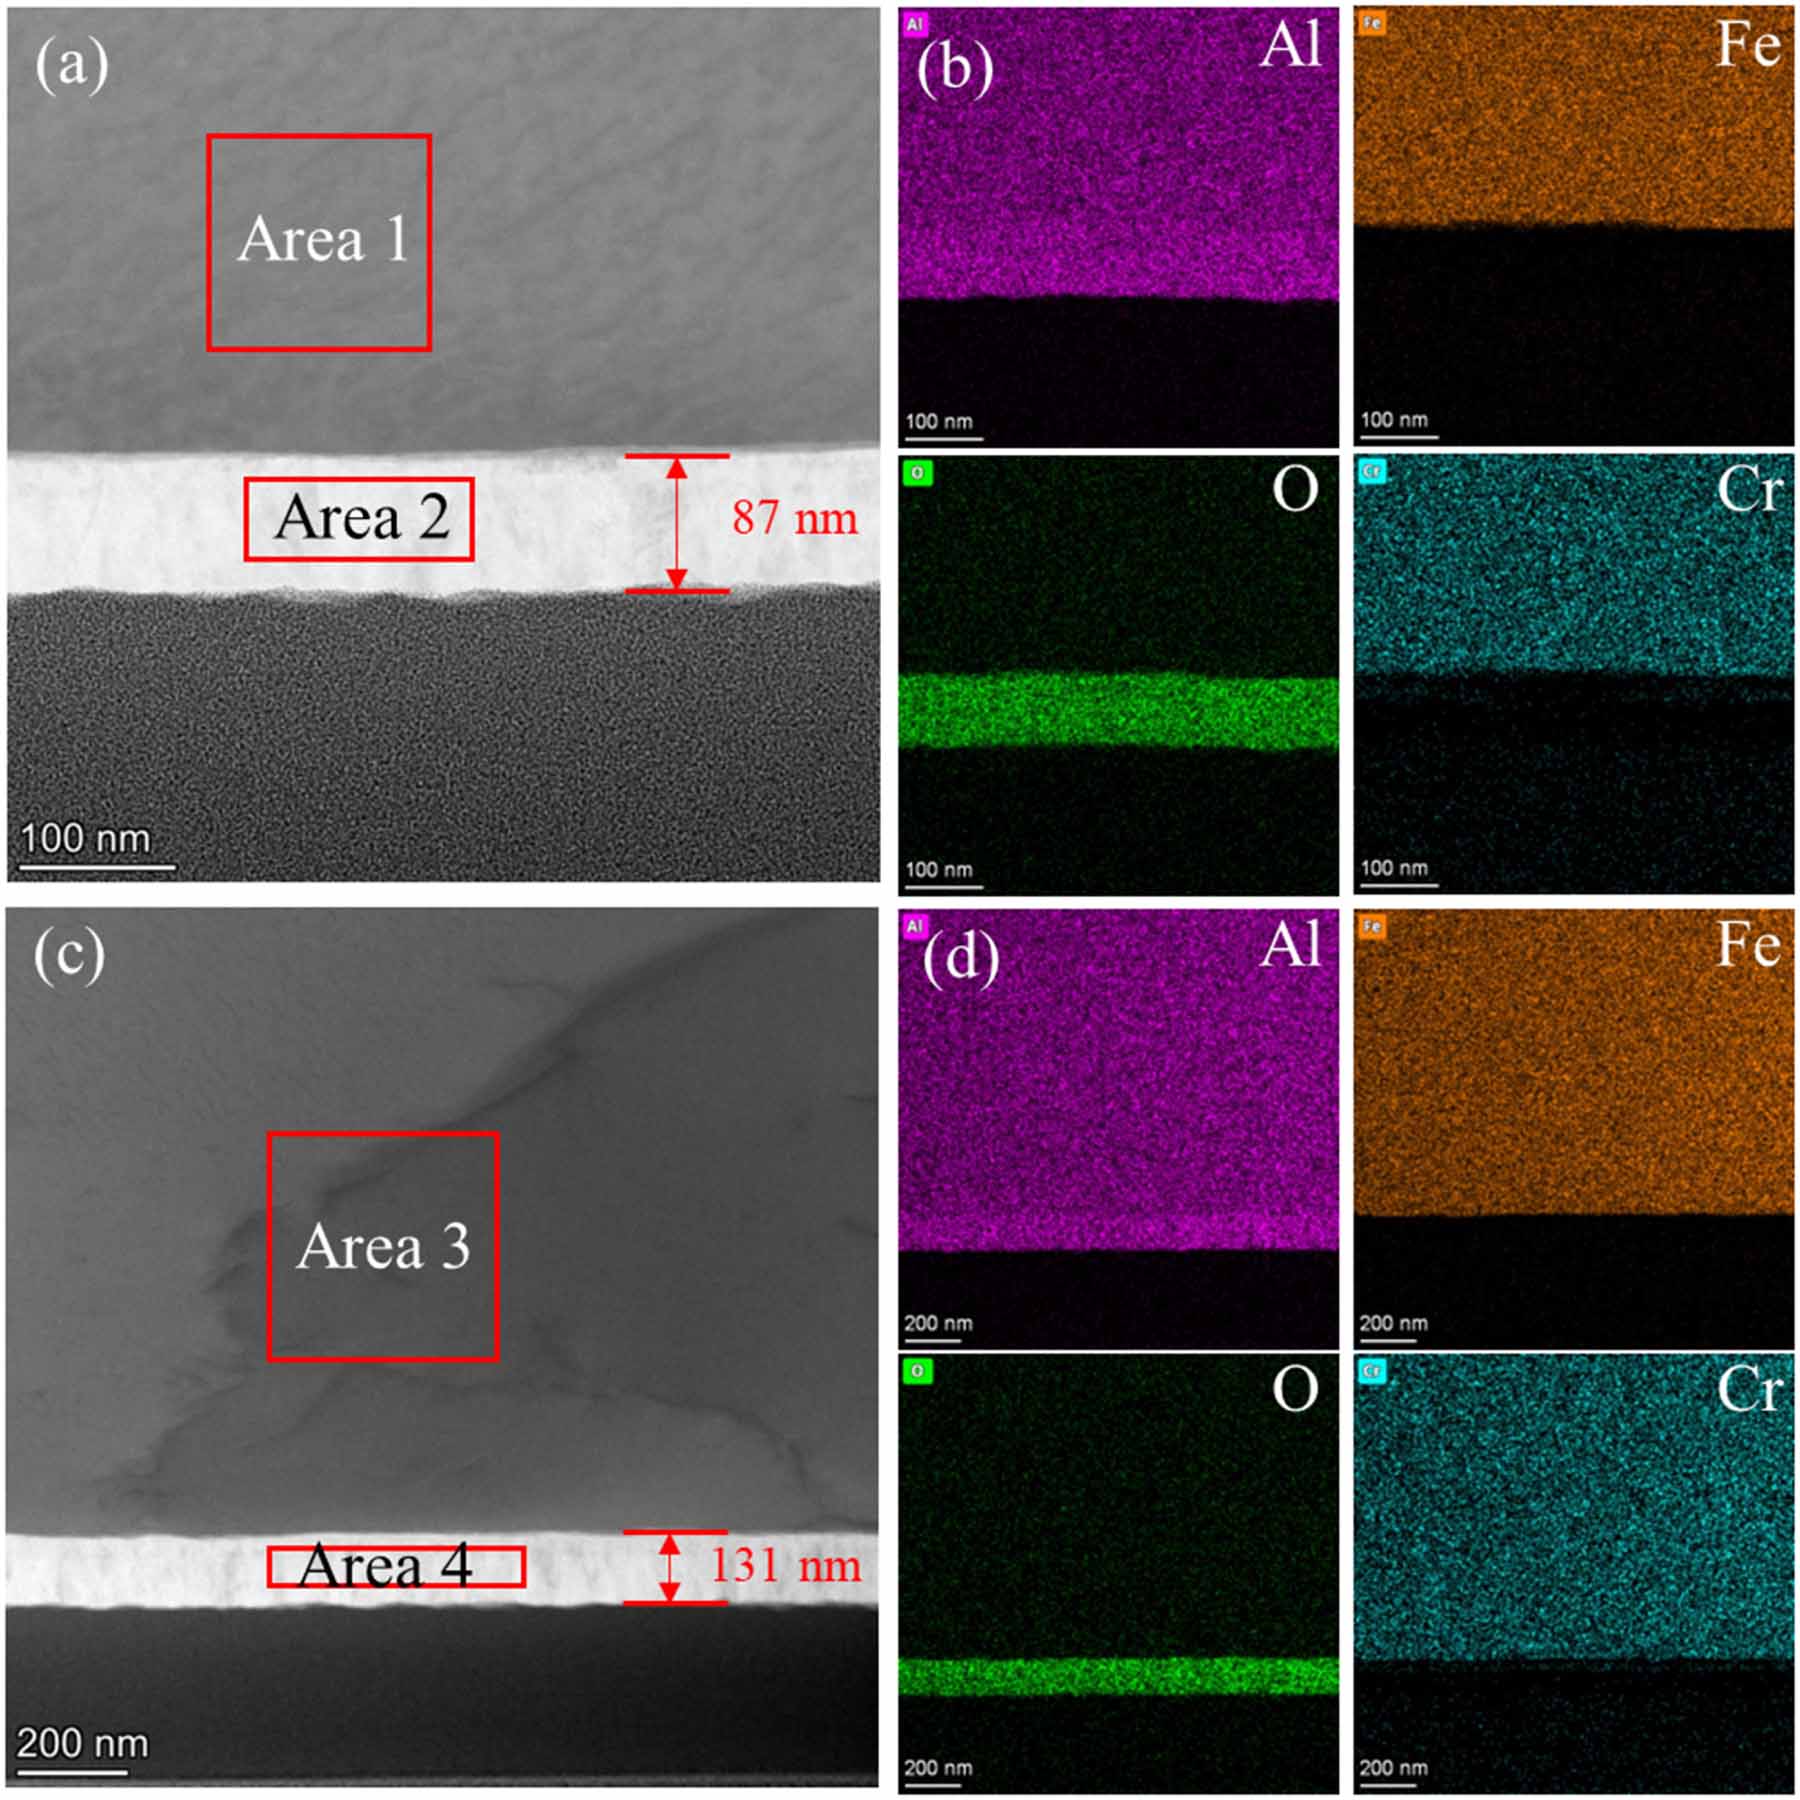
Figure 10 shows the TEM images of the cross section of A-2/H-60 samples after in-situ oxidation. The oxide layer is dense and uniform in thickness, which is closely combined with the aluminized layer without obvious defects. Figure 11 shows the EDS diagram of the cross section of the A-2/H-60 samples after in-situ oxidation. As shown in figures 11(a) and (c), the thickness of the oxide layer of the O-10 sample is 87 nm, and that of the O-24 sample is 131 nm. As shown in figures 11(b) and (d), the main elements in the oxide layer of the two samples are Al and O. As shown in table 2, the atomic ratio of Al to O in the oxide layer is close to 2:3, indicating that the oxide layer is pure Al2O3. In addition, the main elements of the aluminized layer of the two samples are Fe, Al and a small amount of Cr. The atomic ratio of Fe to Al is close to 1:1, which is consistent with the FeAl phase, indicating that the aluminized layer is still composed of FeAl phase after in-situ oxidation. The Cr content in the aluminized layer is about 7%–8%. During the preparation process, the Cr element in the 316LSS substrate diffuses into the aluminized layer. There is almost no Cr element in the oxide layer, indicating that the diffusion range of Cr element is limited to the aluminized layer. The diffusion of Cr element may be hindered by the Al2O3 layer. The average growth rates of the oxide layers of O-10 and O-24 samples are 8.7 nm h−1 and 5.5 nm h−1, respectively, which indicates that the growth rate of the oxide layer is not constant. As the oxidation time increases, the oxidation rate gradually slows down. With the increase of oxidation time, the oxidation rate gradually decreases.
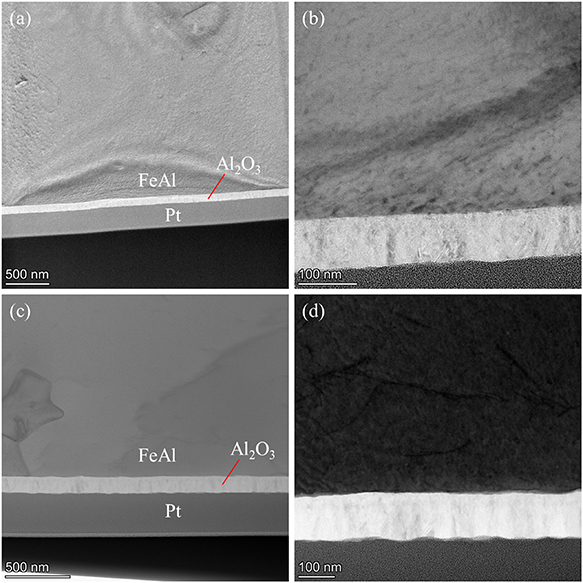
Figure 10. TEM images of the cross section of the samples prepared by oxidation of the samples aluminized at 600 °C for 2 h and heat treated at 700 °C for 60 h, (a), (b) the samples with oxidation time of 10 h, (c), (d) the samples with oxidation time of 24 h.
Download figure:
Standard image High-resolution image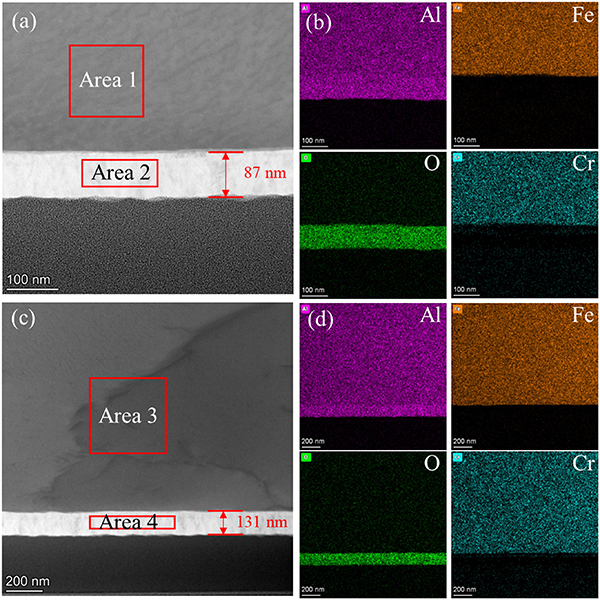
Figure 11. EDS diagram of the cross section of the samples prepared by oxidation of the samples aluminized at 600 °C for 2 h and heat treated at 700 °C for 60 h, (a), (b) the samples with oxidation time of 10 h, (c), (d) the samples with oxidation time of 24 h.
Download figure:
Standard image High-resolution imageTable 2. EDS surface scanning results of the cross section of the samples prepared by oxidation of the samples aluminized at 600 °C for 2 h and heat treated at 700 °C for 60 h.
| Atomic% | ||||
|---|---|---|---|---|
| Element | Area 1 | Area 3 | Area 2 | Area 4 |
| O | 5.8 | 3.7 | 61.1 | 59.9 |
| Al | 43.7 | 44.9 | 38.2 | 39.6 |
| Cr | 7.6 | 8.0 | 0.2 | 0.1 |
| Fe | 39.6 | 39.8 | 0.3 | 0.3 |
| Ni | 3.3 | 3.5 | 0.1 | 0.1 |
| Phase | FeAl | Al2O3 | ||
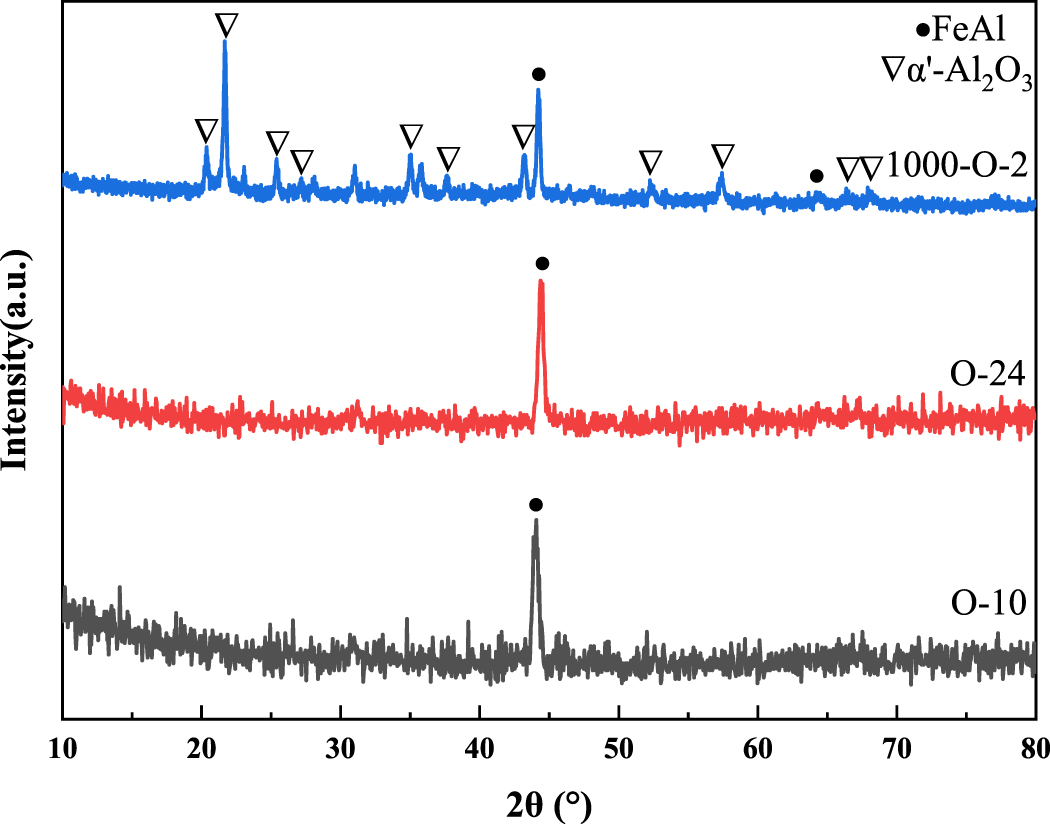
As shown in figure 12, FeAl phase was observed in the three oxidized samples, indicating that the aluminized layer was still composed of FeAl phase after in-situ oxidation, which was consistent with the characterization results of EDS. There are α′-Al2O3 phase (PDF #50-1496 [58]) and FeAl phase in the 1000-O-2 sample, while only FeAl phase can be observed in the O-10 and O-24 samples. The oxidation temperature of the 1000-O-2 sample is high (1000 °C), the growth rate of the oxide layer is high. Therefore, the oxide layer of the 1000-O-2 sample is thick enough to be observed by grazing incidence XRD (GIXRD). Although O-10 and O-24 samples were oxidized for a longer time, the lower oxidation temperature (700 °C) resulted in a lower growth rate of the oxide layer. As shown in figures 11(a) and (c), the oxide layers of the two samples were only 87 nm and 131 nm, which makes it easy for x-ray to penetrate the entire oxide layer and the phase information of the oxide layer cannot be obtained.
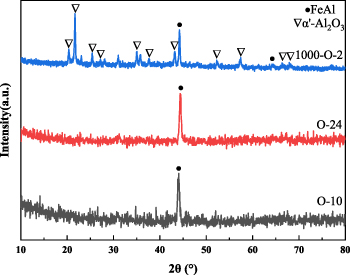
Figure 12. Grazing incidence XRD patterns of different oxidized samples, the incident angle is 0.5°. The 1000-O-2 sample was prepared by oxidation of the samples aluminized at 650 °C for 2 h and heat treated at 700 °C for 250 h. The oxidation time of the 1000-O-2 sample was 2 h. The O-10 and O-24 sample were prepared by oxidation of the samples aluminized at 600 °C for 2 h and heat treated at 700 °C for 60 h. The oxidation time of the O-10 and O-24 sample was 10 h and 24 h, respectively.
Download figure:
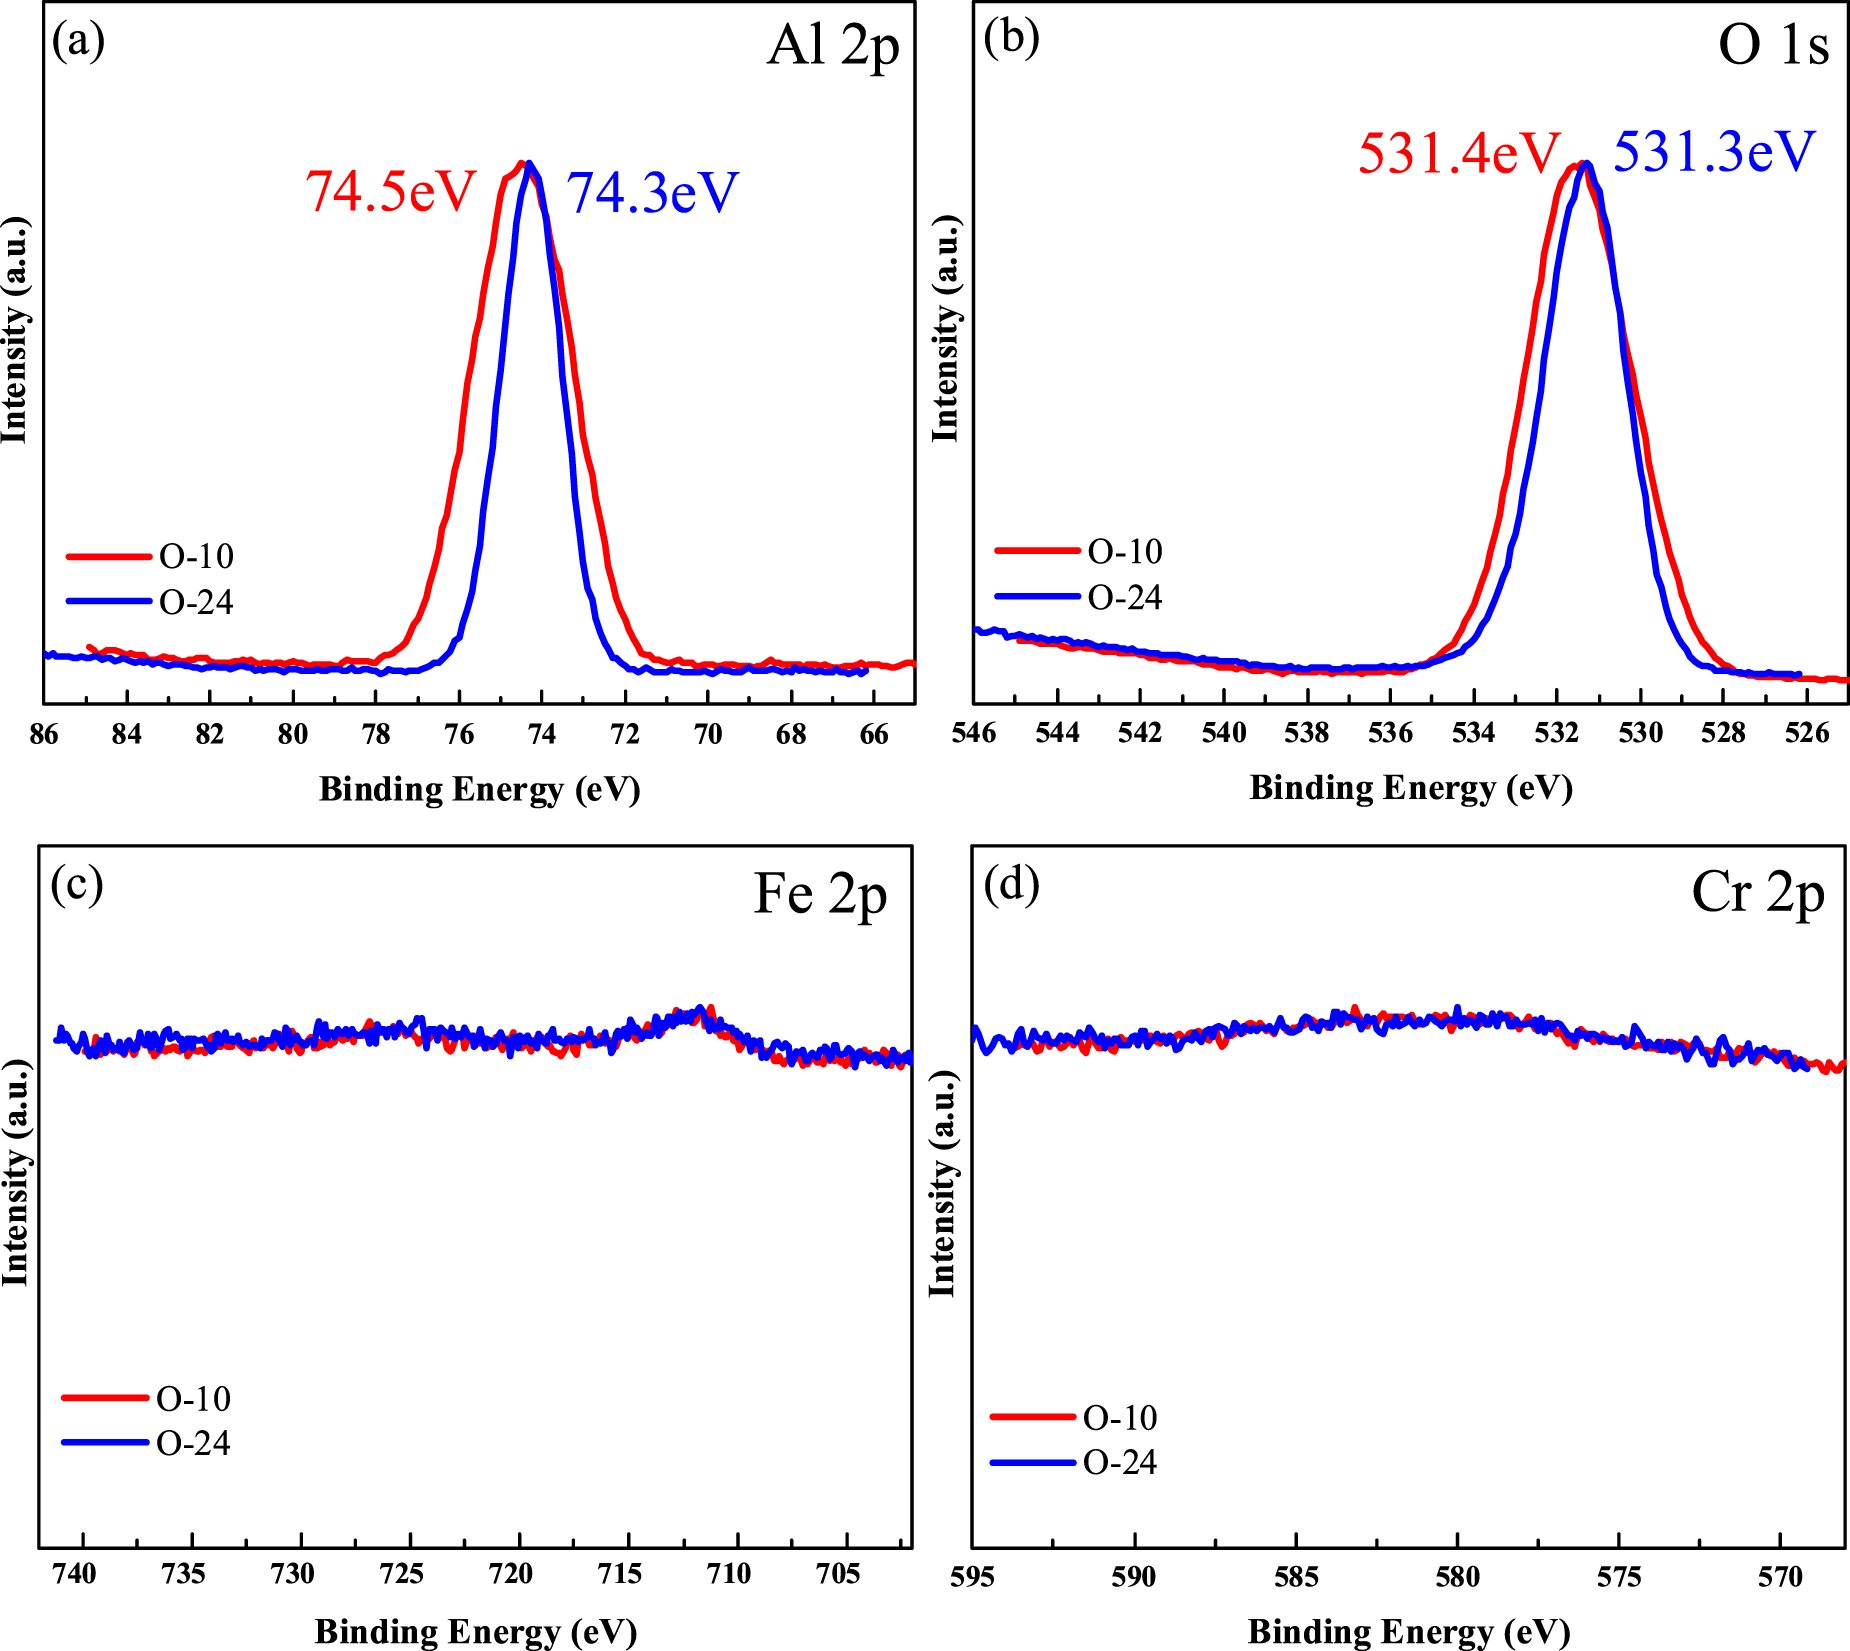
Standard image High-resolution imageAs shown in figures 13(a) and (b), the binding energies of the Al 2p peaks of the two oxidized samples are 74.5 eV and 74.3 eV, respectively, and the binding energies of the O 1 s peaks are 531.4 eV and 531.3 eV, respectively, which are consistent with the binding energies of Al3+ and O2− in Al2O3, indicating the presence of Al2O3 phase in the two oxidized samples. In addition, as shown in figures 13(c) and (d), the Fe 2p and Cr 2p peaks are hardly observed, indicating that there are no oxides of Fe and Cr, and the oxide layer is pure Al2O3 phase. The aluminized layer is selectively oxidized to form Al2O3.
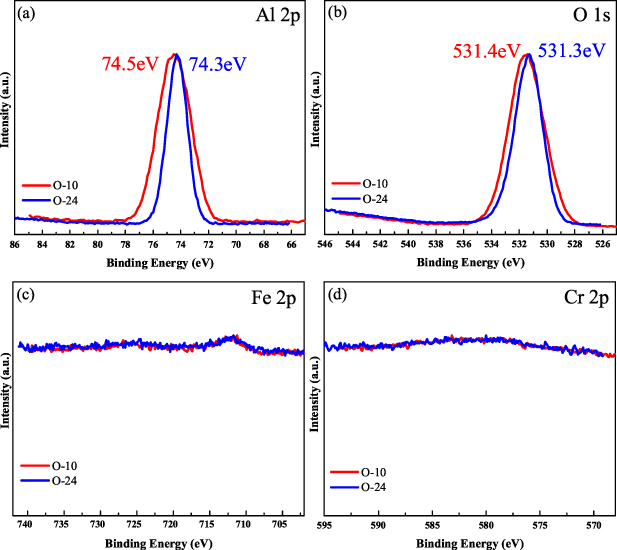
Figure 13. XPS spectra of the samples prepared by oxidation of the samples aluminized at 600 °C for 2 h and heat treated at 700 °C for 60 h. The oxidation time of the O-10 and O-24 sample was 10 h and 24 h, respectively.
Download figure:
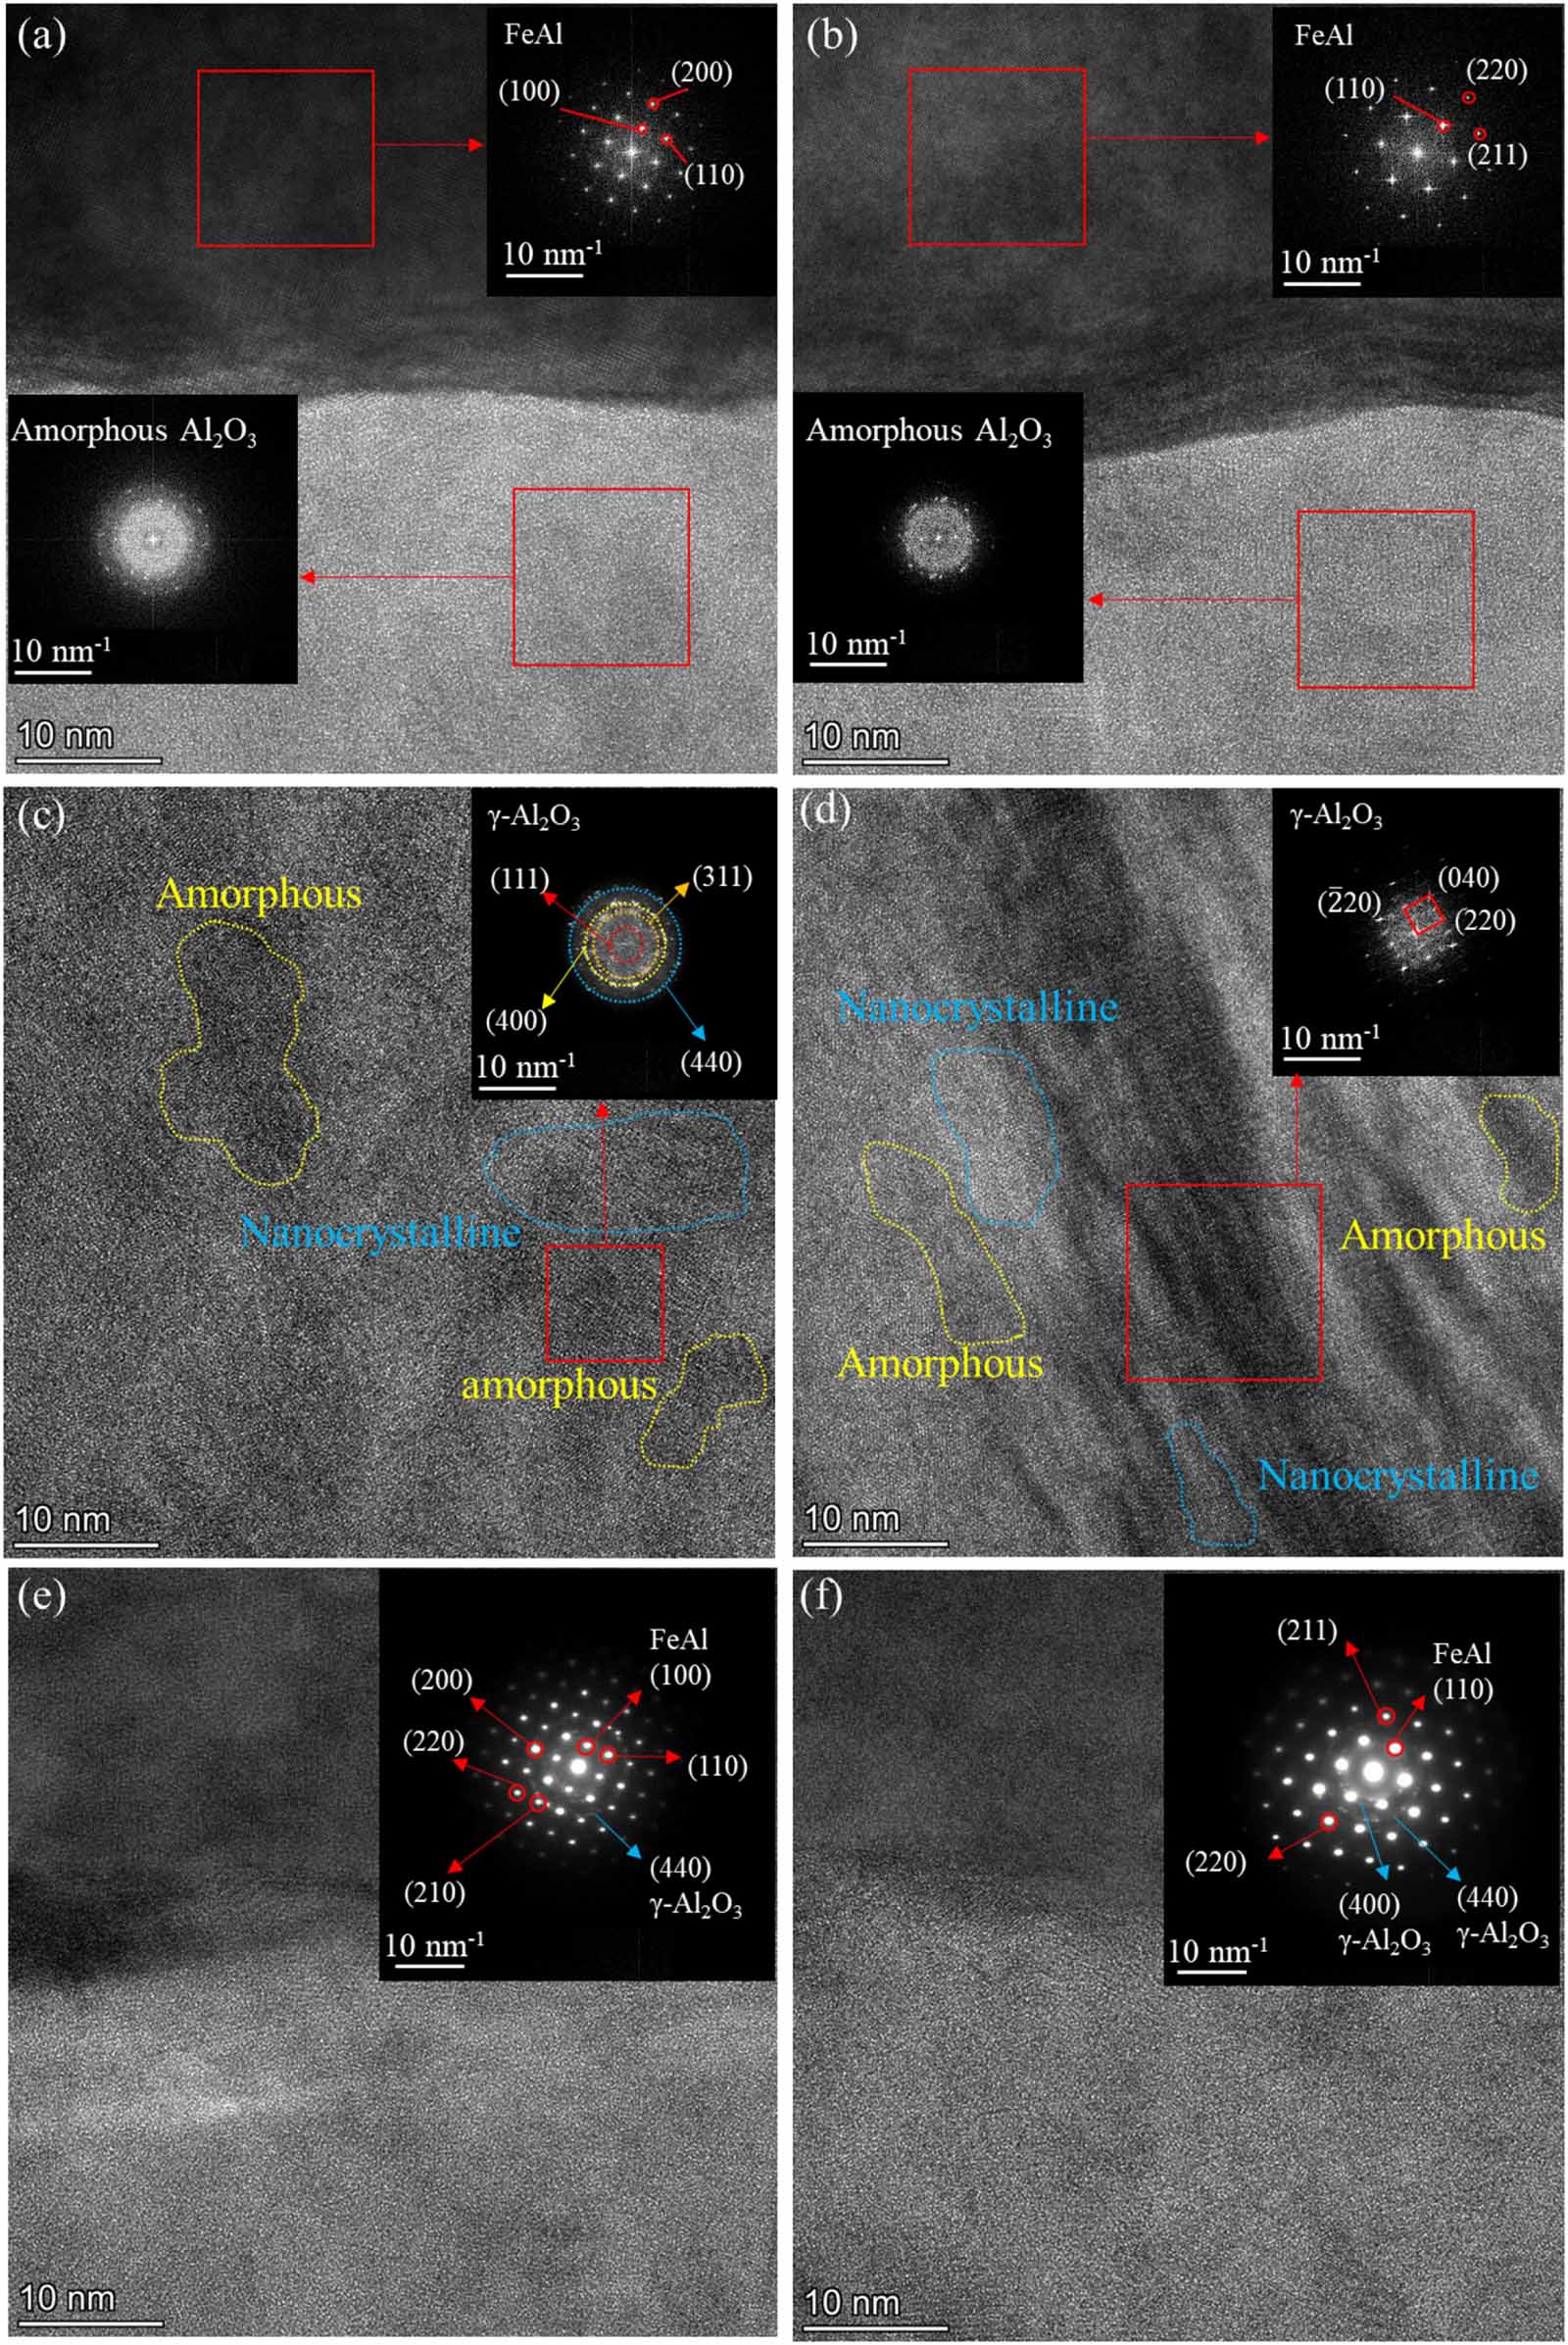
Standard image High-resolution imageFigure 14 shows the cross-sectional TEM images, fast Fourier transform (FFT) and selected area electron diffraction (SAED) images of the A-2/H-60 sample after in-situ oxidation. As shown in figures 14(a) and (b), the diffraction spots in the FFT image of aluminized layer area correspond to the {110}, {100}, {200} and {211} crystal planes of FeAl phase, indicating that the aluminized layer is still composed of FeAl phase after in-situ oxidation. As shown in figures 14(c) and (d), the diffraction rings in the FFT image of oxide layer correspond to the {111}, {311}, {400}, {440}, {220}, {040} and { } crystal planes of the cubic γ-Al2O3 (PDF #10-0425), indicating that γ-Al2O3 is polycrystalline. There are many amorphous Al2O3 and nanocrystalline structures in the oxide layer. In the SAED diagram shown in figures 14(e) and (f), the {110}, {100} and {200} crystal planes of FeAl phase, the {440} and {400} planes of γ-Al2O3 polycrystalline ring, and the amorphous Al2O3 structure are observed. The oxide layer shows the structure of polycrystalline γ-Al2O3 mixed with amorphous Al2O3, which is related to the oxidation temperature. The γ-Al2O3 phase is converted into δ-Al2O3 phase at 700 °C–800 °C [59]. However, the oxidation temperature in this paper is 700 °C, which makes it difficult for γ-Al2O3 phase to be converted into δ-Al2O3 phase.
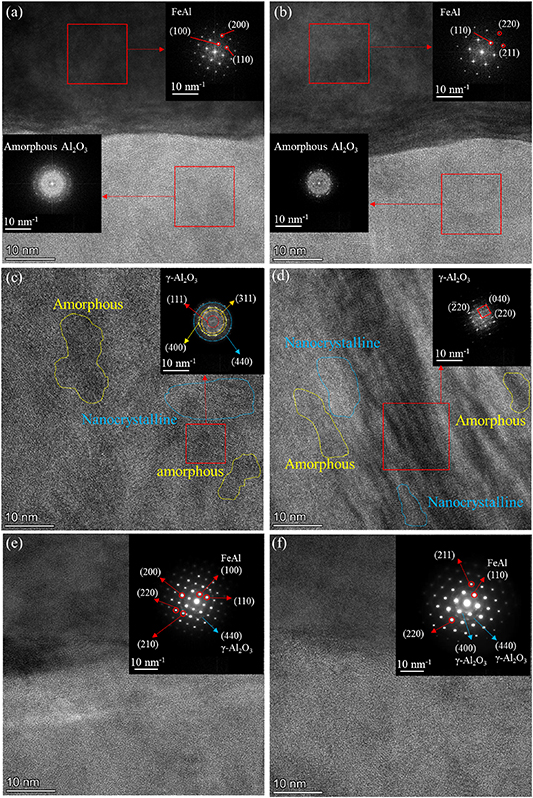
Figure 14. Cross-sectional TEM images, FFT and SAED images of the samples prepared by oxidation of the samples aluminized at 600 °C for 2 h and heat treated at 700 °C for 60 h, (a), (c), (e) the samples with oxidation time of 10 h, (b), (d), (f) the samples with oxidation time of 24 h.
Download figure:
Standard image High-resolution image3.3. Deuterium permeation experiment
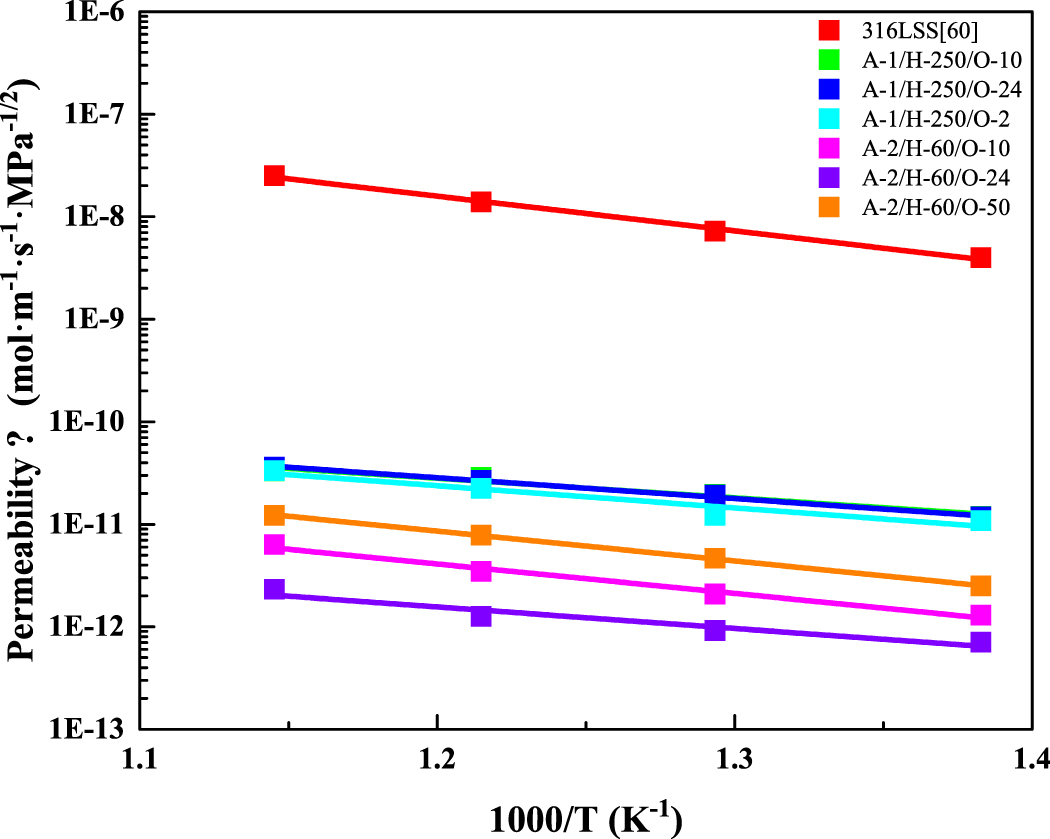
Figure 15 shows the deuterium permeability of Fe–Al/Al2O3 composite coating samples with different preparation processes. The 1000-O-2 sample was oxidized at 1000 °C, and the remaining samples were oxidized at 700 °C. The deuterium permeability of 316LSS is given in [60]. Table 3 shows the deuterium permeation activation energy of Fe–Al/Al2O3 composite coating samples prepared by different processes. The deuterium permeation activation energy of the composite coating samples is lower than that of the 316LSS substrate. With the increase of temperature, the deuterium permeability of 316LSS substrate increases significantly, and that of composite coating samples increases slightly, which indicates that the composite coating possesses more significant deuterium permeation resistance at high temperature. The A-2/H-60/O-24 sample possesses the lowest activation energy of deuterium permeation, which is 40.2 kJ mol−1. The change of deuterium permeability with temperature is the smallest, which reflects the excellent high temperature resistance of the coating.
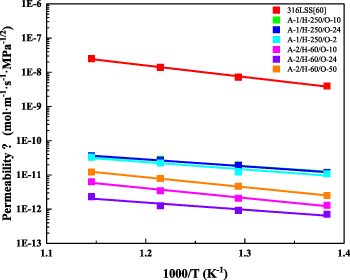
Figure 15. Deuterium permeability of Fe–Al/Al2O3 composite coating samples with different preparation processes [60].
Download figure:
Standard image High-resolution imageTable 3. Deuterium permeation activation energy of Fe–Al/Al2O3 composite coating samples prepared by different processes.
| Samples | Oxidation parameters | Activation energy for deuterium permeation (kJ mol−1) |
|---|---|---|
| 316LSS | / | 64.7 |
| A-1/H-250 | O-10 | 47.0 |
| O-24 | 50.0 | |
| 1000-O-2 | 53.2 | |
| A-2/H-60 | O-10 | 55.0 |
| O-24 | 40.2 | |
| O-50 | 55.6 | |
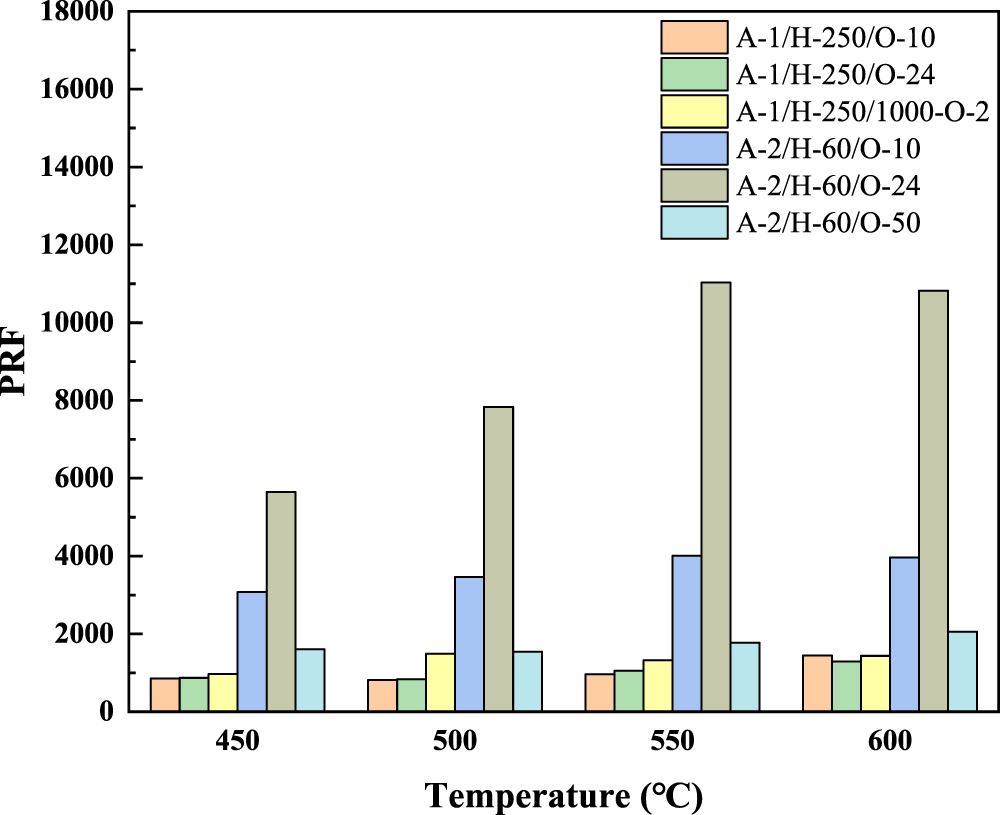
Figure 16 compares the PRF at different temperatures. The PRF of the oxidized samples prepared by A-2/H-60 sample is higher than that of the oxidized samples prepared by A-1/H250 sample. The PRF of many composite coating samples increases with the increase of temperature. Among them, the O-10 and O-24 samples prepared by the A-2/H-60 sample exhibited the best deuterium permeation resistance, and the PRF exceeded 3000.
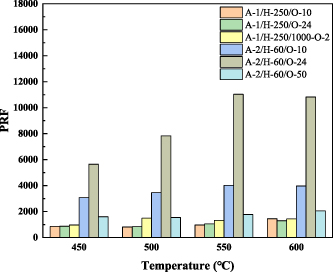
Figure 16. Comparison of deuterium permeation reduction factor at different temperatures.
Download figure:
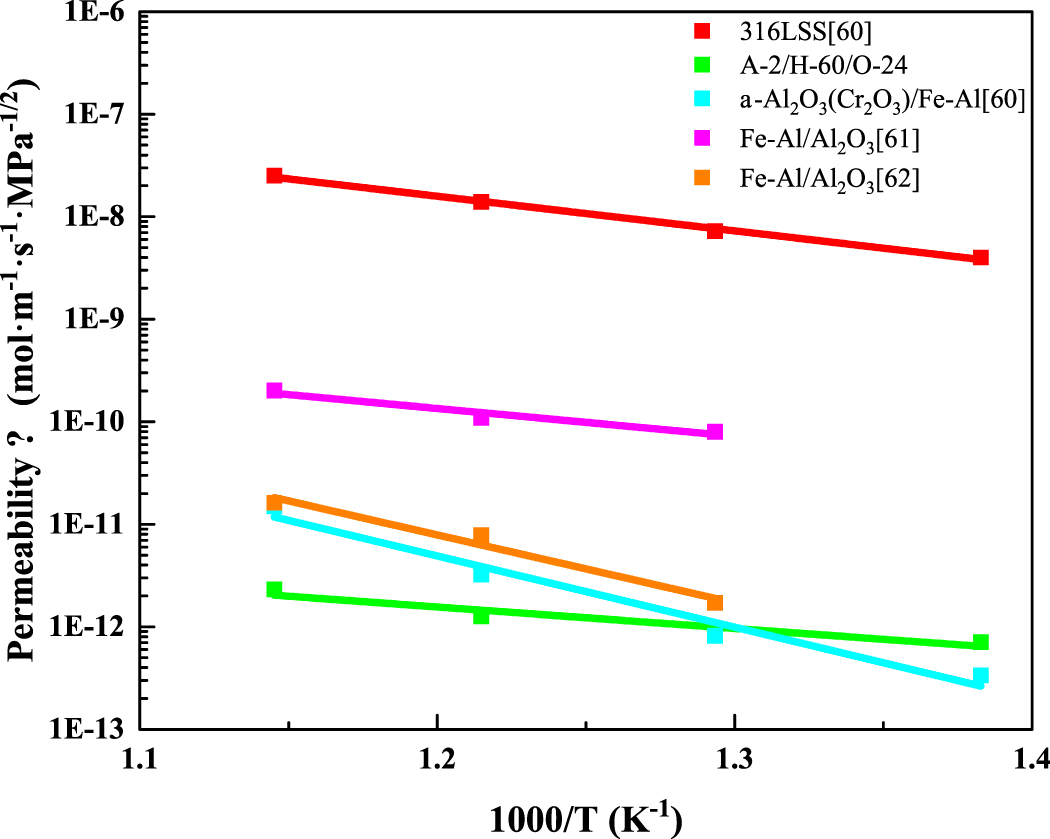
Standard image High-resolution imageFigure 17 and table 4 compare the deuterium permeation resistance of the composite coating samples in this paper and the literature. The composite coating in [60] exhibits excellent deuterium permeation resistance at low temperature, however, its deuterium permeation resistance decreases significantly with the increase of temperature. The A-2/H-60/O-24 sample prepared in this paper not only exhibits excellent deuterium permeation resistance with PRF higher than 5000, but also maintains high PRF at high temperature, reflecting its excellent high temperature resistance.
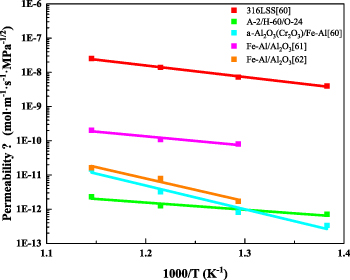
Figure 17. Comparison of deuterium permeability of composite coatings in this paper and the literature [60–62].
Download figure:
Standard image High-resolution imageTable 4. Comparison of deuterium permeation reduction factor of composite coatings in this paper and the literature [60–62].
| Samples | Oxidation parameters | 600 °C | 550 °C | 500 °C | 450 °C |
|---|---|---|---|---|---|
| A-1, H-250 | O-10 | 1.45 × 10³ | 9.62 × 10² | 8.14 × 10² | 8.55 × 10² |
| O-24 | 1.30 × 10³ | 1.06 × 10³ | 8.34 × 10² | 8.70 × 10² | |
| 1000-O-2 | 1.43 × 10³ | 1.32 × 10³ | 1.49 × 10³ | 9.68 × 10² | |
| A-2, H-60 | O-10 | 3.96 × 10³ | 4.01 × 10³ | 3.46 × 10³ | 3.07 × 10³ |
| O-24 | 1.08 × 10⁴ | 1.10 × 10⁴ | 7.83 × 10³ | 5.65 × 10³ | |
| O-50 | 2.06 × 10³ | 1.77 × 10³ | 1.54 × 10³ | 1.60 × 10³ | |
| α-Al2O3(Cr2O3)/Fe–Al [60] | 1.68 × 10³ | 4.29 × 10³ | 8.78 × 10³ | 1.19 × 10⁴ | |
| Fe–Al/Al2O3 [61] | 1.24 × 10² | 1.27 × 10² | 90.5 | ||
| Fe–Al/Al2O3 [62] | 1.55 × 10³ | 1.77 × 10³ | 4.22 × 10³ | ||
3.4. Discussion
The aluminized sample is composed of FeAl3 and Fe2Al5 with high Al content before heat treatment. During the heat treatment process, the phase of the coating is gradually transformed into FeAl and Fe3Al with low Al content due to the diffusion of Al element into the substrate. FeAl and Fe3Al are conducive to the formation of γ-Al2O3 phase [41]. During the aluminizing process, the aluminizing temperature affects the thickness of the aluminized layer, which affects the time required for the complete phase transformation during the subsequent heat treatment process. Compared with the A-1 samples, the A-2 samples prepared at a lower aluminizing temperature have a thinner aluminized layer. The heat treatment time required to obtain the aluminized layer dominated by the FeAl phase is greatly reduced. The defects generated during the heat treatment process are reduced and the high compactness of the coating is maintained.
The difference in deuterium permeation resistance of coatings with and without sealing treatment reflects the importance of coating compactness to deuterium resistance permeability [25].
As shown in figures 14(c) and (d), there are many nanocrystalline structures with different orientations in the oxide layer, which makes the γ-Al2O3 phase exhibit a polycrystalline structure. The difference of nanocrystalline growth orientation of the oxide layer may be derived from the interface between the aluminized layer and the oxide layer. The concentration of Al atoms in different regions at the interface is different, which makes the growth rate of nanocrystals in different regions different. In addition, the slight fluctuation of the interface affects the initial growth direction of the nanocrystals. The above two factors lead to the formation of many nanocrystalline structures with different orientations, forming a polycrystalline γ-Al2O3 structure. There are many amorphous structures in the oxide layer, which may be due to the low oxidation temperature. The Al2O3 in some regions has not yet formed a crystal structure. The Al2O3 layer composed of nanocrystalline inclusions with amorphous microstructure has excellent deuterium permeation resistance [37]. The possible reason is that the microstructure possesses high compactness, and the polycrystalline γ-Al2O3 interface complicates the deuterium permeation path inside the oxide layer and hinders the diffusion of deuterium. In the subsequent deuterium permeation experiment, the amorphous Al2O3 in the oxide layer continues to crystallize at high temperature, resulting in an increase in the concentration of polycrystalline γ-Al2O3.
After in-situ oxidation of A-2/H-60 samples, the oxide layer thickness of O-24 sample with longer oxidation time is higher than that of O-10 sample. The deuterium permeation resistance of O-24 sample is better, which indicates that the deuterium permeation resistance is affected by the thickness of Al2O3 layer. The thicker Al2O3 layer is more difficult to be completely penetrated by deuterium. The A-1/H-250/1000-O-2 sample possesses a thicker Al2O3 layer, and the peak of the Al2O3 phase can be observed by GIXRD. However, the deuterium permeation resistance of the A-1/H-250/1000-O-2 sample is worse than that of the in-situ oxidized sample prepared on the basis of A-2/H-60 sample with a thinner Al2O3 layer. Compared with the thickness of the Al2O3 layer, the quality of the aluminized layer is more important to the deuterium permeation resistance. The possible reason for the difference in permeability is that the number of defects inside the aluminized layer increases with the increase of heat treatment time. The deuterium penetrating the Al2O3 layer is easier to penetrate the aluminized layer with more defects. The heat treatment time of the A-2 sample is shorter, the defects of the aluminized layer are less, and the compactness of the coating is maintained. The deuterium permeation resistance of A-2/H-60/O-50 sample is worse than that of O-10 and O-24 samples, which is determined by the thickness of the oxide layer and the quality of the aluminized layer.
As mentioned above, the growth rate of the oxide layer is not constant and tends to decrease with the increase of oxidation time. The difference of Al2O3 layer thickness between O-50 sample and O-10, O-24 samples is not obvious. During the in-situ oxidation process of 50 h, the aluminized layer is also heat-treated for a long time, resulting in more defects inside the aluminized layer. The superposition effect of the above two factors makes the deuterium permeation resistance of O-50 sample worse than that of O-10 and O-24 samples. The permeability ratio of the 316LSS substrate at 600 °C to 450 °C is 6.30, while the permeability ratio of the A-2/H-60/O-24 sample at 600 °C to 450 °C is 3.30. With the increase of temperature, the deuterium permeability of the 316LSS substrate increases greatly, and the deuterium permeability of the coated samples increases slightly, resulting in an increase in PRF. The phenomenon that the PRF of the tritium permeation barrier coating increases with the increase of temperature is not a special case. Similar PRF variation with temperature has been documented in other investigation [37].
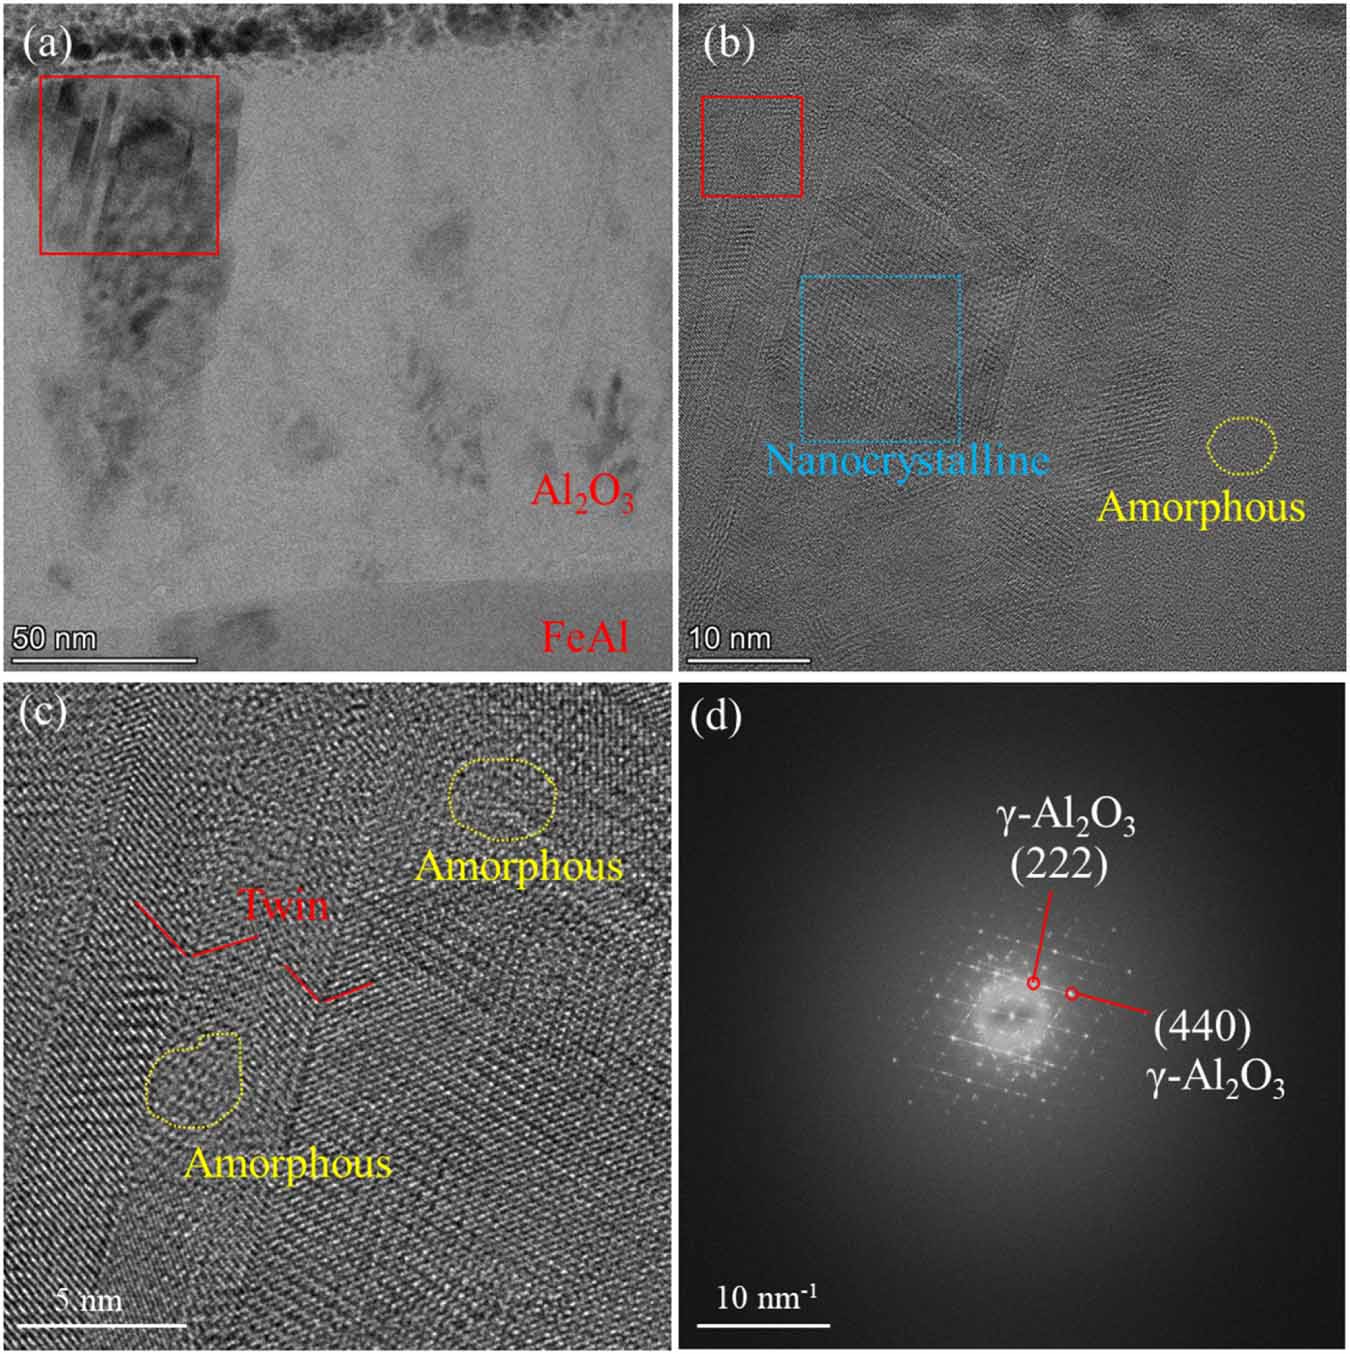
Figure 18 shows cross section of the A-2/H-60/O-50 sample after deuterium permeation experiment. As shown in figure 18(a), there are many black contrast crystallization areas in the Al2O3 layer. Compared with figure 10, the A-2/H-60/O-50 sample experienced a longer oxidation process, and the degree of crystallization in the Al2O3 layer was higher. Figure 18(b) shows the HRTEM image of the red square area in figure 18(a). Some nanocrystalline aggregation zones appear as shown in the blue square area in figure 18(b). Figure 18(c) shows enlarged image of the red square area in figure 18(b). Twin crystal structure appears in the Al2O3 layer, mixed with amorphous. Figure 18(d) shows the FFT image of figure 18(b). Compared with the FFT and SAED images in figure 14, many diffraction spots appear in the FFT image of Al2O3 layer of the A-2/H-60/O-50 sample, indicating that the crystallization degree of Al2O3 layer of A-2/H-60/O-50 sample is higher than that of A-2/H-60/O-10 and A-2/H-60/O-24 samples. The maximum temperature of deuterium permeation experiment in this paper is 600 °C. At this temperature, the crystallization process of amorphous Al2O3 is slow. The effect of deuterium permeation test on the microstructure of Al2O3 layer is not significant. Compared with A-2/H-60/O-10 and A-2/H-60/O-24 samples, the amorphous Al2O3 in the A-2/H-60/O-50 sample continues to crystallize at 700 °C and many new grain boundary defects appear. The Al2O3 layer in the A-2/H-60/O-50 sample still possesses the crystal structure of amorphous mixed with γ-Al2O3, however, the degree of crystallization is higher. More grain boundary defects produced by longer oxidation provide more deuterium diffusion channels, resulting in the deterioration of deuterium permeation resistance.
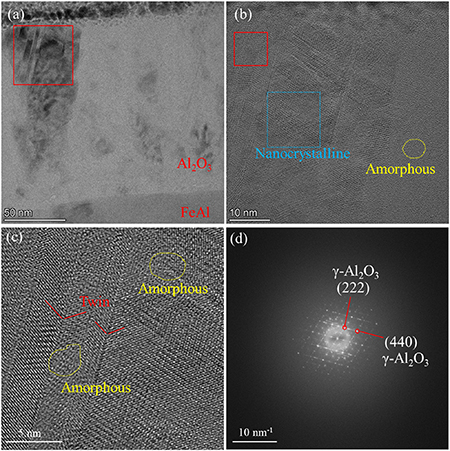
Figure 18. The cross section of the sample aluminized at 600 °C for 2 h, heat treated at 700 °C for 60 h and oxidized at 700 °C for 50 h after deuterium permeation experiment, (a) TEM image, (b) HRTEM image of the red square area in (a), (c) enlarged image of the red square area in (b), (d) FFT image of (b).
Download figure:
Standard image High-resolution image4. Conclusion
In this paper, Fe–Al/Al2O3 coating was prepared by pack aluminizing and in-situ oxidation. The preparation temperature was lower than 700 °C. The main conclusions are as follows:
- (1)The aluminized layer without heat treatment is composed of Fe2Al5 and FeAl3. During the heat treatment process, Fe2Al5 and FeAl3 with high Al content are gradually transformed into FeAl and Fe3Al with low Al content. Compared with the aluminized layer prepared at 650 °C, the aluminized layer prepared at 600 °C is thinner. The heat treatment time required to obtain the aluminized layer dominated by FeAl phase is less.
- (2)The oxide layer is dense and uniform in thickness, which is closely combined with the aluminized layer without obvious defects. The aluminized layer is still composed of FeAl phase after in–situ oxidation. The Cr content in the aluminized layer is about 7%–8%. After in-situ oxidation in pure O2 atmosphere at 700 °C, the thickness of the oxide layer of the sample with oxidation time of 10 h is 87 nm, and that of the sample with oxidation time of 24 h is 131 nm. The oxide layer is composed of polycrystalline γ-Al2O3 and amorphous Al2O3.
- (3)Compared with the aluminized sample prepared at 650 °C, the aluminized sample prepared at 600 °C exhibited better deuterium permeation resistance after in-situ oxidation. The samples aluminized at 600 °C for 2 h, then heat-treated at 700 °C for 60 h, and oxidized at 700 °C in pure O2 atmosphere for 24 h exhibits excellent deuterium permeation resistance. The PRF at 450 °C–600 °C is higher than 5000. With the increase of temperature, the deuterium permeability of the 316LSS substrate increases greatly, and that of the coated samples increases slightly, resulting in an increase in PRF. The deuterium permeation resistance of the coating is more significant at high temperature. This may be related to the high compactness and polycrystalline interface of the oxide layer composed of polycrystalline γ-Al2O3 inclusion amorphous Al2O3 structure.
Acknowledgments
This work was supported by the National Natural Science Foundation of China (No. 12475293), the Guangdong Basic and Applied Basic Research Foundation (Grant No. 2021B1515120014), the Guangdong Pearl River Talent Plan Project (2021QN02L401), and the Natural Science Foundation of Shenzhen Municipality (JCYJ20241202124215018).
Data availability statement
The data that support the findings of this study are available from the corresponding authors upon request.