

Abstract
Methane (CH4) emissions from the oil and natural gas (O&G) supply chain have been demonstrated to be one of the largest anthropogenic greenhouse gas emission sources ripe for mitigation to limit near-term climate warming. In recent years, exploration and production (E&P) operators have made public commitments to reducing their greenhouse gas emission intensity, yet little empirical information has been made available in the public domain to allow an accurate comparison of their emissions performance. In this study, we utilize a series of aircraft surveys of large CH4 point source emissions (∼101–104 kg CH4 hr−1) related to O&G production in the Permian Basin to enable comparison of company-level production-sector emission intensities. We calculate gas and total energy production normalized emission intensities for several of the largest E&P operators in the Permian Basin accounting for ∼85% of production within the flight region. We find differences of more than an order of magnitude in emission intensity across operators, with nearly half demonstrating a ⩾50% improvement in performance from 2019 to 2021. With the availability of such publicly attributed emissions data anticipated to increase in the future, we provide methodological insights and cautions to developing operator metrics from future empirical datasets.
Export citation and abstract BibTeX RIS

Original content from this work may be used under the terms of the Creative Commons Attribution 4.0 license. Any further distribution of this work must maintain attribution to the author(s) and the title of the work, journal citation and DOI.
1. Introduction
The climate impacts of using oil and natural gas (O&G) to meet energy needs are greatly affected by methane (CH4) emissions across their value chain; rapid mitigation of these emissions is technologically feasible and necessary to slow the current rate of warming [1]. In recent years, growing public awareness of this issue has led to both regulatory and voluntary actions in order to mitigate emissions. Command-and-control programs such as the United States' Environmental Protection Agency's (EPA) regulatory standards [2] and the voluntary CH4 Guiding Principles [3] mandate specific best practices in equipment and operations, such as replacing natural gas driven pneumatic controllers with zero emission alternatives or engineering approaches aimed at capturing gas thus avoiding the need for gas flaring. Alternatively, performance-based programs [4] established by third-party organizations set technology-neutral standards which are evaluated by an estimation of a CH4 intensity: the ratio of CH4 emissions to natural gas or total energy production. Performance-based programs can either set minimum standards to allow production or import of products, or differentiate products by their performance and provide financial incentives to reduce emissions such as consumers paying a higher price for lower emission products.
The vast majority of oil and gas companies and their host countries currently utilize bottom–up based methods to estimate CH4 emissions relying on emission factors and component counts, even though numerous studies have found these approaches in most cases substantially underestimate emissions in comparison to empirical site and area-level measurement-based approaches [5]. A recent study [6] calculated CH4 intensity metrics for the top 70 producing operators Canada using several bottom–up inventory based methods and compared them to operators' self-reported values when available. Their analysis finds similarities in the distribution of emissions intensities generated by producer dis-aggregation of the classical national inventory as well as an extensive measurement-based inventory, indicating that they track the same signal although a skew towards higher intensities is present in the latter which found emissions to be 1.5× larger than national estimates [7]. This result is unsurprising as their methodology does not consider operator identity as a discriminatory metric in their calculation of emission factors; therefore, the observed differences in intensity are largely a result of site counts within each region rather than empirically verifiable emission rates arising from differing operational leak detection and repair (LDAR) practices employed by operators. A similar analysis of emission intensity comparison for US-based producers [8] relies on self-reported national inventory data in aggregate which cannot be empirically verified or subdivided to specific regions. To compare actual emission intensity performance fairly and robustly between operators, it is critical that metrics are based on empirical measurement data and analyzed with transparent, statistically valid approaches.
The high degree of spatiotemporal variability in O&G CH4 emissions is among the largest challenges involved with use of empirical data to calculate operator-based emission intensities. The spatial scale of measurement approaches ranges from the component [9, 10] and site [11, 12] level, to broader regional and basin-level quantification using aircraft mass balance [13, 14], stationary tower networks [15, 16] or satellite remote sensing [17, 18] approaches. In some regions outside of North America, basin-level production is controlled by a single operator such as a national oil company and regional quantification would therefore be of sufficient spatial resolution to determine operator-level intensity, provided sufficient data exists to discriminate O&G sources from other anthropogenic and natural CH4 sources. However, in many basins in the United States and Canada there are hundreds of operators with wells and other assets in close proximity to one another. Additionally, pipelines and other midstream infrastructure are a significant component of emissions which are often operated by a different group of companies than those in the production sector. While regional quantification methods generally produce robust estimates of aggregate emission intensity, these approaches are often unsuitable for devising operator-specific metrics due to the heterogeneity in asset ownership.
The temporal variability of O&G emission sources is also known to vary substantially at high frequency at both individual sites [19, 20] as well as within regions [16, 21]. Modeling frameworks have been developed to connect operational activities and emission rates [22] and their variability; however, at present operator-specific data does not exist within the public domain to characterize differences in performance with respect to emission intensity using such a process based model. Subpart W of the EPA's Greenhouse Gas Reporting Program does include valuable operator-specific data used in emissions modeling [23], yet lacks the site-specific and time-stamped data needed for such process-based models.
For approaches characterizing emissions within large regions of O&G production, the effect of intermittency should be limited provided the sampling frequency is sufficient. Yet, for finer scale approaches like site-level measurements, intermittency increases the uncertainty of extrapolating individual measurements to represent an operator's complete emission portfolio. Recent developments in aerial remote sensing [21, 24–27] allow for repeated detection and quantization of large emission plumes in O&G production regions, enabling the collection of sufficient observations to be able to investigate the differences in emission intensity across operators.
In this study, we characterize empirically-based emissions intensity performance among company-level upstream assets in the Permian Basin from 2019 to 2021 by integrating aerial remote sensing data from four measurement surveys carried out using the AVIRIS-NG and GAO platforms [21, 28–30] with activity data [31] on O&G production. For CH4 emissions sources detected within the upstream sector, we account for observational intermittency of emission sources by use of repeated overflights in distinct yet largely overlapping pre-defined flight regions over a period of 2–6 weeks during each campaign. We calculate natural gas and total energy-normalized performance metrics for a cohort of the highest producing operators within the study region. We discuss reasons for variability in emissions intensity among operators and across surveys, as well as the limitations of our approach with respect to intermittency, source attribution, and detection limit of the aircraft platform.
2. Methods
Data from each campaign is aggregated independently and referred to by the season and year in which they occurred, e.g. Fall 2021 as 'F21' (table 1). Campaigns conducted in 2020 and 2021 are used in their entirety; however, for the Fall 2019 campaign we restrict the dataset to only include those sources and well sites within two contiguous regions which largely overlap with the other three campaigns (figure 1). This restricted region (herein referred to as 'F19core') is chosen along the perimeter of areas with the highest density of flight coverage (generally Nov > 5, figure S1). The limitation to considering data from only this high-coverage region allows for the persistence-weighted emissions to realistically capture the high degree of intermittency that exists for large point sources, as much of the remaining survey area outside the F19core boundary was covered on fewer than three independent days [21].
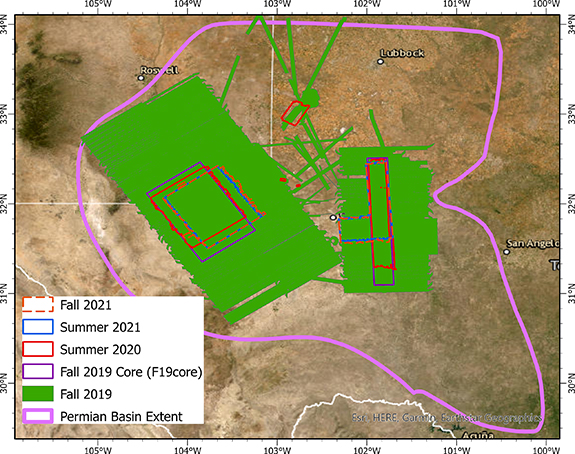
Figure 1. Campaign flight region boundaries map of full extent for each campaign analyzed in this study. Green shaded region presents the full extent of all flight lines analyzed in the 2019 campaign; yet the purple outline presented the restricted region F19core containing the areas with repeated coverage and largely overlapping with the remaining campaigns. Map generated using ESRI ArcGIS Pro and the World Imagery basemap [39].
Download figure:
Standard image High-resolution imageTable 1. Summary of campaign coverage and total emissions.
| Campaign name | Season | Dates surveyed | Area of flight coverage (Km2) | Total sources detected (Upstream sources, sources attributed to specific operators) | Average number of overflights per upstream source ± 1σ | Persistence weighted emissions from all sources (MT hr−1 ± 1σ) | Persistence weighted emissions from all upstream sources (MT hr−1 ± 1σ) |
|---|---|---|---|---|---|---|---|
| F19 | Fall 2019 | Sep 22—4 November 2019 | 78 210 | 1756 (1054, 993) | 5.7 ± 3.9 | 430 ± 136 | 220 ± 69 |
| F19core | 10 281 | 925 (597, 566) | 8.8 ± 2.1 | 143 ± 47 | 71 ± 23 | ||
| S20 | Summer 2020 | Jul 13–24, 2020 | 8380 | 383 (204, 198) | 2.9 ± 0.8 | 88 ± 24 | 34 ± 9 |
| S21 | Summer 2021 | July 26—Aug 10, 2021 | 8377 | 533 (296, 290) | 3.4 ± 0.9 | 80 ± 23 | 35 ± 10 |
| F21 | Fall 2021 | Oct 3–17, 2021 | 8844 | 457 (268, 259) | 3.8 ± 1.0 | 80 ± 30 | 39 ± 14 |
The use of persistence weighted emissions allows for the characterization of intermittency provided that all operators' assets have near-equal coverage (table S1). More variability in coverage is observed Fall 2019 and Summer 2020 as compared with the 2021 campaigns, yet we do not find any correlation of emission intensity with minor deviations in coverage. We further investigate this assumption with a sensitivity analysis (SI section 2) which aggregates emissions by unique plume observations and scaling each operator's production by the number of daily wellsite flyovers. We also explore another sensitivity analysis quantifying the prevalence of emission events per wellsite flyover, effectively ignoring the quantification of plumes and only deriving metrics based on the prevalence of emission sources detected by the aircraft. The former finds largely similar results to those presented in the main text below, with differences in the latter primarily explainable by heterogeneity in wellsite ownership.
O&G production data for all wells in the Permian Basin in 2019–2021 are obtained from Enverus Prism [31] as of April 2022. We aggregate monthly production by operator within each flight region for all wells within the perimeter of each campaign's flight region (figure 1). Daily average gas and barrels of oil equivalent (BOE) production for each operator are calculated using the data from each month in which the campaign occurred. All emission sources are attributed to industry sector (upstream vs midstream) and specific operators based on an analysis of satellite imagery as well as GIS data containing wellsite and asset coverage aggregated from public and proprietary data datasets (SI section 1). Emission sources attributed to midstream facilities (e.g. compressor stations and gas processing plants) and pipelines represent a significant source of emissions from large point sources [21, 30]; yet are excluded from this analysis as they lack public activity data required to normalize for the different capacity and throughput of midstream assets. Therefore, we aggregate the persistence weighted emissions attributed for sources with 'well' or 'tank' in their 'source_type' designation for each operator within the flight region of each campaign.
The hyperspectral sensor on board the AVIRIS-NG and GAO aircraft have substantially high detection limits, limiting the observational dataset to only include the largest point sources, colloquially referred to as 'super-emitters'. Controlled release testing [32] has demonstrated the capacity for AVIRIS-NG to observe emission rates as low as ∼10 kg hr−1 under ideal conditions when the emission location is known; however, the distribution of plume emission rates quantified in Permian flight campaigns from 2019–2021 (figure S2) suggest a broad range of partial detection up to ∼100–200 kg hr−1. The 'true' distribution of large point sources likely follows a power law captured by the right half of the distribution [33], while the left tail of the measured distributions characterizes a partial detection range where the instrument cannot observe all emission sources. A more robust assessment of operator metrics would incorporate empirical data from lower detection limit methods (e.g. ground-based surveys), yet operator-attributed datasets of sufficient size for the Permian Basin do not exist in the public domain at present. As such, we characterize the emission intensity derived in this study as 'Super-Emitter Loss Rates' which represent a lower bound on each operator's true emissions intensity which would include smaller emission sources.
We calculate emission intensity as the quotient of aggregated emissions detected and either natural gas or total energy production applying several assumptions about basin-wide gas composition. For the case of normalizing emissions to each operators' respective gas production, we define a 'Super-Emitter Gas Production Normalized Loss Rate' using (a) an industry standard conversion of 19.2 kg CH4 per thousand cubic feet of natural gas (MCF) and (b) a constant volumetric natural gas CH4 content of 80% [34] for raw natural gas within the upstream sector of the Permian Basin. For the case of total energy normalization, we define a 'Super-Emitter Energy Normalized Loss Rate' adding the additional energy equivalence of 6 MCF per BOE. We recognize that the CH4 composition of natural gas as well as the energy content of O&G are heterogeneous through different formations in the basin; thus, while these assumptions are necessary to calculate a dimensionless intensity, they are a source of uncertainty not currently constrained by our methodology.
We define a set of criteria for inclusion of operators in this analysis; emissions attributed to remaining operators (as well as those unable to be attributed) are aggregated into a separate category entitled 'OTHER'. Criteria for operator inclusion: (a) emission sources to have been detected and attributed to the operator in at least three of the four flight campaigns, (b) at least 15 emission sources detected and attributed across all four campaigns, and (c) total production volumes within the region of least 25 000 BOE per day and 70 000 MCF per day during the months in which the campaign flyovers occurred. These criteria ensure that the emissions observations captured during each campaign represent a realistic picture of each operators' emission intensity. The 14 operators meeting these criteria account for approximately 85% of natural gas or energy production within each campaign's flight region (range: 83%–87%), while each campaign's coverage area includes about 41% of Permian natural gas and energy production on average (range: 38%–44%). Emission intensity metrics for these operators capture large point source CH4 emissions from about one third of the gas or energy production of the Permian Basin.
We characterize the operators into three different classes: 'Major' operators include five of the seven global oil supermajors which operate in the Permian Basin, 'Public' operators are those with public ownership structures which are traded on a stock exchange, while 'Independent' are those which are privately owned and generally backed by private equity. Operator names in this study are replaced with aliases using the phonetic alphabet to focus the analysis and discussion on the differences in observations without knowledge of external factors regarding each operators' public statements with respect to emission intensity or LDAR practices.
3. Results and discussion
The primary comparison emissions intensity for this analysis ('Gas-Production Normalized Super-Emitter Loss Rate') is presented in figure 2 as a series of grouped bar charts with individual 1σ uncertainty for each operator and campaign. Figure 3 depicts the mean and range of emission intensities observed across all four campaigns for each operator. Numerical data from these figures are available in table 2, while figure 4 presents a visualization of this dataset whereby each individual operators' quantized loss rates are compared over time from the four campaigns, although the time axes are nonlinear with gaps of 9, 12 and ∼2.5 months separating the four respective campaigns. Additional visualization of these results based on energy normalization are provided in figure 5 with numerical data available in table 3.

Figure 2. Grouped bar chart with gas normalization gas production normalized super-emitter loss rate calculated for each campaign and operator in this study. Error bars indicate 1σ uncertainty of the super-emitter loss rate calculated for each campaign.
Download figure:
Standard image High-resolution image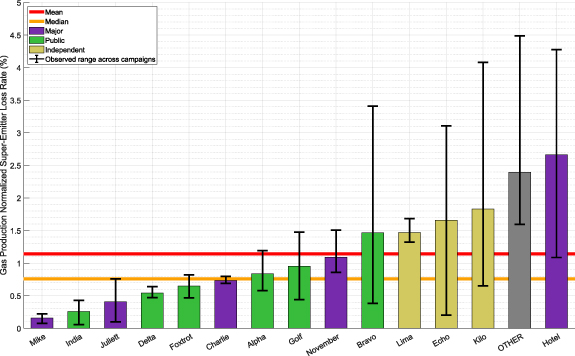
Figure 3. Mean gas normalization results mean gas production normalized super-emitter loss rate for each operator across all campaigns. Horizontal lines present the median and mean gas production normalized super-emitter loss rate of all operators, while the grey bar represents the combined cohort of all remaining operators as a single statistic. Error bars indicate the range between highest and lowest gas production normalized super-emitter loss rate across campaigns—uncertainty in individual campaigns is presented in figure 2.
Download figure:
Standard image High-resolution image
Figure 4. Temporal comparison of gas normalization results temporal comparison of gas production normalized super-emitter loss rate for each operator across all campaigns. Colored lines represent the labeled operator while grey lines represent the remaining ones. Vertical axes are logarithmically scaled, while the horizontal axes are non-linear with separation of approximately 9, 12, and 2.5 months between each of the campaigns in chronologic order. Green lines indicate which operators presented a 50% decrease in gas production normalized super-emitter loss rates from 2019 to the average of 2021 campaigns.
Download figure:
Standard image High-resolution image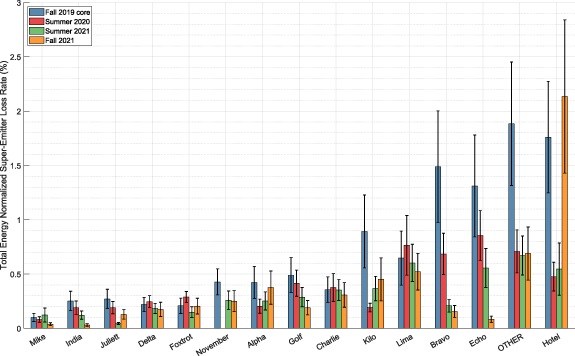
Figure 5. Grouped bar chart of emission intensity of each campaign with energy normalization similar to figure 2, except with normalization to total energy production in BOE. Error bars indicate 1σ uncertainty of the super-emitter loss rate calculated for each campaign.
Download figure:
Standard image High-resolution image
Table 2. Gas Normalized Super-Emitter Loss Rates Emission intensities in the form of gas production normalize super-emitter loss rates are presented for each campaign and operator. Errors for each individual campaign reflect the uncertainty in aggregation of detected emissions for each campaign while the final column presents the mean emission intensity across all campaigns ±1 standard deviation of each individual campaign's results. OTHER represents the combined emission intensity for operators not listed as well as unattributable emissions. SELECTED refers to the aggregate emissions intensity of all 14 listed operators, while ALL reflects the aggregate emissions of all operators.
| Operator alias | F19core | S20 | S21 | F21 | Mean ± 1sd |
|---|---|---|---|---|---|
| Mike | 0.18 ± 0.07 | 0.16 ± 0.05 | 0.22 ± 0.12 | 0.08 ± 0.03 | 0.16 ± 0.06 |
| India | 0.43 ± 0.15 | 0.32 ± 0.10 | 0.23 ± 0.07 | 0.06 ± 0.02 | 0.26 ± 0.16 |
| Juliett | 0.76 ± 0.25 | 0.47 ± 0.14 | 0.10 ± 0.02 | 0.29 ± 0.10 | 0.41 ± 0.28 |
| Delta | 0.56 ± 0.17 | 0.64 ± 0.14 | 0.49 ± 0.13 | 0.47 ± 0.18 | 0.54 ± 0.08 |
| Foxtrot | 0.67 ± 0.23 | 0.82 ± 0.15 | 0.47 ± 0.16 | 0.65 ± 0.23 | 0.65 ± 0.14 |
| Charlie | 0.69 ± 0.23 | 0.80 ± 0.27 | 0.76 ± 0.21 | 0.69 ± 0.26 | 0.74 ± 0.05 |
| Alpha | 1.19 ± 0.42 | 0.58 ± 0.18 | 0.64 ± 0.21 | 0.94 ± 0.38 | 0.84 ± 0.28 |
| Golf | 1.48 ± 0.49 | 1.21 ± 0.35 | 0.69 ± 0.21 | 0.44 ± 0.15 | 0.95 ± 0.47 |
| November | 1.51 ± 0.42 | No Emissions | 0.91 ± 0.30 | 0.86 ± 0.33 | 1.09 ± 0.36 |
| Lima | 1.32 ± 0.51 | 1.68 ± 0.60 | 1.55 ± 0.44 | 1.32 ± 0.43 | 1.47 ± 0.18 |
| Bravo | 3.41 ± 1.18 | 1.55 ± 0.43 | 0.52 ± 0.14 | 0.38 ± 0.13 | 1.47 ± 1.40 |
| Echo | 3.11 ± 1.11 | 2.02 ± 0.54 | 1.31 ± 0.42 | 0.20 ± 0.07 | 1.66 ± 1.22 |
| Kilo | 4.08 ± 1.53 | 0.65 ± 0.14 | 1.15 ± 0.35 | 1.43 ± 0.63 | 1.83 ± 1.54 |
| Hotel | 4.15 ± 1.21 | 1.09 ± 0.30 | 1.14 ± 0.51 | 4.28 ± 1.41 | 2.66 ± 1.79 |
| SELECTED | 1.20 ± 0.40 | 0.73 ± 0.20 | 0.54 ± 0.17 | 0.59 ± 0.22 | 0.76 ± 0.30 |
| OTHER | 4.49 ± 1.35 | 1.60 ± 0.45 | 1.73 ± 0.46 | 1.76 ± 0.63 | 2.39 ± 1.40 |
| ALL | 1.68 ± 0.54 | 0.83 ± 0.23 | 0.69 ± 0.20 | 0.74 ± 0.27 | 0.98 ± 0.47 |
Table 3. Energy normalized emission intensity similar to table 2 with the exception of normalization to total energy production in BOE.
| Operator alias | F19core | S20 | S21 | F21 | Mean ± 1sd |
|---|---|---|---|---|---|
| Mike | 0.10 ± 0.04 | 0.08 ± 0.03 | 0.12 ± 0.06 | 0.04 ± 0.01 | 0.09 ± 0.04 |
| India | 0.25 ± 0.09 | 0.19 ± 0.06 | 0.12 ± 0.04 | 0.03 ± 0.01 | 0.15 ± 0.09 |
| Juliett | 0.27 ± 0.09 | 0.19 ± 0.06 | 0.04 ± 0.01 | 0.13 ± 0.04 | 0.16 ± 0.10 |
| Delta | 0.22 ± 0.07 | 0.25 ± 0.06 | 0.18 ± 0.05 | 0.17 ± 0.07 | 0.21 ± 0.03 |
| Foxtrot | 0.21 ± 0.07 | 0.29 ± 0.05 | 0.15 ± 0.05 | 0.20 ± 0.07 | 0.21 ± 0.06 |
| November | 0.43 ± 0.12 | No Emissions | 0.26 ± 0.08 | 0.25 ± 0.10 | 0.31 ± 0.10 |
| Alpha | 0.42 ± 0.15 | 0.20 ± 0.07 | 0.25 ± 0.08 | 0.38 ± 0.15 | 0.31 ± 0.10 |
| Charlie | 0.36 ± 0.12 | 0.38 ± 0.13 | 0.35 ± 0.10 | 0.31 ± 0.11 | 0.35 ± 0.03 |
| Golf | 0.49 ± 0.16 | 0.42 ± 0.12 | 0.29 ± 0.09 | 0.19 ± 0.07 | 0.35 ± 0.13 |
| Kilo | 0.89 ± 0.34 | 0.19 ± 0.04 | 0.37 ± 0.11 | 0.45 ± 0.20 | 0.48 ± 0.30 |
| Lima | 0.65 ± 0.25 | 0.76 ± 0.27 | 0.60 ± 0.17 | 0.52 ± 0.17 | 0.63 ± 0.10 |
| Bravo | 1.49 ± 0.51 | 0.69 ± 0.19 | 0.21 ± 0.06 | 0.16 ± 0.05 | 0.63 ± 0.62 |
| Echo | 1.31 ± 0.47 | 0.85 ± 0.23 | 0.56 ± 0.18 | 0.08 ± 0.03 | 0.70 ± 0.52 |
| Hotel | 1.76 ± 0.51 | 0.48 ± 0.13 | 0.55 ± 0.24 | 2.13 ± 0.71 | 1.23 ± 0.84 |
| SELECTED | 0.48 ± 0.16 | 0.30 ± 0.08 | 0.22 ± 0.07 | 0.24 ± 0.09 | 0.31 ± 0.12 |
| OTHER | 1.88 ± 0.57 | 0.71 ± 0.20 | 0.67 ± 0.18 | 0.69 ± 0.24 | 0.99 ± 0.60 |
| ALL | 0.68 ± 0.22 | 0.35 ± 0.10 | 0.28 ± 0.08 | 0.30 ± 0.11 | 0.40 ± 0.19 |
Although this study represents the first characterization of oil and gas operator emission intensity using empirical datasets, our observations are specific to the Permian Basin and therefore not inherently representative of operators' assets in other basins. Site-level emission rates can vary greatly over time, yet the aerial remote sensing measurements integrated by this study represent snapshots of emissions collected during several fixed flight periods of approximately two (2020–21) or six (2019) weeks duration. As such, these empirically based emission intensity metrics are representative of the time their underlying measurements were collected and cannot assume to characterize long-term or current performance. This is exemplified by some operators (e.g. Echo and Hotel) presenting dramatically different emission intensities beyond 1σ confidence (both decreasing and increasing respectively) for the Summer and Fall 2021 campaigns which were only ∼2.5 months apart. Following protocols of the PermianMAP [28] project, observations from the Summer 2021 campaign were distributed to operators via email on two separate occasions prior to the Fall 2021 campaign, and also posted on a public facing website. While it is possible that sharing the emissions observations with operators lead to direct mitigation in the case of Echo's reduction in intensity, large point sources exhibit high temporal variability and it is difficult to interpret the increasing intensity observed by Hotel without more transparency from operators related to the cause and mitigation of these large emission sources.
Initial comparison of all 14 operators in figures 2–4 reveals a range in emission intensity of more than an order of magnitude among all operators, yet several key insights are evident in the data. First, despite the recognition that these super-emitter loss rates represent a lower bound on emissions intensity, only one operator (Mike) has an emission intensity consistently below the publicly announced target upstream intensity of 0.2% [35], although two others (India and Juliett) fall below that level on both of the 2021 campaigns. This observation clearly shows more work is needed by operators in the Permian to mitigate large emissions sources in order to reach the level of committed emission intensities. Secondly, we find that both oil-supermajors and publicly traded companies span the gamut from lowest to highest emissions intensities, while the three independent operators are among the highest emitting operators. Although the operators are ranked by increasing mean emissions intensity, the bulk of each campaign's quantified emissions intensities are statistically similar at the 1σ level and therefore only a handful of observations are statistically different at the 1σ level and even fewer at higher confidence levels. When comparing emission intensity across the different campaigns in figure 4, we find that six of the fourteen operators as well as the remaining 'OTHER' cohort were able to reduce their emission intensity by at least 50% from 2019 to the average of the 2021 campaigns. Some of these reductions (e.g. Bravo and Echo) approached an order of magnitude in intensity suggesting significant changes in operational practices occurred over these two years. We suspect reductions in flared gas volumes are a key mechanism for improved performance as inefficient or unlit flares were a key component of the identified sources in the Fall 2019 campaign [21]. High resolution satellite observations of the Permian have also found unlit flares to represent a significant fraction of ultra-emitting sources [36]. Weekly-scale inverse satellite analyses find reductions in total CH4 intensity of the Permian Basin over the 2018–2020 period as well as correlations between emissions and rates of new well development, and local natural gas prices [37]. This work also finds several periods within the record of study whereby significant changes in emissions occur alongside changes in flaring and pipeline capacity, although these factors fail to show long-term predictive power on the aggregate emissions over the entire record.
We explore a regression analysis (SI section 3) to examine if differences in production or activity profiles of operators show significant correlation with the quantified emission intensities in this study. When exploring single variable ordinary least squares regression, we find no significant correlation of gas production normalized emission intensity with the number or fraction of new wells within the flight region or the gas-to-oil production ratio, and significant (p < 0.05) yet very weak (R2 < 0.2) inverse correlation with gas and BOE production (table S5). Correlation of emission intensity and production is unsurprising as the intensity metric is calculated as the quotient of emissions and production, yet this result does at least suggest that operators with larger production volumes have dedicated more resources towards emission mitigation activities. Despite the results in the individual analyses, multiple linear regression with all variables does not find any significance in these predictors. While the total count of new well development was weakly correlated with changes in total emissions in the Permian Basin [37], it does not show significant correlation to the emission intensity tracked by this analysis; however, the limited number of operators, timespan, and regions in which the surveys occurred may be a factor in this result.
Despite these observations of emissions reductions and changes within the Basin over the two years in which the surveys occurred, there are several operators which showed statistically insignificant changes or even increases in their emission intensities during the more recent campaigns. The overall decrease in emissions intensity is also apparent when comparing the bulk emission intensity of all upstream sources across the four campaigns: 1.68 ± 0.54%, 0.83 ± 0.23%, 0.69 ± 0.20%, and 0.74 ± 0.27% for the four campaigns chronologically, although only the 2019 campaign is statistically different at the 1σ level. Emission quantification and mitigation is most effectively thought of as a continuous and interactive process, with frequent comprehensive surveys of emission sources used to both assess current emission intensity and identify emission reduction opportunities. Figure 5 paints a similar picture of emissions intensity with respect to energy normalization without any statistically significant changes in the pattern of emission intensities for operators in the Permian Basin, a largely oil focused basin. The same result will not necessarily hold for the full range of basins with a diversity of production profiles.
4. Conclusions
This study provides a framework for empirically assessing CH4 emission intensity across O&G operators that can facilitate broader collection of comparable data moving forward. Spatially extensive surveys with repeat measurements and public attribution data are needed to make robust comparisons of empirical emission intensities among operators; such data has been historically unavailable. Our results indicate a wide range in emission intensities among operators for a large portion of the Permian Basin during several periods, although it is important to note that many of the emission intensities are statistically identical at 1σ confidence when considering the broad uncertainties associated with the aerial emissions quantification technique deployed. Emerging remote sensing technologies should make reducing this uncertainty possible and enable similar quantification studies across multiple basins in the near future.
For almost all operators and campaigns, the lower bound metric presented exceeds corporate targets for a total gas-production normalized upstream emissions intensity of 0.2% [35]. We find empirical emission intensity metrics to be highly dynamic, with nearly half of the operators examined showing major improvement over time, which we define as a 50% reduction in the super-emitter emissions intensity between the 2019 and 2021 campaigns. Therefore, it is critical to view performance assessment as a continuous process requiring constant validation and re-assessment as operational practices change. Due to the heavy tailed nature of the emissions distributions, surveys with high detection limits like those employed here are valuable for assessing and mitigating crucial sources of emissions yet constitute only one component of a multi-scale approach for emissions detection and mitigation [38] as the proportion of emissions not detected is unknown and expected to vary among operators and over time. Additionally, we did not consider the significant emissions from the midstream sector [21, 30]; mitigation of all CH4 sources within the oilfield are necessary to reduce the climate and air quality impacts of O&G production.
Acknowledgments
The authors thank Barbara Patterson and Heather Cox of Stone Environmental for their assistance with the PermianMAP website platform and script development for the automated site attribution process; the AVIRIS-NG and GAO aircraft and instrument teams for data collection efforts; Andrew Baxter, Mary Kang, Martin Lavoie, Katlyn McKay, and Kelsey Robinson for helpful discussions. The Permian Methane Analysis Project is grateful for the support of Bloomberg Philanthropies, Grantham Foundation for the Protection of the Environment, High Tide Foundation, the John D and Catherine T MacArthur Foundation, The Zegar Family Foundation, Corio Foundation and Quadrivium. Aerial data collection was supported in part by NASA's Carbon Monitoring System program, as well as the University of Arizona and RMI. The GAO is managed by the Center for Global Discovery and Conservation Science at Arizona State University, and is made possible by support from private foundations, individuals, and Arizona State University.
Data availability statement
The data that support the findings of this study are openly available at the following URL/DOI: https://data.permianmap.org/pages/operators.
Author contributions
B H, D R L and S P H designed the study, D H C and R M D coordinated flight campaign logistics and emissions data quantification, B H, J D W and J Y attributed emission sources to operators, B H synthesized data wrote the manuscript with input from all authors.
Supplementary data (0.8 MB PDF)