

Abstract
Armed conflict and economic growth are inherently coupled; armed conflict substantially reduces economic growth, while economic growth is strongly correlated with a reduction in the propensity of armed conflict. Here, we simulate the incidence of armed conflict and its effect on economic growth simultaneously along the economic pathways defined by the shared socioeconomic pathways (SSPs). We argue that gross domestic product per capita projections through the 21st century currently in use are too optimistic since they disregard the harm to growth caused by conflict. Our analysis indicates that the correction required to account for this is substantial—expected income is 25% lower on average across countries when taking conflict into account. The correction is particularly strong for the more pessimistic SSP3 and SSP4 where expected future incidence of armed conflict is high. There are strong regional patterns with countries with contemporaneous conflicts experiencing much higher conflict burdens and reduced economic growth by the end of the century. The implications of this research indicate that today's most marginalized societies will be substantially more vulnerable to the impact of climate change than indicated by existing income projections.
Export citation and abstract BibTeX RIS

Original content from this work may be used under the terms of the Creative Commons Attribution 4.0 license. Any further distribution of this work must maintain attribution to the author(s) and the title of the work, journal citation and DOI.
1. Introduction
When estimating future socioeconomic scenarios and their implications, one of the most critical inputs is the gross domestic product (GDP) and its rate of growth over the long run (Christensen et al 2018). Extended end-of-century GDP projections are important in the projection of the impacts and economic costs of climate change (Rose et al 2017). Reflecting the importance of GDP as an indicator of socio-economic development, GDP projections have been used to project energy and land use (Popp et al 2017, Riahi et al 2017), food prices (Popp et al 2017), quality of governance (Andrijevic et al 2020), and armed conflict (Hegre et al 2016).
Most prominent among the GDP projections in use is the ENV-Growth model developed by Dellink et al (2017). This model builds projections of future economic growth, using a convergence framework and interacting key long-run drivers of population, total factor productivity, physical capital, employment and human capital, and energy and fossil fuel resources (specifically oil and gas). The projections are specified as operationalizations of each of the five shared socioeconomic pathways (SSPs) (O'Neill et al 2014), and cover the entire 21st century 4 . Other projections have also been developed, e.g. Crespo Cuaresma (2017), Leimbach et al (2017). These are built on fairly similar assumptions and are highly correlated with the Dellink et al (2017) projections 5 .
Figure 1 shows GDP per capita projections according to the ENV-Growth model for the 'middle-of-the-road' scenario SSP 2 for one high-income country (France), two lower-middle income countries (Bangladesh and Tanzania) and two low-income countries (Afghanistan and Democratic Republic of Congo). By 2100, the model suggests that the income of the Democratic Republic of Congo (DRC) has converged with France, and that the incomes in Bangladesh and Tanzania will also converge with France within only a few more decades.
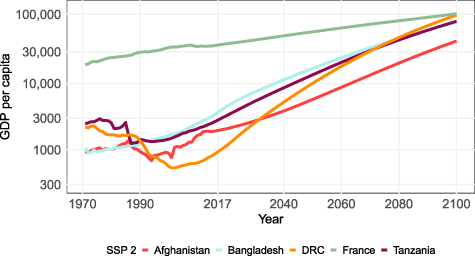
Figure 1. ENV-Growth projections for five countries from Dellink et al (2017): Afghanistan, Bangladesh, the Democratic Republic of Congo, France and Tanzania, SSP2, 2017–2100.
Download figure:
Standard image High-resolution imageAre these projections plausible? Dellink et al (2017) emphasize that they disregard external shocks or other non-economic factors affecting productivity or technological transfer, such as governance or environmental damages. One such growth-inhibiting shock is internal armed conflict. Organized political violence is often so detrimental to a country's economy that it has been termed 'development in reverse' (Collier et al 2003). A number of independent studies agree that the armed conflicts that historically have afflicted 15%–25% of all countries at any time, leads to an annual growth shortfall of 2% per conflict year (Collier 1999, Gates et al 2012) 6 . Afghanistan has had continuous armed conflict since the 1970s (Pettersson and Öberg 2020). Ignoring this constraint on Afghanistan's future growth trajectory seems unrealistic. Neglecting this feedback means that we are likely to overestimate future GDP (Buhaug and Vestby 2019) for Afghanistan, the DRC, and other conflict-prone countries. Previous efforts that approximate the risk of armed conflict in the future, as demonstrated in Hegre et al (2016) and Witmer et al (2017), suggest that this shortcoming can be addressed.
Both armed conflict and economic performance can interact with climate mitigation and adaptation efforts (Buhaug and von Uexkull 2021, Gilmore and Buhaug 2021). Armed conflict curtails economic activity and reduces capacity to development challenges (e.g. de Groot et al 2022) . Thus, reducing the burdens of armed conflict is critical for addressing financial constraints as well as the social and political unrest that can hinder efforts to adapt to adverse climate impacts, especially in the more vulnerable countries. Mitigation efforts may also be affected by armed conflict. Furthermore, by reducing institutional capacity, armed conflict could constrain efforts to coordinate mitigation of greenhouse gas emissions from national to international levels.
To demonstrate how the dynamics of armed conflict and GDP interact over the long-term, we develop in this article the first joint projections for growth in GDP per capita and armed conflict that consider the reciprocal effect of the two phenomena on one another. We use these new GDP pathways to adjust the ENV-Growth GDP per capita projections for the plausible losses due to destructive armed conflict. To simulate armed conflict and its implications for GDP, we develop empirical models of the onset and duration of conflict and the effect of conflict on GDP growth, as well as a simple model of economic growth. We then jointly simulate these outcomes using the forecasting approach outlined in Hegre et al (2013, 2016). We run the simulation for each of the five SSP scenarios, and revise the ENV-Growth model results based on the simulated prevalence of armed conflict.
2. Materials and methods
Given their prominence and sophistication, we take the Dellink et al (2017) projections as our point of departure, called  here. We estimate a country-specific correction dit
, and compute a corrected set of projections as
here. We estimate a country-specific correction dit
, and compute a corrected set of projections as

To quantify dit
, we estimate a (separate) set of linear and logistic regression models of the relationships between economic growth and armed conflict that reproduce the consensus view on the empirical relationship between these. We then run two sets of simulations for each of the SSPs:  , where we jointly simulate armed conflict and GDP growth, and
  , where we simulate GDP growth while ignoring armed conflict. For each combination of SSP, country, and year, we calculate the difference
  in simulated log GDP per capita between each pair of matched simulations. We finally subtract dit
from the original Dellink et al (2017) projections.
in simulated log GDP per capita between each pair of matched simulations. We finally subtract dit
from the original Dellink et al (2017) projections.
Using the Dellink et al (2017) projections as the base recognizes the many strengths of their approach. By simply providing the corrections dit , we do not remake the entire projection process, but rather illustrate the need to take armed conflict into account when thinking about economic growth for the long future.
2.1. Data
We develop our models of armed intrastate conflict with data from the 2017 update of the UCDP/PRIO Armed Conflict Dataset (Gleditsch et al 2002, Allansson et al 2017), which records conflicts between governments and organized armed actors with a political motivation that lead to at least 25 battle-related deaths in a year. Historic GDP per capita is derived primarily from the World Development Indicators (World Bank 2017)—the same set of sources as used by Dellink et al (2017).
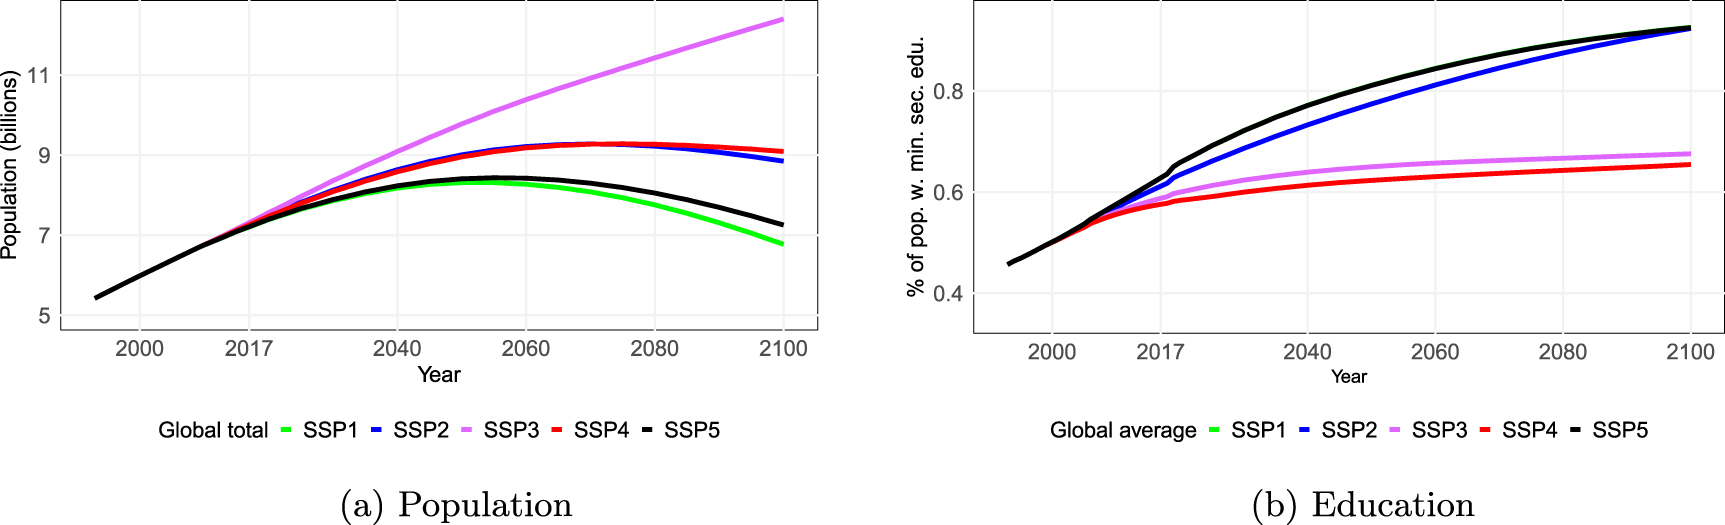
The exogenous country-level variables in our model are total population, population growth, and rates of secondary education attainment, available from IIASA (KC and Lutz 2017). Figure 2 shows observed and projected total global population under each of the five SSPs as well as the proportion of the population that have completed upper secondary education. SSP1 (sustainability; green line) and SSP5 (conventional development; black line) have optimistic assumptions regarding population growth and expansion of education. SSP4 (inequality; red line) assumes minimal expansion of education and higher population growth, whereas SSP3 (fragmentation; purple line) have similarly pessimistic education expansion assumptions and an even stronger population growth. SSP2 (blue line) is a middle-of-the-road scenario.
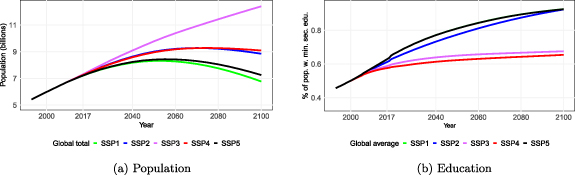
Figure 2. Projections from KC and Lutz (2017). Total global population (a), and average global proportion of population with secondary education (b). Education levels are unweighted averages of countries' education level.
Download figure:
Standard image High-resolution image2.2. Short-term impact of conflict on growth
Table 1 shows the results from a fixed-effects OLS regression with difference in log GDP per capita from one year to the other as the dependent variable. Per-capita growth is higher the higher the education level of a country, the lower the population growth, and, most importantly for our purposes, when there is no conflict 7 . In model I, log growth is 0.0233 lower in years when a country experiences conflict, roughly corresponding to 2.3% lower growth in percentage terms. In model II, we include an interaction term between conflict and population size to model that armed conflict of a given size might be more severe in smaller countries.
Table 1. Fixed-effects OLS results, two growth models, 1960–2016. Detailed specification and results in supplemental information A-2.
| Variable | Growth model I | Growth model II | ||
|---|---|---|---|---|
| Coefficient | Std. error | Coefficient | Std. error | |
| Intercept | 0.0072 | 0.014 | 0.0243 | 0.014 |
| Conflict | −0.0233 | 0.004 | −0.0980 | 0.011 |
| Log education | 0.0912 | 0.027 | 0.0856 | 0.027 |
| Population growth | −0.5885 | 0.189 | −0.6402 | 0.189 |
| Log population | −0.0104 | 0.008 | −0.0170 | 0.008 |
| Int. Population×conflict | 0.0260 | 0.003 | ||
| Country decay fixed effects | Yes | Yes | ||
2.3. Simulation procedure
To generate the basis for the conflict-corrected GDP per capita projections ( ) we expand the 'dynamic simulation' procedure used in Hegre et al (2013, 2016). Explicitly modeling the endogenous connection between conflict and growth, we simulate both probabilities of armed intrastate conflict as well as GDP growth per capita for each year, allowing the simulations to inform one another. Armed conflict is a covariate in the growth equation, and growth and income in the conflict equation. We first estimate the probability of conflict, and feed that into the growth models for that year
8
. The procedure implies estimating a set of underlying statistical models (the one in table 1 as well as a conflict model shown in table A-3), assuming the projections for population and education from IIASA for 2017–2100 (figure 2) are exogenous to conflict and growth. The models include a set of country and region fixed effects, and we assume these terms are exogenous. Since it would be unrealistic that unobserved differences between countries will remain unchanged over many decades, we reduce their importance in the future by letting them decay with a half-life of 20 years as the simulations reach into the future
9
.
) we expand the 'dynamic simulation' procedure used in Hegre et al (2013, 2016). Explicitly modeling the endogenous connection between conflict and growth, we simulate both probabilities of armed intrastate conflict as well as GDP growth per capita for each year, allowing the simulations to inform one another. Armed conflict is a covariate in the growth equation, and growth and income in the conflict equation. We first estimate the probability of conflict, and feed that into the growth models for that year
8
. The procedure implies estimating a set of underlying statistical models (the one in table 1 as well as a conflict model shown in table A-3), assuming the projections for population and education from IIASA for 2017–2100 (figure 2) are exogenous to conflict and growth. The models include a set of country and region fixed effects, and we assume these terms are exogenous. Since it would be unrealistic that unobserved differences between countries will remain unchanged over many decades, we reduce their importance in the future by letting them decay with a half-life of 20 years as the simulations reach into the future
9
.
In a number of repeated simulations, we draw realizations of model coefficients based on the estimated coefficients and the variance-covariance matrix for the estimates; calculate probability distributions for conflict and growth rates for year t0 based on the realized coefficients and the predictor variables, and randomly draw realized conflict and growth rates based on these. We then update the values for the variables measuring historical experience of conflict and growth in the country and neighbourhood. After drawing realized conflict and growth for a year, we add the simulated growth to the previous year's logged GDP per capita to obtain a new value for the simulated GDP per capita, and repeat for each year in the forecast period 2017–2100, and record the simulated outcomes for growth, GDP per capita, and conflict. The updated conflict, growth, and GDP per capita variables are then used when simulating the next year's values for these three variables. We label the procedure a 'dynamic simulation' since the outcomes we draw affect the incidence of conflict at time steps  , etc
10
.
, etc
10
.
To even out uncertainty about model specifications, we run simulations for both sets of growth models (table A-2) and conflict models (table A-3) and average over the results. In 40% of the simulations we have no region fixed effects in the conflict models, and the remaining 60% are distributed equally over four different region definitions 11 . When simulating conflict, we assume that the underlying unexplained conflict propensity of the past six years will remain the same as in the 2011–16 period 12 . We run 100 simulations for each of the clusters for each of ten imputed datasets, totalling 5000 simulations, and take the average of the results to create our corrections.
We calculate  by running two pairs of simulations of our economic growth model for the 2017–2100. In the first (
 ) we simply assume there will be no conflicts anywhere, just as in Dellink et al (2017). In the second (
 ), we simulate how much growth-reducing conflict to expect over the period, and update the growth paths of countries in which we simulate conflict using the growth model in table A-2.
The final step in our correction procedure is to add the difference dit to the original ENV-Growth model projections to arrive at conflict-corrected growth projections.
3. Results: corrected GDP per capita projections 2017–2100
3.1. GDP per capita corrections, global level
Figure 3(a) shows the cumulative difference dit in (unweighted) global GDP per capita between simulations where we ignore armed conflict and those where we take them into account. The corrections are very large—on average, countries' GDP per capita are 20%–30% lower by the century, depending on the SSP. The conflict trap indeed reduces economic growth dramatically, and ignoring it is not tenable. As we show below, for some countries the Dellink et al (2017) end-of-century projected incomes are 4–5 times larger than what our more plausible set of assumptions yields.

Figure 3. Simulation results, global unweighted averages, 2017–2100. SSP1 (green), SSP2 (blue), SSP3 (pink), SSP4 (red), SSP5 (black).
Download figure:
Standard image High-resolution imageFigure 3(b) shows the simulated proportion of countries in conflict that causes the growth losses requiring this correction. The projected global proportion of countries in conflict is roughly in line with earlier studies using the same basic setup (Hegre et al 2016) 13 . The simulations for SSP1 and SSP5 suggest a clear decline in conflict from current levels, to less than 15% of all countries at the end of the century. This decline is driven by the moderate population growth and robust expansion of education under these scenarios (see figure 2). Conversely, the forecasts for SSP3 and 4 suggest an increasing incidence of conflict (per country, if not per capita), to about 25% of all countries in 2100. This increase is driven by high population growth and a slow expansion of education levels.
In any year in the future, then, 10%–25% of all countries, depending on the SSP, will have an ongoing armed conflict. Our estimates (table A-2) suggest that every year we simulate that a country is in conflict, the country has a growth rate that is on average 2.3% lower than if a similar country avoids conflict. Over the 84 years of simulation, these growth losses accumulate, especially in the SSPs where projected conflict levels are high. In the low-conflict SSP5, the unweighted average GDP per capita is more than 30% lower in 2100 than what conflict-ignorant projections indicate. For the high-conflict SSP3 and SSP4 scenarios, unweighted average GDP per capita is more than 35% lower. In these scenarios, the low underlying economic growth rate compounds the effect in a conflict trap. The high population growth and low education levels suppress income, thus increasing expected conflict levels, and further decrease growth rates. Figure 3(c) shows the end-of-century income correction for all the countries included as a function of the end-of-century predicted conflict probability. Countries like the Scandinavian countries have incomes that are unaffected by conflict. Countries like Bangladesh (BNG), Tanzania (TZ), Afghanistan (AFG), and the DRC are predicted to have conflict in 2100 in 40%–60% of the simulations, and our estimated corrections range between −40% and −65%.
Figure 3(d) shows the corrected and uncorrected ENV-Growth projections for the five SSPs. The original projections (again as unweighted global averages) are shown as dotted lines. Compared to the projected increases in income over the next 80 years, our 20%–30% corrections are not large. As we discuss below, correcting for armed conflict are probably not sufficient to obtain truly plausible growth estimates over such a long forecasting horizon, but are clearly a step in the right direction.
3.2. Region- and country-level results
The cumulative size of the correction in GDP per capita differs greatly between countries and regions. Figure 4 illustrates the divergence between countries for the middle-of-the-road scenario (SSP2). The further toward the red end of the scale, the larger the correction. For countries with hardly any correction to their growth projections, the colour is purple. The corrections are greatest for countries our model suggests have a high future risk of conflict. This risk is high for countries with a recent, extended conflict history, as well as large and poor countries. Mali, Niger, Afghanistan and Ethiopia tick off many of these boxes, and the simulated effect of conflict on future economic growth over time is large. Their future income levels compared to a peaceful counterfactual are much more reduced than, for instance, Iceland or New Zealand that have a very low risk of future conflict. Some countries with no recent conflict history, such as France, Germany and the US, also see decrease in GDP per capita as a result of projected conflict. Armed conflict has recently affected a few large, high-income countries, for example the Basque and Northern Ireland conflicts. Spillovers from neighbouring countries with conflict risks and strong population growth along some SSPs means that intermittent conflict could affect growth in Western countries in the future.

Figure 4. Cumulative correction in SSP2 for GDP per capita by 2100, by country.
Download figure:
Standard image High-resolution imageInspecting the GDP per capita corrections by region further illustrates important differences. Figure 5 shows the corrected and uncorrected ENV-Growth projections for the five SSPs for four regions. The correction is substantial in East Africa (top left) for all the five scenarios, reflecting a high frequency of simulated conflicts in this region. For SSP4, the corrected average GDP per capita in 2100 is under half of the Dellink et al (2017), original, and the correction is almost as large for the other SSPs. The adjustments are less marked in West Africa (top right), which historically has been more peaceful than its Eastern neighbours. Likewise, the correction is even smaller in Latin America (bottom right), a region where armed conflict is approaching obsolescence 14 . In South Asia, on the other hand, our correction is again substantial. Several countries in the region, e.g. India, Pakistan, and Myanmar, have had virtually continuous conflict since independence. Our models suggest that this will continue for several decades, given their relative poverty levels and conflict history.

Figure 5. Dellink et al (2017), projections (dashed lines) and corrected projections (solid lines), (2017–2100), by region and by SSP. Top left: East Africa, top right: West Africa, bottom left: South Asia, bottom right: Latin America.
Download figure:
Standard image High-resolution imageDisaggregating further down to the country level we return to the illustrative cases shown in figure 1, to further understand how country-level differences in input data shape the outcomes.
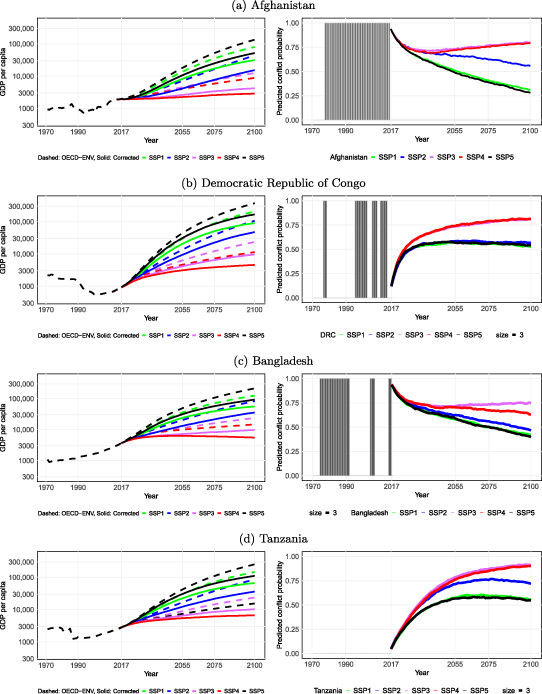
Figure 6 shows corrected and uncorrected GDP per capita and conflict for Afghanistan, the DRC, Bangladesh, and Tanzania. The left column shows the ENV-Growth (Dellink et al 2017) projections as well as these projections with our correction, for each SSP. The right column shows the conflict projections for each SSP.
Figure 6. Historical observations and projections, individual countries.
Download figure:
Standard image High-resolution image
All four countries are all low- or lower-middle income and have a high projected probability of armed conflict. The corrections for Afghanistan and the DRC have considerable face validity. Afghanistan, for example, has been continuously at war for forty years and may conceivably continue to be so for many decades. If the war takes off 2% annually from the real growth potential of the country, the loss easily accumulates to in excess of 80% loss over a century. The conflict predictions for Bangladesh and Tanzania are pulled up by their large population sizes and low income levels. Toward the end of the century, all these countries are forecasted to see more than 25 deaths in 75% of the years under the pessimistic scenarios SSP 3 and 4. Under the optimistic scenarios, the simulations yield conflict in about half of the years. These forecasts seem high, but recall that the population in 2100 is projected to exceed 200 million in both Tanzania and DRC in SSP 3 and 4, and well over 100 million even in the low-population growth scenario. With a fixed threshold of 25 deaths in the definition of armed conflict, population size is a major predictor of conflict (Raleigh and Hegre 2009).
The income corrections for these countries are substantial. In Afghanistan under the pessimistic scenario of SSP4, Dellink et al (2017) projects an increase in GDP per capita to about 10 000 dollars by the end of the century. In the same scenario the projected income with our correction is slightly below the current levels of 2000, only a fifth of the original projection. In this scenario, our model predicts a high probability of continued conflict, given strong population growth and little expansion of education, and as such produces severely depressed growth rates. For the more optimistic scenario SSP5, where Dellink et al (2017) projects Afghanistan's income to reach the implausible value of 140 000 dollars, our correction still suggests a value about 75% lower. In this scenario, with lower population growth rates, expansions of education and thus conditions that facilitate conflict mitigation in the future, the estimated probability of conflict is far lower than in SSP4. However, our projections still take into account that the risk of conflict remains high at first, and this risk is likely to continue to shape the economic trajectory of the country for decades to come. The growth projections for Afghanistan and DRC with our correction are more realistic than the original for SSP1 and SSP5, but still likely to be overly optimistic. As the history of these countries suggest, there are also other sources of growth failures. The GDP per capita of the DRC, for instance, fell steadily from 1970 to 1995, for instance, despite the low levels of conflict in that period.
4. Conclusion
This work improves the understanding of links between economic development and civil conflict as well as produces forecasts of future conflict burdens that are consistent with widely used climate change scenarios. We successfully model the effect of the conflict trap on economic growth over the course of the 21st century, providing a first indication of how the ENV-Growth projections of GDP per capita can be corrected for the effect of armed conflict. Globally, our corrected projections are close to 25% lower than the original at the end of the century for the most optimistic Shared Socioeconomic Pathways, and more than 30% lower in the least optimistic ones. Thus, the ENV-Growth model (Dellink et al 2017) clearly over-estimates future growth in conflict-prone countries.
As the ENV-Growth model underlies much of the existing climate change research, these proposed corrections may have substantial implications for current estimates of future adaptation and mitigation efforts. The correction is largest for currently poor and vulnerable countries with a conflict history, and suggests that the resources these societies will have available for adapting to climate change and other challenges are much lower than assumed in studies that rely on currently available projections. These revised GDP projections that include armed conflict also have implications for understanding the costs of and capacity for mitigation efforts. As armed conflict has also been shown to lead directly to armed conflict in neighbouring countries, these spillover economic effects may even have adverse effects on an international level (e.g. providing cover for terrorist activities). Thus, more importantly, the increase in conflict and resultant institutional instability can increase challenges to the attainment of global agreements and capacity for climate mitigation policy.
Accounting for the risk of armed conflict is only one among several issues that remain to be addressed in economic growth projections. There are several other governance failures that are less violent but equally growth-inhibiting, as we noted for the case of DRC above, and also exemplified by Zimbabwe and Venezuela. For long-term growth projections to be realistic, further research should also take broader governance failures into account. Also, armed conflict and other governance failures are likely to affect other core inputs to growth models. Persistent conflicts affect population health, migration patterns, and undermine education. All of these, in turn, alter the likely future growth paths of countries. While these effects will be concentrated in the countries where the conflict occurs, these effects may also be experienced regionally in countries that share borders and more generally, through changes in trade and other political spillovers.
Data availability statement
The data that support the findings of this study are openly available at the following URL/DOI: https://www.prio.org/publications/13330.
Acknowledgment
This material is based upon work supported in part by the U.S. Army Research Laboratory and the U.S. Army Research Office via the Minerva Initiative under Grant No. W911NF-13-1-0307, the MISTRA Geopolitics programme, Riksbankens Jubileumsfond programme Societies at Risk, and the European Research Council Project H2020-ERC-2015-AdG 694640 (ViEWS). The simulations were performed on resources provided by the Swedish National Infrastructure for Computing (SNIC) at Uppsala Multidisciplinary Center for Advanced Computational Science (UPPMAX). The authors would like to thank Frederick Hoyles for developing the simulation program, Remco Jansen for work on the cluster regions, Maxine Ria Leis and Hannah Frank for help with the data, and Chandler Williams for helpful comments. For more information on the ViEWS project see https://viewsforecasting.org.
Conflict of interest
The authors have no conflicts of interest to declare.
Ethics statement
All authors have seen and agreed with the contents of the manuscript and there is no financial interest to report.
CRediT statement
Kristina Petrova: Validation, formal analysis and theory, data curation, writing, and visualization. Gudlaug Olafsdottir: Formal analysis and theory, data curation, writing, and visualization. Håvard Hegre: Conceptualization, methodology, validation, formal analysis and theory, writing, project administration, and funding acquisition. Elisabeth Gilmore: Conceptualization, formal analysis and theory, writing, and funding acquisition.
Footnotes
- 4
The SSPs were developed by the climate change research community to harmonize the assumptions that modellers make in developing projections of the costs of mitigation and adaptation to climate change. In addition to GDP, the SSPs define alternative bounding scenarios for variables such as population and education.
- 5
In this article, we only discuss the Dellink et al (2017) since data for the other projections proved difficult to obtain.
- 6
See supplemental information A-1 for a review of these studies.
- 7
A detailed discussion of the covariates and the estimated coefficients are found in supplemental information A-2.
- 8
See the supplemental information for details on the modelling (A-2), on the simulation procedure (A-3), as well as detailed estimation results (A-4).
- 9
The chosen value for the decay of the fixed effects implies a rate of change in countries' fundamental social, economic and political structures between the faster changes seen in East Asia or oil-producing Arab countries from the 1960s to today and slower changes observed in the structures of countries in North Africa or Latin America. This assumption of slow convergence is a conservative assumption. Countries that are currently poor will grow more rapidly than under a no-convergence assumption and will therefore have less conflict, and consequently have a smaller GDP correction. This also avoids assuming that historical differences are permanent (no convergence), which is also in line with Dellink et al (2017) where convergence plays an important part of their model.
- 10
- 11
The results for the remaining conflict models are reported in supplemental information A-4.
- 12
That is, we assume that the 'temporal fixed effects' for the 2011–16 period in table A-3 and the detailed tables in supplemental information A-4 are the ones guiding the simulations. The underlying conflict propensity was higher in the last decade with data than in the preceding five-year periods.
- 13
Since we are using more elaborate and credible projections for education (KC and Lutz 2017) than Hegre et al (2016), the forecasts for SSP 3 and 4 are somewhat more optimistic than the previous study. The forecasts for SSP 1, 2, and 5, on the other hand, are relatively more pessimistic, since we here include the corrected growth projections in the conflict forecasts.
- 14
Note that the organized criminal violence in the region mostly falls outside our definition of armed conflict (Allansson et al 2017).
Supplementary material (1.4 MB PDF)