

Abstract
Hydraulic fracturing (HF) and horizontal drilling have revolutionized the fossil fuel industry by enabling production from unconventional oil and gas (UOG) reserves. However, UOG development requires large volumes of water, and subsequent oil and gas production from both conventional and unconventional wells generate large volumes of produced water (PW). While PW is usually considered a waste product, its reuse may lessen demand for freshwater supplies, reduce costs for transportation and disposal, and reduce the risks for injection-induced seismicity. Whether this water is disposed of or treated and reused, both methods require significant amounts of energy. The objective of this study was to identify the primary energy demands of alternative water management strategies, and to characterize and quantify their geographic variability in four oil and gas producing basins in New Mexico using a single year of production. Results illustrate the importance of each component of each produced water management strategy in determining its total energy footprint. Based on 2015 production and water use data, the energy to extract fresh groundwater for hydraulic fracturing (34 GWh-th yr−1.) exceeds the energy that would be required if the same volume of PW were treated chemically (19 GWh-th yr−1.). In addition, the energy required to transport fresh water and dispose of PW (167 GWh-th yr−1.) is far greater than that required to move treated PW (8 GWh-th yr−1.) to a point of reuse. Furthermore, transportation distances, which contribute significantly to the total energy footprint of a given management strategy, are underestimated by nearly 50% state-wide. This indicates that reuse may be an even more energy efficient way to manage PW, even with energy-intensive treatment strategies like electrocoagulation. Reuse of PW for HF is not only more energy efficient than conventional management techniques, it also reduces both demand for scarce fresh water resources and use of disposal wells. By evaluating components of each management strategy individually, this work illustrates how the energy footprint of regional PW management can be reduced. The advent of UOG recovery in the last decade highlights the need to understand existing water management in the industry, identify opportunities and strategies for improvement, and recognize that these dynamics are likely to change into the future.
Export citation and abstract BibTeX RIS
1. Introduction
Virtually all aspects of fossil fuel energy production and are tightly coupled to water resources [1]. The oil and gas (O&G) industry is especially influenced by water resource considerations where water is used for well drilling and completion, dust suppression, reservoir pressure management, enhanced oil recovery (EOR), and increasingly for hydraulic fracturing (HF)to allow development of unconventional oil and gas (UOG) reserves. In this paper UOG refers to oil and gas reserves in shale and tight sand formations as well as gas resources associated with coal formations and produced as coal bed methane (CBM).
Currently, more than half of crude oil and natural gas produced domestically is from UOG reserves [2]. HF allows development of low permeability UOG reservoirs (shalegas and tight oil) [3] and increased CBM gas flow in coal formations. However, HF requires substantial quantities of water, between 15 300 m3 and 19 400 m3 for oil and gas wells, respectively [4]. Subsequent O&G production also generates large volumes of flow-back of hydraulic fracturing fluids (HFFs) following well completion and formation water during O&G production [5]. Collectively these waters are referred to as produced water (PW) and represent the largest volume waste stream in the industry [6–9]. Nationally, most PW generated onshore is injected into Class II wells (EOR (46%), SWD (40%)) while a small fraction (<1%) is reused [9].
Produced water is usually considered a waste product because of its high salinity and complex chemistry [6–10]. However, in arid regions like NM, escalating demand for fresh water for UOG recovery [10–12, 14–15] has led to increased interest in reuse opportunities [1, 17]. Reuse of PW also has the potential to minimize disposal costs and the reduce potential for induced seismicity associated with disposal wells [10, 16]. Also, the risk of transportation accidents, spills and environmental contamination are of increased public concern [17–19].
Water management decisions in the O&G industry are based primarily on freshwater availability, PW volumes, and costs [6, 8–10, 15]; energy requirements for these activities as a whole are seldom considered. Energy is required for extraction, treatment, and conveyance of water; however, most studies have focused on use of high quality fresh water [1, 20–23]. Increasingly the O&G industry is turning to low-quality (i.e. high-salinity) water in lieu of expensive fresh water [15, 24–25]. Previous studies have considered PW treatment and energy requirements [13, 26–30], water used for unconventional O&G development [4, 7, 31–33], and PW management [8–10].
The objective of this research was to quantify and compare energy requirements for three water supply and management strategies for four basins in New Mexico. This work adds to the growing body of PW literature by characterizing tradeoffs between energy requirements for alternative PW management strategies and considers how these requirements vary geographically based on access to fresh water and opportunities for disposal and reuse. A distributed spatial approach to quantifying and comparing energy requirements highlights variability and allows for comparison over large geographic regions [4, 23, 31–32]. Although demonstrated in New Mexico, the general method for characterizing energy required to manage PW using GIS analysis, processing and interpretation of large databases, and incorporation of energy metrics to facilitate this comparison has broad applicability in other settings.
2. Methods
2.1. Site Description
New Mexico has large and diverse O&G reserves, located in four regions (figure 1). The two largest basins, both geographically and in terms of energy reserves, are the Permian Basin in southeastern NM and the San Juan Basin in northwestern NM. The Permian predominantly produces oil whereas the San Juan is mainly gas-producing. Unconventional oil (Permian) and gas (San Juan) comprise the majority of undiscovered reserves in both basins [34–35]. Although predominantly the Raton Basin in northeastern NM produces coal bed methane (CBM) and the Bravo Dome produces CO2, both also produce lesser quantities of oil and gas (figure 1). Extraction of all of these resources generates produced water, but production of oil (figure 2(a)) and gas (figure 2(b)) statewide is increasingly from horizontal wells [36], which in turn generate an increasing fraction of the total volume of PW (figure 2(c)).
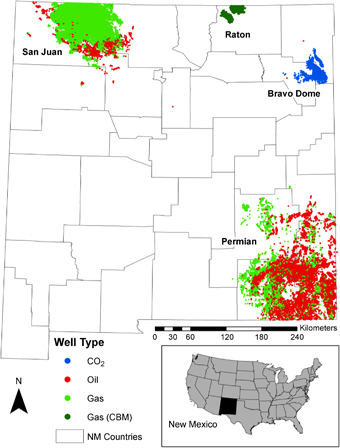
Figure 1. Geographic distribution of oil, gas, coal bed methane (CBM), and CO2 wells and producing basins in New Mexico.
Download figure:
Standard image High-resolution image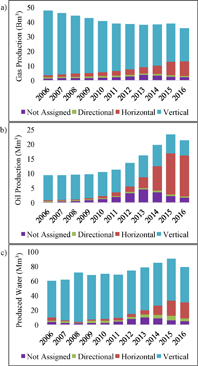
Figure 2. Production volumes of (a) natural gas, (b) oil, and (c) PW by well type and year from wells in New Mexico from 2006–2016. Directional wells include those designated as multilateral. Not Assigned wells lack directional status in the state database [36].
Download figure:
Standard image High-resolution image
Figure 3. Conceptual model of water types and flow for three management strategies: (1) procurement and transportation of fresh water for HF and subsequent disposal of PW in SWD wells, (2) treatment, transportation, and reuse of PW for HF, and (3) transportation and reuse of PW for EOR.
Download figure:
Standard image High-resolution imageIn 2015, New Mexico produced nearly 24 million cubic meters (Mm3) of crude oil and 40 billion cubic meters (Bm3) of natural gas, representing 4–5% of current domestic production [2]. It is estimated that the state contains more than 230 Bm3 of crude oil, 400 Tm3 of natural gas, and 125 Mm3 of natural gas liquids, representing between 4 and 5% of domestic reserves [37].
In an arid region like New Mexico the use of fresh water for HF can impact scarce fresh water resources. In 2015, more than 28 Mm3 of water were used for HF [36], comparable to the volume of fresh groundwater water withdrawn for public supply in the major O&G producing counties in the Permian Basin [36, 39]. Nearly three times this amount was generated as PW (90 Mm3) [36] and nearly all was either disposed of in SWD wells or reused for EOR. Reuse of PW offers the dual benefits of reducing both demand for fresh water and disposal costs. But the energy required to transport and treat this water may exceed that required for simple disposal. These energy requirements depend on many factors including demand for reuse water, the location of PW and reuse demand, and the water quality and subsequent treatment needed for reuse.
This study quantified the energy required to manage PW in O&G basins in New Mexico by calculating the energy requirements of each component for alternative water supply/management strategies. Methods included use of spreadsheets and GIS analysis to calculate the energy requirements based on the energy intensities of unit processes described below. In order to compare the electricity required to power pumps and treatment systems with gasoline consumed during the transportation of produced water, we converted all energy requirements to a consistent unit of measure using primary (thermal) energy in kilowatt-hours (kWh-th). Compared to end-use energy (the amount of energy consumed at a point of use), primary energy accounts for heat and energy lost during the generation and transmission of electricity [38]. We assumed a hypothetical coal-fired power plant that generated and delivered electricity at 33% efficiency (1 kWh-thelectricity = 10 339 Btu) [38]. Because transportation energy is dependent on the total volume of fuel consumed, which includes efficiency losses during combustion, the total energy content of diesel fuel is considered (1 kWh-thdiesel fuel = 3412 Btu). These values were normalized by dividing by the volume of water used or produced (kWh-th m−3). Monthly production data from oil and gas wells producing within the last 10 years (∼54 000) and HF data collected for the last five years were analyzed energy intensities were evaluated at 90 km2 township-range (TR) scale, which coincides with O&G pool designations in the state.
The management strategies considered were (see figure 3): (1) procurement and transportation of fresh water for HF and subsequent disposal of PW in SWD wells, (2) treatment, transportation, and reuse of PW for HF, and (3) transportation and reuse of PW for EOR. Although the third strategy is a combination of the first and second strategies, it represents common practice both nationally and in NM [9, 36].
2.2. Data sources and analysis
The NM OCD compiles monthly production data from O&G producers [36]. Table 1 shows the average annual oil, gas, and water production by basin between 2006 and 2016. Most O&G production over this period was from conventional vertical wells which, on average, produce roughly 2–4 times more water per unit of hydrocarbon compared to unconventional oil wells.
Table 1. Comparison of average oil, gas, and water production by basin, 2006–2016 [36].
| Well location and well type | Number of gas wells | Gas (Mm3) | Natural gas (Mm3 MBOEa) | Produced water (Mm3) | Produced water: natural gas (Mm3: Mm3 BOEa) | Number of oil wells | Oil (Mm3) | Produced water (Mm3) | Produced water: oil (Mm3:Mm3) |
|---|---|---|---|---|---|---|---|---|---|
| Producing basin | |||||||||
| Bravo dome | N/A | N/A | N/A | N/A | N/A | 3 | 0.01 | 0.01 | 1.72 |
| Permian | 7080 | 5583 | 32.84 | 4.52 | 0.14 | 26 870 | 12.81 | 63.86 | 4.98 |
| Raton | 841 | 709 | 4.17 | 1.53 | 0.37 | N/A | N/A | N/A | N/A |
| San Juan | 21 536 | 22 854 | 134.43 | 3.10 | 0.02 | 2133 | 0.37 | 0.45 | 1.21 |
| Well type | |||||||||
| Not assigned | 596 | 852 | 5.01 | 0.64 | 0.13 | 1744 | 1.82 | 4.63 | 2.54 |
| Directionalb | 453 | 817 | 4.81 | 0.30 | 0.06 | 510 | 0.32 | 2.80 | 8.84 |
| Vertical | 27 418 | 25 400 | 149.41 | 7.81 | 0.05 | 24 107 | 7.04 | 50.12 | 7.12 |
| Horizontal | 990 | 2077 | 12.22 | 0.40 | 0.03 | 2649 | 4.02 | 6.78 | 1.68 |
aBOE = 170 m3. bIncludes both directional and multilateral wells.
Water supply for HF comes almost exclusively from freshwater sources [14]. Counties overlying the Permian and Bravo Dome basins rely almost entirely on groundwater for all sources of water including irrigated agriculture and domestic and public supply, whereas the San Juan and Raton basins mainly use surface water for irrigation [39]. Water withdrawn for HF comprises a small fraction of total water withdrawals in each basin, ranging from near zero to less than 3%. Nearly all water withdrawn for HF (94%) occurs in the Permian which also generated more than four times the volume of PW than the other three basins combined [36].
The quality of PW is one of the most important factors when considering whether it can be reused. The state maintains a database of nearly 10 000 PW quality measurements in NM [40]. Although it contains information on total dissolved solids (TDS) and electrical conductivity (EC) for half of these samples, little data is available on other physical or chemical parameters that could be used in treatment technology and process selection.
Location of supply, production and disposal wells is important to PW management because it introduces logistical considerations, principally transportation of water for HF,EOR, and disposal in SWD wells. The 'Near' tool in Arc GIS 10.1 [41] was used to select the nearest wells by type and calculate the distance between them. Median distances between producing wells and EOR or SWD injection wells are shown in figure 4. Although well ownership or injection capacity may limit injection volumes for SWD and EOR wells, distance was the only factor considered in this analysis.
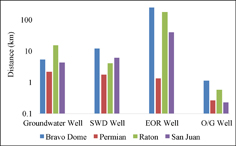
Figure 4. Median distance (km) by well type and producing basin in New Mexico.
Download figure:
Standard image High-resolution image2.3. Energy requirement metrics
The metrics considered in this study were the energy required for fresh water pumping and transportation, and energy for PW transportation, treatment, and disposal. The number of HF wells peaked in 2013 but the average volume of water used for HF increased by nearly an order of magnitude from 2012–2016 as the industry increasingly switched to horizontal wells [36]. In 2015, wells used 28 000 and 37 000 m3 of water per well for HF in the San Juan and Permian Basins, respectively [36]. Average county-wide HF water use was used to estimate fresh water demand for HF for a single well within that county in order to quantify potential extraction and transportation energy. State wide, more than 97% of PW is disposed of in Class II injection wells [36]; more than half is disposed of in SWD wells and the rest is used for EOR. The only treatment for water that is injected is usually filtration to remove suspended solids thus no energy use is assessed for treatment prior to PW disposal. Energy for transportation is based on distance to the nearest well (fresh groundwater, O&G, or SDW well). Additional information pertaining to the components of these metrics and total scenario energy (E) are described in table A1 available at stacks.iop.org/ERL/13/024008/mmedia.
Scenario 1: Conventional Disposal
Energy requirements for conventional PW management (EC) includes that needed to obtain fresh water for HF and for disposal of PW.

Where energy for treatment (RPW), transportation of PW to a well for HF (TfPW), idling and injection of the PW into the well (IPW), and the return trip of the empty truck to the producing well (TePW). Although solids disposal is a component in PW treatment, it is a very small volume compared to liquid waste [42] that incurs negligible energy costs and was not included in this analysis.
Scenario 3: Enhanced Oil Recovery (EOR)
Approximately half of the PW in NM is used for EOR and the energy required (EEOR) is that used for transportation and the energy consumed while tanker trucks are idling. This is represented by the equation:

Where the energy for truck transportation of PW (TfPW) to the EOR well, idling and injection of the PW (IPW), and the return trip of the empty truck (TePW). Note that EOR is not widely used outside of the Permian.
2.3.1. Fresh water acquisition
Fresh water for O&G development in NM is primarily obtained through leases from agricultural enterprises [43] by temporary permit through the Office of the State Engineer (OSE).Wells in the OSE database [44] were filtered to include only wells identified for either agricultural or O&G use.5 The energy required for fresh water pumping is based on dynamic head [23], flow rate (annual diversion specified by NM OSE [44]), and pump efficiency.

Pumping energy (PF) depends on flow rate (q) [L3/T], density of water (ρ) [M L−3], gravity (g) [L/T2], dynamic head [L], and pump efficiency (η), assumed to be 65% [23]. Annual energy requirements (kWh-th) are calculated assuming the pump operates year-round (8760 hours). Because not all water from a given well would be used for HF, pumping energy (kWh-th m−3) was applied only to the fraction of the well's permitted volume withdrawn for HF.
2.3.2. Transportation
Transportation of water is a major component of O&G production in NM and elsewhere. This includes transportation of fresh water to HF operations, and transportation of PW to EOR and SWD wells and total distances vary by basin in NM (figure 4). In addition, empty trucks must return to respective wells to pick up more water. We assumed standard tanker trucks (30.28 m3 capacity) [28] are used to haul both fresh and PW and corresponding diesel fuel efficiencies of 2.5 and 3.4 kilometers per liter (kpL) of fuel [45] were used for full and empty trucks respectively. Total diesel consumed was used to calculate energy required (1 L diesel fuel = 10.6 kWh-th (36 167 Btu) [46].
On average, a single HF operation New Mexico requires more than one thousand water-hauling trips [28, 36]. Because HF operations occur over a short time (days to weeks) and water is needed on-site at the start of the process, traffic congestion is a consideration. We assumed that idling accounted for 5% of vehicle fuel consumption at a fuel consumption of 3.8 L hr−1 [45–47].
2.3.3. Treatment
Produced water quality, especially its salinity (TDS), varies widely across basins and will determine its potential for reuse and the degree of treatment required for reuse and disposal options. Median TDS in the San Juan is less than 15 000 mg L−1 in contrast to the Permian where it exceeds 100 000 mg L−1 [40]. Numerous studies have evaluated the energy and cost associated with desalination of PW [13, 25–28]. However, minimally treated PW is widely used for EOR because wells are typically older and nearing the end of their productive life span. Advances in HF fluid chemistry and fresh water blending allows use of lower quality water for HF [24–25] although additional treatment is required to reduce fouling. PW with an average TDS of 190 000 mg L−1 was reported in the Marcellus [24] and PW with TDS greater than 200 000 mg L−1 has been reused for HF in the Permian Basin [15, 25].
Treating PW for HF reuse generally involves removal of oil and suspended solids, and as well as softening to reduce scale forming potential [13, 28] which could lead to fouling. Removal of suspended solids through coagulation and flocculation can be accomplished by addition of chemicals such as alum or ferric chloride, or through electrocoagulation, which initiates coagulation by applying an electrical current. It is particularly effective in high salinity waters with high electrical conductivity [25–26, 28].
We compared conventional chemical coagulation with electrocoagulation to treat PW prior to reuse for HF. Between 0.68 and 0.72 kWh-th m−3 for conventional water treatment [48] and 39–100 kWh-th m−3 are required for electrocoagulation based on the electrical conductivity (EC) of the water [28]. Most existing water quality data are for the Permian and San Juan Basins, with little or no data available for Raton Basin and Bravo Dome waters [40]. Because of the limited data, inverse distance weighted (IDW) interpolation was used to estimate TDS and EC of PW for each TR [30, 41].
Solids removed by the treatment process require disposal, however, this volume of waste is very small. These solids are disposed of in lined evaporation ponds which do not require any solids removal until the pond is taken out of service and closed. Accordingly, the energy required for solid waste management is small and was not considered in this study.
2.3.4. Injection disposal
The NM OCD database of Class II injection wells includes monthly volumes and injection pressures, as well as maximum allowable pressure which depends on well depth [36]. We assumed that disposal will occur at the closest well and calculated well utilization (U) (equation 5) and truck idling time (t) (equation 6) [49]:


Because of the large depths and resulting hydrostatic pressure little pumping is required for injection wells. Therefore, injection energy was not considered in this analysis. However, as more water is injected into a well, the injection pressure and well utilization (U) both increase resulting in slower injection rates and longer injection times which translates to longer idling times for the tanker trucks.
3. Results
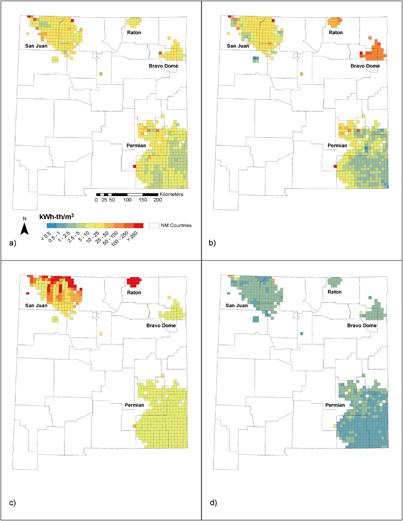
The goal of this analysis was to quantify energy requirements of alternative water sources and management strategies in the O&G industry, and to compare energy requirements for fresh water HF to those for PW reuse. Toward this goal, energy requirements per unit volume (kWh-th m−3) of PW, based on alternative management strategies, are mapped at the TR level for the state of New Mexico in figure 5 (a–d). Warm colors indicate higher energy requirements. While the values mapped in all four figures are measures of energy requirements, they are influenced by production well density and the presence of disposal wells. The Raton and Bravo Dome basins together contain only a dozen SWD wells and no EOR wells, hence transportation for disposal or reuse are high.
Figure 5. Treatment energy requirements in kWh-th m−3 by TR boundary and basin for (a) use of fresh water for hydraulic fracturing and disposal of PW (Scenario 1), (b) reuse of PW in EOR wells (Scenario 3), and (c) chemical and (d) electrocoagulation treatment of PW and reuse for hydraulic fracturing (Scenarios 2(a) and (b)).
Download figure:
Standard image High-resolution image
The data suggest that, regardless of management method, energy requirements for PW management in the Permian Basin are lowest for all scenarios (figure 5(a–d); table 2). Use of fresh water for HF requires 2–6 times more energy than chemical treatment and reuse of PW for the same purpose (table 2). Reuse of PW for EOR (Scenario 3, figure 5(b); table 2) is lowest in the Permian, resulting from widespread EOR activities and short distances to EOR wells (1.3 km) (figure 4). Because median distances to producing wells are small in all four basins, energy estimates for reuse (Scenario 2b), are influenced more by PW quality (figure 5(d)). The energy required for chemical treatment is less than that for electro coagulation, which reflects a tradeoff between chemical costs and energy costs (figure 5(c–d)). When the least energy intensive treatment method is selected, treatment and reuse of PW requires less energy than use of fresh water which provides further incentive to limit demand for fresh water resources.
Table 2. Comparison of annual energy requirements (kWh th m−3 yr) for PW by basin and scenario.
| Scenario | Energy requirements (kWh th m−3yr) | Bravo dome | Permian | Raton | San Juan |
|---|---|---|---|---|---|
| 1 | Fresh water pumping | 0.83 | 0.78 | 1.15 | 1.96 |
| Fresh water transportation | 1.34 | 0.55 | 3.97 | 1.09 | |
| Fresh water transportation—idlinga | 0.22 | 0.22 | 0.22 | 0.22 | |
| Transportation of produced water to SWD | 3.63 | 0.48 | 1.06 | 2.57 | |
| Injection of produced water into SWD wella | 0.24 | 0.22 | 0.22 | 0.29 | |
| Scenario 1 total | 6.26 | 2.26 | 6.64 | 6.13 | |
| 2 | Treatment of produced water—chemical | 0.67 | 0.67 | 0.67 | 0.67 |
| Treatment of produced water—EC | 5.03 | 5.17 | 1104.67 | 30.77 | |
| Transportation of produced water to O/G well | 0.33 | 0.07 | 0.15 | 0.09 | |
| Injection of produced water into O/G wella | 0.24 | 0.22 | 0.22 | 0.29 | |
| Scenario 2a total: chemical treatment | 1.23 | 0.96 | 1.04 | 1.04 | |
| Scenario 2b total: EC treatment | 5.60 | 5.47 | 1105.04 | 31.14 | |
| 3 | Transportation of produced water to EOR | 70.48 | 0.37 | 46.20 | 14.16 |
| Injection of produced water into EOR wella | 1.24 | 1.55 | 1.31 | 2.33 | |
| Scenario 3 total | 71.72 | 1.92 | 47.51 | 16.49 |
aReflects the amount of fuel energy consumed while trucks are idling during filling and emptying of both fresh water (IF) and produced water (IPW).
Transportation is the greatest contributor to the energy footprint of each produced water management strategy state-wide, particularly when given a choice between treatment techniques (table 2). When distances between producing wells (n = 25) and SWDs are compared to measured road distances using ESRI (2014) orthographic imagery, actual travel distance is underestimated by more 26%–54% (table A2). Although this translates to a range of less than 1 km in the Permian to more than 10 km in the Bravo Dome basins, these results indicate that reuse is even more favorable state wide as compared to conventional PW management.
Although transportation to SWD wells comprises much of the energy for conventional management, it is far exceeded by the energy for electrocoagulation treatment of PW in the San Juan and Raton Basins. This is due to the lower electrical conductivity of PW as compared to that in other basins (table 2). In higher salinity waters of the Bravo Dome and Permian basins, treatment and reuse of PW is more favorable. Because electrochemical coagulation requires more energy in fresh water, an economic analysis may show that conventional chemical treatment is cheaper in the Raton Basin where water quality from CBM production has low TDS [6]. This finding illustrates the need to consider both costs and end-use energy requirements when considering PW management.
This study characterizes the energy requirements for each step of produced water management for three scenarios in four energy producing basins in New Mexico. This approach allows for comparison both within and between PW management strategies as well as in the context of the state's energy-water footprint. In 2015 PW was not widely reused, and the majority of the nearly 28 Mm3 of mostly fresh water was used for HF [36] in the Permian Basin where groundwater levels have been declining due to over pumping for agriculture and public supply. Fresh water pumping for HF required roughly 11 GWh yr−1. (34 GWh-th yr−1.) of end-use energy for groundwater pumping or between 1%–2% of total state-wide energy use for groundwater pumping energy [23]. Comparing the total volume of water associated with O&G production and the water required to manage it in 2015 (table A4), the energy to extract fresh groundwater for hydraulic fracturing (34GWh-th yr−1.) exceeds the energy that would be required if the same volume of PW were treated chemically (19 GWh-th yr−1.). In addition, the energy required to transport fresh water and dispose of PW (167 GWh-th yr−1.) is far greater than that required to move treated PW (8 GWh-th yr−1.) to a point of reuse. When disposal energy is considered, reuse is nearly ten times more energy efficient than conventional management. In the Permian Basin, where both the majority of PW is generated and HF occurs, both treatment and reuse strategies (Scenario 2(a–b)) are more energy efficient than conventional management (Scenario 1). Because transportation distances may be underestimated by as much as 50%, reuse may be even more energy efficient.
3.1. Analysis limitations
There are several limitations of this study that will be addressed in future work. Transportation, treatment energy, supply and demand rely on assumptions that would need to be refined should these characterizations be used determine management strategies for individual wells.
The first limitation is that transportation energy estimates are based on straight line rather than actual road distances because information on routes, topography, weight limits and other factors are not known. Transportation energy increases linearly with distance but sensitivity analysis revealed that distance is underestimated in all basins. A more detailed routing analysis would likely result in more energy required for the transportation for all scenarios. While pipeline conveyance would more closely adhere to straight line distance estimates, topography, land ownership, and climate would need to be considered in order to justify the up-front costs of laying pipe.
The second limitation is that treatment energy is estimated based on limited treatment methods and generalized energy requirements. Desalination of PW is not practiced in NM except at a very small scale because its very high salinity and complicated chemistry make it extremely difficult and costly to treat. We do not believe that desalination of PW is likely to occur on a large scale in the foreseeable future in NM. Chemical treatment energy is estimated using data from municipal wastewater treatment plants, which is likely less than mobile treatment systems due to economies of scale. In addition, delivery of treatment chemicals to remote locations will require more energy than to municipal treatment facilities.
Another limitation of this study is that it does not account for supply and demand dynamics that occur over time. The selection of the nearest well is not constrained by whether the fresh water withdrawn from multiple wells exceeds permitted availability. Likewise, the capacity of SWD and EOR wells is not accounted for. In addition, supply and demand time scales are not easily matched: HF occurs over days or weeks and PW generation which occurs over many years. Competition for fresh water, disposal space, and PW available for reuse would likely result in longer travel distances to wells with available water or disposal space. These shifting dynamics will impact both reuse opportunities and energy requirements for produced water.
Increased production from UOG wells will affect PW management. Although the amount of water produced per unit of oil or gas is less for UOG wells than for conventional wells, much more water is needed to hydraulically fracture UOG wells. In basins like the Permian with multiple stacked shale plays, wells can be tightly spaced. As a result, demand for fresh water for HF will likely be more concentrated, but PW volumes will be less compared to that generated from the same number of conventional wells. Furthermore, declines in conventional production will impact PW volume as well as opportunities for reuse for EOR.
4. Discussion and summary
The objective of this study was to quantify and compare the differences in energy requirements for three O&G water management strategies: fresh groundwater withdrawn for HF with subsequent disposal of PW, and two PW treatment, reuse, and disposal scenarios. The energy components of these management scenarios included in this analysis were pumping of fresh water, transportation of fresh and PW, treatment of PW, and disposal or reuse of PW. Four O&G regions in NM were considered, each with different production characteristics consisting of predominantly shale oil, shale gas, CO2, and coal bed methane. The median energy requirement per unit water (kWh-th m−3) was mapped at an approximately township and range (TR) (90 km2) scale.
Key findings of this study are the identification and quantification of tradeoffs between alternate PW management strategies in New Mexico. First, transitioning from fresh water to reused PW for HF offers significant energy savings when transportation energy is included. While EOR is not a viable management technique in all basins, where conventional oil production is widespread, reused PW is a viable alternative to fresh water. Lastly, this study illustrates how each component of these management strategies contribute to their overall energy footprint, thus identifying areas where regional PW management energy can be reduced.
Produced volumes, management strategies, and energy requirements vary markedly throughout the country. This analysis provides a comparison of the energy requirements for the major water supply and PW management strategies. Additional factors such as change in production of O&G, competition for fresh water resources, equipment, and disposal well space also influence PW management strategies. This work sets the basis for future research which will allow for the incorporation of these factors.
The method for quantifying energy requirements for O&G water management strategies described here is applicable to other industries that depend on transportation, water supply, wastewater production, wastewater treatment and disposal, notably extractive industries such as mining.
The large energy requirements for water management by the O&G industry partly explains the shift away from freshwater use and SDW disposal towards reuse. In March of 2015, the NM OCD issued new regulations which allowed for increased storage of PW prior to treatment, reuse, and/or disposal. In the following five months, more than a dozen permits for new containment and recycling facilities were submitted [50] even though oil prices dropped by more than half during the same period. Currently, there are more than 50 permits [50], for both the San Juan and Permian basins [50]. This experience shows that factors other than cost and energy requirements influence management decisions, but also demonstrate industry's interest in reducing its impact on freshwater supplies by utilizing innovative treatment, reuse and disposal alternatives.
Acknowledgments
The authors would like to acknowledge the very valuable information and insight provided by the New Mexico Energy Mining and Minerals Department and the Oil Conservation Division staff as well as the comments provided by two anonymous reviewers. Funding for this research was provided by New Mexico's Experimental Program to Stimulate Competitive Research (EPSCoR), NSF Award #IIA1301346 and the UNM Center for Water and the Environment, an NSF funded Center for Research Excellence in Science and Technology (CREST), NSF Award #1345169.
Footnotes
- 5
Use Types Included: AGR (Agricultural use other than irrigation), IRR (Irrigation), OFM (Oil field maintenance), OIL (Oil production), SRO (Secondary Recovery of Oil), STK (Stock) (NMOSE, 2016).