

Abstract
The continuous rise in the global demand for palm oil has resulted in large-scale expansion of industrial oil palm plantations—largely at the expense of primary and secondary forests. The potentially negative environmental impacts of these conversions have given rise to closer scrutiny. However, empirical data on the effects of conversion of forests to industrial oil palm plantations on soil organic carbon (SOC) stocks is scarce and patchy. We evaluated the changes in SOC stocks after conversion of tropical forest into oil palm plantations over the first and second rotation period in Sarawak, Malaysian Borneo. Soil samples were collected from three age classes of oil palm plantations converted from forest (49, 39 and 29 years ago respectively) with three replicate sites and four adjacent primary forest sites as reference. In each site under oil palm, the three management zones, namely weeded circle (WC), frond stacks (FS), and between palm (BP), were sampled separately. All soil samples were collected from five soil layers (0–5, 5–15, 15–30, 30–50 and 50–70 cm). Samples were analysed for SOC concentration, soil bulk density, pH and soil texture. Results showed SOC stocks declined by 42%, 24% and 18% after 29, 39 and 49 years of conversion respectively. Significant differences in SOC stocks were found among different management zones in the oil palm plantations, and the trend was similar for all age classes: FS > WC > BP, demonstrating the necessity of considering within-plantation variability when assessing soil C stocks. The largest differences between SOC stocks of the reference forest and converted plantations were found in the topsoil (0–15 cm depth) but differences were also found in the subsoil (>30 cm). Our results will contribute towards future modelling and life cycle accounting to calculate the carbon debt from the conversion of forest to oil palm plantations.

Original content from this work may be used under the terms of the Creative Commons Attribution 3.0 licence. Any further distribution of this work must maintain attribution to the author(s) and the title of the work, journal citation and DOI.
1. Introduction
Tropical forests play a critical role in influencing the Earth's climate due to their important contribution to the global carbon cycle. The current rapid and extensive land use changes have made tropical forests a net source of carbon and an estimated 1.1 ± 0.7 PgC is emitted from these forests per year due to the clearing of forests for timber extraction and agriculture including plantations and pasture (Pan et al 2011).
Southeast Asia is considered a hot spot of land use changes and one of the major ongoing transitions is the replacement of forests with oil palm (Elaeis guineensis Jacq.) plantations (Stibig et al 2014). From 1990 to 2010 the area under oil palm plantations in the region expanded from 3.5 million ha to 13.1 million ha (Gunarso et al 2013, Stibig et al 2014). Malaysia and Indonesia are at the centre of this dynamic development, and these two countries together represent over 80% of global palm oil production (FAO 2016). Since the first oil palm plantation in Malaysia was established in 1917, Malaysia has been at the forefront of palm oil production, producing around 44% of the world's supply of palm oil (Alam et al 2015). Between 1990 and 2005 the area under oil palm plantation in the country increased by 1.8 million ha, of which around 55% was converted from forested areas (Fitzherbert et al 2008). About 26% (1.5 million ha) of Malaysia's oil palm plantations are located in the state of Sarawak on Borneo (MPOB 2016, Phang and Lau 2017). Despite an intensive debate about the role of oil palm plantations in global warming, the empirical evidence on their contribution to the global carbon cycle remains sparse (Ziegler et al 2012, Kho and Jepsen 2015). Studies of the effects of conversion of forests to oil palm plantations are not only sparse, but also contradictory. Accordingly, some studies have reported a soil organic carbon (SOC) stock decrease (Sommer et al 2000, Hergoualc'h and Verchot 2011, Bruun et al 2013, Chiti et al 2014) or increase (Frazao et al 2013, Goodrick et al 2015) or no change (Tanaka et al 2009, Khasanah et al 2015) following land use conversion to oil palm. These studies mostly focus on the effects of conversion of primary forests to small-scale oil palm plantations, but not to large-scale oil palm plantations that may differ in organic matter management and replantation technique and are, moreover, often the point of the debate regarding deforestation and environmental degradation in tropical areas.
Oil palm plantations are often divided into three or four management zones, leading to spatial variation in the input of organic matter. The effects of management zones on the long-term development of SOC stocks at plantation level still need to be understood. The SOC dynamics in the second rotation of oil palms will be affected by, among other things, land clearing and re-establishing practices, but the exact effects remain unquantified. Data on the vertical distribution of SOC in relation to land use change are also scant (Lorenz and Lal 2014). Wendt and Hauser (2013) emphasise the need to sample to at least 60 cm depth to avoid erroneous conclusions on changes in SOC stocks due to differences in soil compaction as a result of land use change. In the present study, therefore, it was decided to take samples from soil layers down to 70 cm.
In the current context of climate change and the increasing sustainability commitment of the palm oil sector, the objective of this study was to quantify changes in SOC stocks following conversion of forests to large-scale industrial oil palm plantations over the first and second rotation period. It was hypothesised that conversion from forests to oil palm plantations results in a decrease in SOC stocks. The specific research questions were: (i) What are the effects on SOC stocks of conversion from forest to oil palm plantations on different timescales? (ii) How do the SOC stocks in an oil palm plantation differ between different management zones? and (iii) How do SOC stocks differ with depth in both forests and oil palm plantations?
2. Materials and methods
2.1. Study site
The study was conducted in the state of Sarawak, Malaysia, in an industrial oil palm plantation (UTM zone 49 N; 415722 E; 807165 N) and in a nearby protected mixed dipterocarp rainforest (UTM zone 49 N; 417636E; 804849 N) located in the Miri division (figure 1). The area has a humid tropical climate with an average annual temperature of 27 °C and an average annual precipitation of 2710 mm (Bruun et al 2013) and elevations around 40–85 m above sea level. Soils are developed on Argillaceous sedimentary rocks and are classified as Red Yellow Podzolic soils according to the Sarawak soil classification system which translate into Ferralsols in the FAO soil classification system (Department of Agriculture 1968a, 1968b, FAO 1966).

Figure 1. Map of the study location (a); different sampling sites of oil palm plantations and forests (b).
Download figure:
Standard image High-resolution imageIn 1965 the Miri/Bintulu road was constructed, which acted as a trigger for commercial logging of the forest and oil palm plantation development. The oil palm plantations in the study sites were established after clearing of lowland mixed dipterocarp rainforest like the neighbouring rainforest. The existence of plantations of different ages in close proximity to the protected rainforest made the study location ideal for a space for time substitution study.
The protected rainforest was used as the reference for pre-conversion soil conditions assuming that initial SOC stocks of all sites under oil palm plantations were equal. A space-for-time substitution approach was used and areas sampled in their first and second rotation period, cultivated for 49 years (OP-1965/93), 39 years (OP-1975/03) and 29 years (OP-1985). OP-1965/93 was converted from forest to oil palm in 1965, cultivated for 28 years and replanted with oil palm in 1993. OP-1975/03 was converted from forest in 1975 and replanted in 2003. Similarly, OP-1985 was converted in 1985 and is expected to be replanted soon.
2.2. Management practices in the oil palm plantations
In the study sites, oil palms were planted in a staggered design with triangular spacing 9 m apart at a density of 143 palms ha−1 (figure 2). The plantations were divided into three management zones. Each palm was surrounded by approximately 2 m wide weed-free circle where fertilisers being applied (referred to as weeded circle (WC)). The area between two rows of palms was covered by pruned fronds and referred to as frond stacks (FS). The remaining area where grass and ferns grew abundantly is referred to as between palm (BP) zone. No harvesting path was present in this plantation. Yield residues, e.g. empty fruit bunches were also applied to the outer circle of the WC zone in the early stage of plantation depending on availability. Chemical fertilisers (urea:rock phosphate:muriate of potash = 1:1:1 (2–3 kg palm−1 y−1)) were applied twice a year by hand spreading in the WC and its periphery. Other fertilisers (zinc, boron, magnesium) and application rates were based on growth stage and nutrient status, as evaluated by foliar analysis.

Figure 2. Layout of one site of oil palm plantation and sampling scheme per plot.  = oil palm with weeded circle;
  = frond stack;
  = between palm. Selected three palms in one plot = A, B, C. P1, P4 and P7: weeded circle; P2, P5 and P8: frond stack and P3, P6 and P9: between palm zone.
Download figure:
Standard image High-resolution imageIn the first few years after planting, leguminous cover crops were grown to protect from erosion and maintain soil fertility. The second rotation was generally initiated 25–27 years after the first planting. The old oil palms were felled using an excavator's hydraulic boom, cut into small pieces with a sharp chipping bucket and stacked in rows and decomposed over time. Kho and Jepsen (2015) reported 20–50 t ha−1 oil palm residue can be added during the plantation's re-establishment. The new palms were planted in the areas where the FSs had previously been positioned.
2.3. Soil sampling
Soils were sampled in April–May 2014. In order to plan the soil sampling campaign, information on current and past land use and management was collected through interviews with local stakeholders. For each oil palm age class, three replicate sites were carefully selected based on similarity in soil texture, structure, elevation, absence of terracing and distance (sites were located ≤ 4 km from each other).
Four forest plots were selected in close proximity to the oil palm plantations. Three forest plots were selected in the protected forest and one in a set-aside forest (≥101,500 m2 area) plot to the west of the oil palm plantations (figure 1) to avoid spatial bias. For selecting the forest sites closeness to oil palm plantations were prioritised to ensure soil texture, elevation and slope as in the oil palm plantations. However, the plots were approximate 500 m from the edge to eliminate border effects and there were no signs of such.
At each replicate sites of forest and oil palm plantations an 18 m × 16 m rectangular plot was established. In each oil palm plot, three palms were selected and soil was collected from 70 cm deep soil pits from the three management zones around these palms (WC, FS and BP) separately (9 soil pits) (figure 2). In each forest plot, soil samples were also collected from three 70 cm-deep soil pits. Volume-specific soil samples were collected with 100 cm3 cores from five depths (0–5 cm, 5–15 cm, 15–30 cm, 30–50 cm and 50–70 cm) and used for determination of bulk density. Additional non-volume-specific soil samples were collected from the centre of all layers and used for chemical analyses. In each oil palm plot, the area of the three management zones was measured. The slope, aspect, altitude and GPS coordinates were also registered.
2.4. Soil processing, analysis and SOC stock calculations
Samples were oven-dried immediately and stones, debris and roots were separated and weighed. Soils were crushed and sieved through a 2 mm mesh and analysed at the University of Copenhagen in Denmark.
SOC (%) and nitrogen were determined by using an elemental analyser coupled to an isotope ratio mass spectrometer (PYRO Cube from Elementar, Germany coupled to an Isoprime100 IRMS, UK) (Nigussie 2017). The SOC stocks in each layer were calculated from the SOC concentration and soil bulk density according to the fixed-depth approach (Bruun et al 2013) with the following equation:
To be able to compare the same soil mass and avoid interference of bulk density changes with SOC changes, SOC stocks were also calculated according to the equivalent soil mass approach for 0–30 cm soil, as recommended by (Ellert and Bettany 1995, Bruun et al 2013). SOC stocks on a plantation basis were also calculated by the weighted average based on the area share of the different management zones.
Soil pH was determined in a 1:5 soil:water solution (Thomas 1996). Soil texture was analysed using a laser diffraction particle sizing technique (Malvern Instruments), distinguishing between the clay fraction (<2 μm), the silt fraction (2–63 μm), and the sand fraction (>63 μm).
2.5. Statistical analyses
Statistical analyses were conducted using SAS 9.4 for Windows (SAS institute, 2002–2012). Differences in SOC stocks between the forest and oil palm plantations were examined by analysis of variance (ANOVA). In the event of significance in ANOVA, means were compared by the least significant difference for multiple comparison procedures. Significance was determined at an alpha level of 0.05. Moreover, differences between the fixed-depth approach and equivalent approach were assessed. Homogeneity of variance was tested with the PROC GLM test of equality of error variance, and normal distribution was tested with the PROC UNIVARIATE test for normality. Results are reported as means ±1 SD.
3. Results
3.1. Soil characteristics
The soil profiles of the oil palm plantations had dark yellowish brown (10 YR 4/4-4/6) A-horizons of between 5 and 8 cm with gradual wavy boundaries to the underlying B horizon. The B-horizons were yellowish brown (10YR 5/6-5/8), uniform and with no rocks. The A-horizons of the soil profiles in the forest were 10–15 cm deep, dark yellowish brown (10 YR 4/6) with clear irregular boundaries to the underlying B-horizon. The B-horizons were yellowish brown (10YR 5/6–5/8), uniform and with no rocks. Table 1 shows the average values of pH, texture, bulk density and SOC concentration of soils under forest and under oil palm for different age classes and management zones. Soil pH ranged from 4.6 to 5.0 in the forest and from 4.6 to 5.8 in the oil palm plantations. Clay content in the forest soil averaged over the layers was 13% ± 7%, whereas in OP-1965/93, OP-1975/03 and OP- 1985 it was 13% ± 3%, 13% ± 7% and 10% ± 7% respectively, when averaged over layers and management zones. Bulk density showed an increasing trend with increasing soil depth in all plots. In contrast, SOC concentration declined with increasing soil depth for both forest and oil palm sites. The FS zone had the highest and the BP zone the lowest SOC concentration in all three age classes of the oil palm plantations.
Table 1. Soil physical and chemical characteristics.
| Soil texture fractions (%)b | |||||||||
|---|---|---|---|---|---|---|---|---|---|
| Sites | Depth (cm) | Bulk density (g cm−3)a | Carbona (%) | Soil pHb | Clay (<2 μm) | Silt (2–63 μm) | Sand (>63 μm) | ||
| Forest | 0–5 | 1.3 ± 0.03 | 2.5 ± 0.1 | 4.6 ± 0.1 | 8 ± 0.8 | 63 ± 3.2 | 29 ± 3.9 | ||
| (n = 4) | 5–15 | 1.4 ± 0.04 | 1.4 ± 0.2 | 4.8 ± 0.2 | 13 ± 1.9 | 62 ± 3.5 | 25 ± 4.8 | ||
| 15–30 | 1.5 ± 0.04 | 0.6 ± 0.1 | 4.8 ± 0.2 | 12 ± 1.6 | 61 ± 2.6 | 27 ± 3.1 | |||
| 30–50 | 1.6 ± 0.05 | 0.5 ± 0.1 | 4.9 ± 0.2 | 15 ± 1.1 | 68 ± 3.1 | 17 ± 2.4 | |||
| 50–70 | 1.6 ± 0.06 | 0.4 ± 0.1 | 5.0 ± 0.2 | 16 ± 1.2 | 72 ± 1.9 | 12 ± 2.7 | |||
| WC | BP | FS | |||||||
| OP- 1985 | 0–5 | 1.1 ± 0.10 | 1.9 ± 0.1 | 1.5 ± 0.3 | 2.8 ± 0.1 | 5.6 ± 0.2 | 9 ± 1.7 | 56 ± 9.4 | 35 ± 11.1 |
| (n = 3) | 5–15 | 1.3 ± 0.07 | 0.9 ± 0.2 | 0.8 ± 0.1 | 1.4 ± 0.2 | 4.8 ± 0.1 | 8 ± 0.6 | 55 ± 9.3 | 37 ± 8.7 |
| 15–30 | 1.4 ± 0.09 | 0.5 ± 0.2 | 0.4 ± 0.1 | 0.5 ± 0.0 | 4.6 ± 0.1 | 10 ± 2.2 | 52 ± 10.6 | 38 ± 12.6 | |
| 30–50 | 1.4 ± 0.12 | 0.3 ± 0.1 | 0.3 ± 0.1 | 0.3 ± 0.1 | 4.6 ± 0.1 | 11 ± 3.0 | 54 ± 12.3 | 34 ± 14.6 | |
| 50–70 | 1.5 ± 0.11 | 0.2 ± 0.1 | 0.2 ± 0.1 | 0.2 ± 0.1 | 4.6 ± 0.1 | 13 ± 4.2 | 54 ± 11.3 | 33 ± 4.1 | |
| OP- 1975/03 | 0–5 | 1.2 ± 0.11 | 1.5 ± 0.3 | 1.5 ± 0.2 | 3.1 ± 0.3 | 5.8 ± 0.3 | 10 ± 1.8 | 68 ± 6.7 | 22 ± 8.5 |
| (n = 3) | 5–15 | 1.3 ± 0.09 | 1.0 ± 0.2 | 0.9 ± 0.2 | 1.3 ± 0.2 | 5.5 ± 0.2 | 14 ± 2.6 | 75 ± 3.2 | 11 ± 2.1 |
| 15–30 | 1.4 ± 0.06 | 0.5 ± 0.1 | 0.5 ± 0.1 | 0.7 ± 0.1 | 5.2 ± 0.2 | 12 ± 1.4 | 71 ± 4.7 | 17 ± 5.8 | |
| 30–50 | 1.4 ± 0.10 | 0.4 ± 0.1 | 0.5 ± 0.1 | 0.5 ± 0.1 | 4.9 ± 0.2 | 15 ± 3.1 | 68 ± 3.3 | 17 ± 6.4 | |
| 50–70 | 1.5 ± 0.07 | 0.4 ± 0.1 | 0.4 ± 0.1 | 0.4 ± 0.1 | 4.9 ± 0.1 | 16 ± 2.9 | 74 ± 5.3 | 11 ± 6.7 | |
| OP- 1965/93 | 0–5 | 1.0 ± 0.04 | 2.7 ± 0.4 | 2.3 ± 0.4 | 3.8 ± 0.2 | 5.7 ± 0.9 | 14 ± 3.6 | 66 ± 3.2 | 19 ± 6.4 |
| (n = 3) | 5–15 | 1.2 ± 0.05 | 1.2 ± 0.3 | 1.2 ± 0.2 | 1.8 ± 0.1 | 5.8 ± 0.9 | 13 ± 3.5 | 69 ± 6.1 | 19 ± 6.0 |
| 15–30 | 1.4 ± 0.05 | 0.6 ± 0.2 | 0.6 ± 0.1 | 0.9 ± 0.2 | 5.7 ± 0.8 | 13 ± 3.3 | 59 ± 4.7 | 28 ± 6.7 | |
| 30–50 | 1.5 ± 0.07 | 0.4 ± 0.1 | 0.4 ± 0.1 | 0.4 ± 0.1 | 5.8 ± 0.8 | 10 ± 1.2 | 65 ± 7.4 | 25 ± 7.3 | |
| 50–70 | 1.5 ± 0.08 | 0.3 ± 0.1 | 0.3 ± 0.1 | 0.3 ± 0.1 | 5.8 ± 0.8 | 14 ± 2.2 | 62 ± 5.9 | 24 ± 8.1 | |
aIn the forest, BD and %C represent the average of samples collected from three profiles from four replicate sites (in each cell n = 12). For OP, BD represents the average of samples collected from nine replicate profiles of three management zones from three replicate sites (in each cell n = 27) and for %C the data are based on samples from nine replicate profiles (in each cell n = 9) from each management zones separately (WC, BP and FS) on three replicate sites. bData on soil pH and soil texture are based on the average of samples collected from one profile (0–70 cm depth) from four replicate forest sites (in each cell n = 4) and from one profile (P3) for five depths from the BP zone, which has the highest land coverage for three replicate sites (in each cell n = 3) of oil palm plantation of different age classes. Here ± denotes standard error and % represents wt%.
SOC stocks calculated by the fixed-depth approach were 5%–8% higher than when calculated according to the equivalent mass approach (figure S1 is available online at stacks.iop.org/ERL/13/105001/mmedia). However, the differences were not statistically significant. Therefore hereafter only SOC stock results calculated according to the most commonly used fixed-depth approach are presented.
3.2. SOC stocks in different management zones
On average FS, WC and BP management zones corresponded to 37 (±2.2)%, 11 (±0.7)% and 52 (±2.1)% of the area in the investigated oil palm plantations. Significant differences (p < 0.05) in SOC stocks were found between these three different management zones, and the trend was similar for all age classes: FS > WC > BP (figure 3). On average SOC stocks in the FS zone were 25% and 16% higher than in the BP and WC zones respectively. The SOC stocks of the FS zone were in all cases significantly higher than in the BP zone (p < 0.05) (figure 3). The highest SOC stocks were found in the FS zone of OP-1965/93 and the lowest were observed in the BP zone of OP-1985. In all cases, the WC zone had higher SOC stocks than the BP zone, but the difference was not significant. The SOC stocks in all management zones increased with increased age since conversion (figure 3).

Figure 3. Soil organic carbon (SOC) stocks in different management zones (WC = Weeded circle, BP = Between palm, FS = Frond stack), for different depths and age classes for oil palm. Different letters indicate significance (p < 0.05) of the SOC stock in the upper 70 cm in the different management zones per age class.
Download figure:
Standard image High-resolution image3.3. Changes in SOC stock of oil palm plantations over time
The forest soil had the highest SOC stock (79 t ha−1 in the upper 70 cm) compared to the oil palm plantations (figure 4). In general, the SOC stocks of the oil palm plantations increased with time after conversion. After 29 years of oil palm cultivation, the SOC stocks in the upper 30 cm and 70 cm were significantly (p < 0.05) lower than in the forest soil (by 36% and 42% respectively). After 39 years of oil palm cultivation, the SOC stocks in the upper 30 cm and 70 cm were 27% and 24% lower respectively than in the soil under forest, which represents a significant decline (p < 0.01). After 49 years of oil palm cultivation, the SOC stocks were only 10% and 18% lower than the forest in the upper 30 cm and 70 cm of the soil respectively, and this decline was not significant (p > 0.11) (figure 4). SOC stock increased by 18% from 29 to 39 years under oil palm, but only with 6% in the subsequent 10 years from 39 to 49 years.
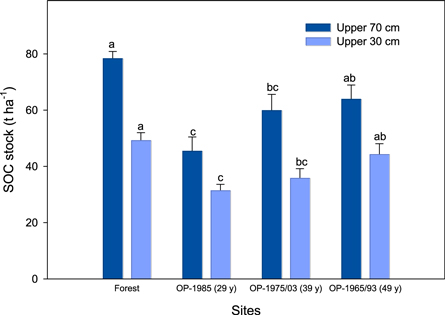
Figure 4. Total soil organic carbon stock in forest and oil palm plantations of different age classes in the upper 70 cm and 30 cm of the soil, calculated by the fixed-depth approach and according to the relative areas of the three management zones (weeded circle, frond stack, between palms). Different letters denote significant differences between groups at p < 0.05.
Download figure:
Standard image High-resolution image3.4. SOC stocks at different depths in soil under forest and oil palm plantations
SOC stocks in the upper two layers (0–5 and 5–15 cm) of the forest soil were significantly (p < 0.05) higher than in the corresponding layers of the oil palm plantations (figure 5). In these two layers the SOC stocks of the oil palm plantations increased with increasing plantation age following the sequence: OP-1965/93 > OP-1975/03 > OP-1985. In deeper layers (30–50 cm and 50–70 cm) the forest also had a (non-significantly) higher SOC stock than the plantations. In these layers OP-1975/03 had the highest SOC stock among the three age classes of oil palm plantations. The youngest oil palm class, OP- 1985, consistently had the lowest SOC stock in each soil layer.

Figure 5. Soil organic carbon stock at different depths in the soil of forest and oil palm plantations of different age classes. Different letters indicate significant differences in the same soil layer (p < 0.05) between different groups.
Download figure:
Standard image High-resolution image
4. Discussion
4.1. Changes in SOC stock over time
The findings suggest that conversion of forests to oil palm plantations is associated with a decrease in SOC stock, with the results of this study showing a 36% and 42% decrease in SOC stock 29 years after conversion from forest to oil palm in the upper 30 cm and 70 cm soil respectively. This corresponds to a total C loss of 18 and 33 t ha−1. However, SOC stocks under oil palm plantations are slowly building up during the second rotation. Several other studies have also reported that conversion from forest to oil palm plantations leads to decreases in the SOC stock of the upper 30 cm of the soil, but most of these studies assessed the early parts of the oil palm's life cycle. Guillaume et al (2015) reported the SOC stock under a 14 year old oil palm plantation to be 42% lower compared to a forest in Indonesia. In Sarawak, Malaysia, a study that evaluated the effects of a change from shifting cultivation to small-scale oil palm plantations found that SOC stocks in the upper 30 cm of the soil were 40% lower after 15 years under oil palm (Bruun et al 2013). Chiti et al (2014) reported a 28% SOC loss in the upper 0–30 cm layer after 25 years of oil palm plantations in an area converted from primary forests to oil palm plantations in Ghana. However, Khasanah et al (2015) claimed oil palm plantations in Indonesia to be carbon neutral based on a comparison of oil palm plantations of different ages up to 25 years and found no difference between the plantations, irrespective of their previous land use history. However, it is difficult to justify the carbon neutral claim, as Khasanah et al (2015) did not compare SOC stocks of the plantations to a reference/original land use, e.g. forest or non-forest.
Increases in SOC stocks with increasing age following replanting as found in this study are likely due to the incorporation of oil palm residues in the soil during plantation re-establishment. In addition, as the oil palms mature the amount of pruned fronds also increases and applying these facilitates an increase in SOC with increasing stand age (Henson 2003, Henson and Chang 2003, Frazao et al 2014). Moreover, leguminous cover crops which were grown as a protection from soil erosion following plantation establishment play a part in the SOC increase over time.
In the present study, the increase in SOC stock was not totally linear which could be due to the fact that the soil under oil palm is progressing towards an upper limit for soil carbon (Six et al 2002, Hepp et al 2018) and our assumption of initial SOC stocks of all oil palm plantations being equal (all plantations were converted from the forest) which might have influenced the results somewhat. Moreover, the growth rate of oil palm is rapid in the early years after planting, but decreases towards the end of the economic lifespan and therefore the amount of organic residues is also reduced with age. The potential effect of root dynamics on SOC stock also changes over time, thus can contribute to the SOC stock development over time. Chipping the whole palm during plantation re-establishment is crucial for sustaining the build-up of a new SOC stock, which would otherwise certainly be constrained by the smaller supply of organic inputs. This indicates that a good management practice that includes retention of organic inputs can be a substantial help in sustaining or building up new SOC stock over time.
4.2. Variation in SOC stocks between management zones
The different management zones in the oil palm plantations have different SOC stocks because of differences in C source distribution. The highest SOC stock in oil palm plantations was found in the area under FSs, which represented 37% of total land area in the plantations, and the SOC stock in the FS zone was on average 16% to 25% higher than in the other management zones. Very similar findings were reported by Aljuboori (2013), who found that the large input of pruned fronds (9.8 t-dry matter ha-plantation−1 yr−1 and 14.9 t-dry matter ha-replantation−1 yr−1) led to an increase of between 16% and 26% in the SOC stock beneath the FS over time relative to the other management zones. These findings are corroborated by other studies that who found differences in the SOC stocks of the management zones to be of a similar magnitude Frazao et al (2013, 2014) and Khasanah et al (2015), while Haron et al (1998) found smaller yet significant changes (between 0.82 and 3%) in SOC stocks between the management zones of young (5–20 year) oil palm plantations in West Malaysia.
In the present study, the FS, BP and WC zones contributed on average 50%, 41% and 9% of the total SOC stocks respectively at plantation level. The development of the SOC stocks mainly depends on how and where the FSs are placed. If the FSs are evenly spread in the inter-row they contribute more to the accumulation of SOC because of the large area coverage, facilitation of their decomposition and subsequent transfer of dissolved or particulate organic C to the mineral soil (Haron et al 1998). Alternatively, if the inter-row is kept free from FSs and they are placed in the form of large piles between the palms, then they will contribute less to the build-up of SOC and the spatial variation in SOC stocks would increase (Law et al 2009, Frazao et al 2013). In contrast to the FS zone, the WC zone, which makes up just 11% of the whole plantation, is less prone to SOC variation due to the limited management related organic inputs and the SOC stock in the WC zone in the present study must have been largely derived from root materials. According to Jourdan and Rey (1997) and de Carvalho et al (2014), the amounts of fasciculate (fine) surface roots are higher in the WC because of the radiative pattern of root growth and N fertilisation. Fine root growth increases with stand age and thus can contribute to the SOC stock development under this management zone. In the present study, the BP zone had the lowest SOC stock at all sites because it is kept free from deposition of any kind of organic inputs except from aboveground cover by grasses and some ferns and also from extended roots as oil palm roots spread along 640 cm horizontally (Safitri et al 2018). However during replantation, palms were planted in new rows, so the WC and BP zone may have been placed in areas that were previously under FSs and therefore the WC and BP zone of OP-1965/93 and OP-1975/03 had higher SOC stocks than OP-1985.
4.3. SOC stock in different soil depths
The SOC stock of topsoil layers under oil palm plantations was lower than under forest reference sites. The greatest difference between the reference forest and the plantations was found at the 5–15 cm depth. Chiti et al (2014) reported 50% lower SOC stocks in the upper 10 cm of the soil of an oil palm plantation than in a reference forest, whereas the present study found 39% less SOC stocks in the upper 15 cm soil. In forest soils the continuous supply and recycling of litter maintains a large pool of SOC in the topsoil horizons. However, SOC stocks were found to be low in the topsoil layers of the oil palm plantations, which is the result of increased mineralisation rates following soil disturbance during land clearing, continuous removal of crop residues and accelerated soil erosion (Nair et al 2011). Relatively large subsoil SOC stock changes after conversion of forests to plantations were found. OP-1985 had lost 49% of the SOC stock in the deeper (30–70 cm) soil layers, whereas OP-1975/03 and OP-1965/93 had lost 12% and 28% of the SOC stock in this layer. In forest soils the deep root systems of the trees facilitate the transport of biomass to the deeper layers. The situation in the soil under oil palm contrasts somewhat with this as the shallow root systems of the oil palms and compaction of the soil during the plantation's establishment hampers the transport of soil organic matter to the deeper soil layers (Kukal and Bawa 2014). Since these results indicate that the conversion of native forests also affects subsoil SOC below 30 cm depth, a comprehensive assessment should also include subsoil horizons and could be a recommended option for this type of study in future.
5. Conclusion
Our results suggest that conversion from forest to oil palm plantations leads to diminishing SOC stocks, although this should be further validated with more such studies in the tropics. This may have negative impacts on soil quality, the long-term productivity of the soil and the global carbon balance. However, SOC stocks under oil palm plantations are slowly building up during the second rotation as time since conversion increases. This indicates that the improved management practices applied in the oil palm plantations under investigation facilitated a partial recovery of SOC loss with increasing time from conversion. The practice of chipping of the old oil palms during plantation re-establishment is likely to play a vital role in SOC gain in the second rotation cycle. Organic residue management is likely to have contributed to the development of distinctly higher SOC stocks under certain management zones, e.g. under FSs over time. These results also indicate that the conversion of forest to oil palm plantation affects both top and subsoil SOC stocks, which reinforces the importance of including soil samples from deeper layers in future studies. However, the decline in inherited SOC stock and build-up of new SOC stock based on aboveground and belowground oil palm residue and recycled material application warrant further exploration across multiple sites and different management practices in the pan tropics.
Acknowledgments
This work has been conducted as part of a PhD fellowship supported by the Agricultural Transformation by Innovation (AgTrain), Erasmus Mundus Joint Doctorate Programme, funded by the EACEA (Education, Audio-visual and Culture Executive Agency) of the European Commission under agreement no. 2012-002.