

Abstract
Egypt produces half of the 20 million tons of wheat that it consumes with irrigation and imports the other half. Egypt is also the world's largest importer of wheat. The population of Egypt is currently growing at 2.2% annually, and projections indicate that the demand for wheat will triple by the end of the century. Combining multi-crop and -climate models for different climate change scenarios with recent trends in technology, we estimated that future wheat yield will decline mostly from climate change, despite some yield improvements from new technologies. The growth stimulus from elevated atmospheric CO2 will be overtaken by the negative impact of rising temperatures on crop growth and yield. An ongoing program to double the irrigated land area by 2035 in parallel with crop intensification could increase wheat production and make Egypt self-sufficient in the near future, but would be insufficient after 2040s, even with modest population growth. Additionally, the demand for irrigation will increase from 6 to 20 billion m3 for the expanded wheat production, but even more water is needed to account for irrigation efficiency and salt leaching (to a total of up to 29 billion m3). Supplying water for future irrigation and producing sufficient grain will remain challenges for Egypt.
Export citation and abstract BibTeX RIS

Original content from this work may be used under the terms of the Creative Commons Attribution 3.0 licence. Any further distribution of this work must maintain attribution to the author(s) and the title of the work, journal citation and DOI.
Introduction
The population of Egypt is growing at 2.2% annually (Roser and Ortiz-Ospina 2017). In a region mostly covered by desert with extremely low rainfall (UNEP 2010), Egypt relies exclusively on irrigation to produce half of the 20 million tons of wheat (Triticum aestivum) consumed annually (MALR 2014a) and imports the other half. Egypt is currently the largest wheat-importing country in the world (FAO 2016) and is trying to become less reliant on wheat imports by increasing production. Egypt has no significant rainfall except in a narrow band along the northern coast. The current main source of Egypt's water supply is the river Nile. The availability of a reliable water supply from the High Dam in Aswan is governed by the water-sharing treaty with the countries of the Nile Basin under which 55.5 billion m3 per year is allocated to Egypt. Additional water could become available with the completion of the Jonglei Canal. Total available water resources are estimated at 73.8 billion m3 per year, while current total water use is about 62.6 billion m3. Agriculture's share of the water use (all crops) is about 85% and the remaining water is used by urban areas (MWRI 2005). A government program has expanded the area of irrigated land exploitable for wheat production from 3.3 M ha (referred to as 'current' here) by 0.6 M ha between 2014 and 2017 (called 'new' here) and plans to add another 3.8 M ha by 2035 (called 'future' here) (MALR 2014a). Massive new tracts of irrigated land will be developed near current irrigated sites close to the river Nile and in new areas across the country, including along the Mediterranean coast and inland west of the Nile (MALR 2014a).
Various water conservation measures have been undertaken by the government to minimize water wastage. On previous irrigated land, flood irrigation farming is widely practiced, with about 30% of irrigation water is lost through seepage and leaks from ageing infrastructure and high evaporation. Therefore, the Farm-Level Irrigation Modernization Project (FIMP) was established in 2013 with funding from the World Bank, the French Development Agency and the Egyptian Government. This project aims to reduce the loss of irrigation water by replacing the irrigation canals with underground plastic pipes (World Bank 2018), to increase irrigation system efficiency to about 75%. In addition to FIMP, there are other measures for water conservation currently considered or partially implemented, including recycling treated municipal and industrial waste water and re-using drainage water for irrigation and replacing flood irrigation systems with center pivot irrigation systems in newly reclaimed areas (MALR 2014a).
In a country-wide program of field experiments at 48 sites across current, new and future agricultural areas, potential wheat grain yield ranged from 4.9 to 9.8 t ha−1 (at 10% grain moisture), with yield gradually decreasing with an increase in temperatures from north to south (MALR 2014a). However, it is not clear how much grain the new areas will contribute to the national production, nor how grain yield and irrigation water requirements will change with future climate change. Crop simulation models are powerful tools that can be used to estimate Egypt's future wheat production and the amount of water required for irrigation across the current, new, and future irrigated agricultural land, especially when climate change is taken into consideration. Crop models have been used for climate change impact studies, and when they are used in ensembles, they produce yield impact estimates that are as accurate as those from field experiments, as demonstrated recently for wheat (Asseng et al 2013 2015) and other crops (Rosenzweig et al 2013, Bassu et al 2014, Li et al 2015, Fleisher et al 2017).
Here, an ensemble of three Decision Support System for Agrotechnology Transfer (DSSAT) (Jones et al 2003, Hoogenboom et al 2017) wheat models, namely NWHEAT, CERES, and CROPSIM, were used to simulate wheat yield and irrigation water demand in current, new, and future areas in Egypt and contrasted these with a growing grain demand driven by population growth.
Methods
Field experiments for yield estimates in current and potential irrigated areas
Forty-eight locations were selected to represent 'current' irrigated agricultural areas in Egypt in the Nile delta and valley (3.3 M ha) and 'new' and 'future' planned land for irrigation. 'New' represents an additional 0.6 M ha irrigated land by 2017, and 'future' represents an additional 3.8 M ha irrigated land by 2035, according to a government strategic plan for Egypt to expand irrigated land (MALR 2014a) (figure 1, table S1 is available online at stacks.iop.org/ERL/13/094012/mmedia).

Figure 1. Estimates of wheat yield for Egypt. Map of irrigated agricultural land in Egypt in 2014 (current) and additional areas to be irrigated by 2017 (new) and by 2035 (future) (MALR 2014a). Wheat yields at 48 different sites (black dots) are from field experiments in 2013/14 and 2014/15 or yield estimates from nearby locations (MALR 2014b). Estimates (interpolated color) at 10% grain moisture are normalized to the national yield in 2014 based on a national yield trend from 2000 to 2014. Triangles indicate locations used for crop model calibration and evaluation with detailed field experiments. Regions separated by horizontal dotted lines indicate where the three main cultivars (CV, left) are grown.
Download figure:
Standard image High-resolution imageRecorded wheat yield from field experiments was available for most of the 48 representative locations in Egypt (MALR 2014b). Wheat yield (at 0% grain moisture) were from field experiments with modern cultivars Misr1 and Misr2 in 2013–14 and 2014–15 and from yield estimates from nearby locations (MALR 2014b), normalized to 2014 using the national FAO yield trend between 2000 and 2014, at 10% grain moisture (FAO 2016) (figure 1, table S1). Wheat cv. Sakha93 has some resistance to salinity and is sensitive to high temperature and is, therefore, grown in more saline but cooler northern Egypt (figure 1). Cultivars Misr2 and Misr1 are increasingly more resistant to high temperature and are, therefore, grown towards the warmer South in Egypt (figure 1).
Wheat yield (WY) across all locations was determined as follows:
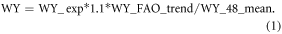
WY_exp is the measured wheat yield (at 0% grain moisture) from field experiments at a specific location (except for estimates of the locations: 1-Gamasa, 2-Matrouh, 7-Hamam, 21-South of Baharia, 32-North of Kharga, and 33-South of Kharga (table S1)). The factor of 1.1 was used to add 10% grain moisture, which is standard for commercial wheat reports in Egypt and at FAO. This factor allowed for the data to be comparable to national yield reports and FAO statistics. WY_FAO_trend is the national wheat yield in 2014, based on a linear yield trend from 2000 to 2014 from FAO data (FAO 2016). WY_48_mean is the mean wheat yield for all 48 locations.
Field experiments for model calibration and evaluation
Detailed field experiments were conducted during three growing seasons (2011–12 to 2013–14) at four locations along the River Nile. The locations were from North (moderate temperature) to South (high temperature) and included Sakha (North delta, lower Egypt), Menofya (middle delta), Benisuef (middle Egypt), and Aswan (upper Egypt). The field experiments were conducted using the most common modern wheat cultivars Sakha93, Misr2, and Misr1 under full irrigation and fertilization and two planting dates, 20 November (recommended) and 30 November (late, to expose wheat to increased seasonal temperatures). Measurements included plant density, aboveground biomass (at anthesis and maturity), date of 50% anthesis, date of physiological maturity, grain yield, grains m−2, and kernel weight. The Central Laboratory of Agricultural Climate in Egypt (www.clac.edu.eg) collected daily weather data at the four field experiments.
Model calibration and testing
Three wheat crop models in DSSAT v4.7 (CERES, NWHEAT, and CROPSIM) were calibrated and evaluated with the four field experiments along the River Nile for the three seasons from 2011–12 to 2013–14. Phenology parameters were calibrated with the first season and evaluated with the second and third season and compared with the observed anthesis and maturity dates. Yield parameters were calibrated to reproduce yield and yield components across seasons, sowing dates, and locations, so that the data were consistent with other spring wheat cultivar parameters and consistent across the three models. Table 1 shows the genetic coefficients for the three cultivars for the three models.
Table 1. Genetic coefficients for the three cultivars Misr2, Misr1, and Sakha93.
| Models | Parameter | Parameter definition | Misr2 | Misr1 | Sakha93 |
|---|---|---|---|---|---|
| CERES-Wheat | P1V | Vernalization sensitivity coefficient | 25 | 30 | 22 |
| P1D | Photoperiod sensitivity coefficient | 40 | 30 | 42 | |
| P5 | Thermal time from onset of linear grain filling to maturity (°Cd) | 545 | 553 | 548 | |
| G1 | Kernel number per unit stem plus spike weight at anthesis (kernel weight−1) | 35 | 32 | 36 | |
| G2 | Maximum kernel size under optimum conditions (mg) | 40 | 35 | 43 | |
| G3 | Maximum stem and spike weight when elongation ceases (g) | 7.8 | 7.8 | 7.5 | |
| PHINT | Thermal time between the appearance of leaf tips (°Cd) | 100 | 100 | 100 | |
| N-Wheat | VSEN | Sensitivity to vernalization | 2.7 | 2.8 | 2.5 |
| PPSEN | Sensitivity to photoperiod | 2.8 | 2.2 | 4.3 | |
| P1 | Thermal time from emergence to the end of juvenile (°Cd) | 400 | 400 | 400 | |
| P5 | Thermal time from beginning of grain filling to maturity (°Cd) | 570 | 510 | 640 | |
| PHINT | Phyllochron interval | 100 | 100 | 100 | |
| GRNO | Coefficient of kernel number per stem weight at the beginning of linear grain filling (kernels stem weight−1) | 32 | 32 | 32 | |
| MXFIL | Potential kernel growth rate (mg kernel−1 day−1) | 3.0 | 3.0 | 3.0 | |
| STMMX | Potential final dry weight of a single tiller excluding grain (g) | 1.0 | 4.0 | 4.0 | |
| CROPSIM-Wheat | VREQ | Vernalization required for max development rate (VDays) | 2 | 3 | 1 |
| PPS1 | Photoperiod sensitivity | 90 | 84 | 88 | |
| P8 | Thermal time from the onset of linear grain filling to maturity (°Cd) | 380 | 375 | 380 | |
| PHINT | Interval between successive leaf appearances (oCd) | 100 | 100 | 100 | |
| GWTS | Maximum grain size under optimum conditions (mg) | 43 | 40 | 44 | |
| G#WTS | Standard grain number per unit canopy weight at anthesis (kernels g−1) | 21 | 20 | 21 | |
| SHWTS | Maximum non-stressed shoot dry weight at maturity (g) | 2.8 | 3.0 | 3.0 | |
| LAFR | Potential fraction of leaf growth during reproductive phase (—) | 0.5 | 0.5 | 0.5 | |
| LAFV | Potential fraction of leaf growth during vegetative phase (—) | 0.1 | 0.1 | 0.1 | |
| LA1S | Area of initial leaf (cm2) | 5.0 | 5.0 | 5.0 | |
Measurements of evapotranspiration were not available. However, the models used here have been tested with water use data from other experiments (Asseng et al 1998a, 1998b, 2000, Cammarano et al 2016). In addition, the CERES and NWHEAT models had previously been tested individually against data from field experiments where atmospheric CO2 concentrations were elevated (Tubiello et al 1999, Asseng et al 2004, O'Leary et al 2015). All three models have been shown to give similar results in a sensitivity analysis with temperature and atmospheric CO2 concentration changes (Kassie et al 2016), confirming their suitability for use in climate change impact assessments.
Baseline simulations across 48 representative locations
Following model evaluation, the three wheat models (CERES, NWHEAT, and CROPSIM) were applied across the 48 representative agricultural locations (table S1) using the region-specific cultivars Misr2, Misr1, and Sakha93 (figure 1) and weather data for 1980–2010 (NASA, AgCFSR climate dataset, http://data.giss.nasa.gov/impacts/agmipcf/).
Estimate of past and future wheat yield and production
Wheat yield for current (1981–2010) and future (2030s, 2050s and 2080s) conditions were simulated with a multi-model ensemble of the three DSSAT wheat models. Wheat production was estimated from these simulations by weighing with experimental yield and multiplying with irrigated areas. The crop model ensemble was then applied to determine the mean yield across locations representative of the current, new, and future irrigated areas in Egypt for the period 1981–2010, using modern cultivars and crop management. The simulation results were then scaled up to estimate national yield using an approach developed by Asseng et al (2015) by weighing simulated impacts with the observed production of the representative area.
Wheat was sown on 20 November each year using region-specific cultivars (figure 1, table 1) for baseline weather data of 1981–2010 (figure S1) for the 48 representative locations (figure 1, table S1). The wheat crops were fully fertilized and irrigated to avoid any nitrogen stress and water deficit. Simulated baseline yields were adjusted to 10% grain moisture and to the yield at 2014 (based on 2000–2014 FAO yield trend). Wheat production for each representative area was calculated by using corrected field experimental yield, multiplied by the irrigated area and the factor of 0.34 (34%). 34% of the total irrigated area in Egypt is currently grown with wheat. Using this approach and aggregating to national production resulted in 8.8 Mt for 2014; 1.5 Mt for the new area (for 2014); and 8.9 Mt for the future area (for 2014, achieved by 2035 when all the additional irrigation areas are in place). Egypt's actual production in 2014 was 9.3 Mt (FAO 2016), close to the estimate when adding the 8.8 Mt from the simulated 'current' irrigated wheat area to some of the estimated 1.5 Mt from the 'new' irrigated areas (started in 2014 and to be completed in 2017).
Water use efficiency (WUE) was calculated as follows:

Here, WY is the simulated wheat yield (kg ha−1), and ET_crop is the simulated cumulative evapotranspiration (mm) from sowing until harvest (at crop maturity).
Estimate of future climate change impacts
Future climate change scenarios were prepared from three Global Climate Models (GCMs), including GFDL-ESM2M, CSIRO-Mk3-6-0, and HadGEM2-ES, and for two RCPs (4.5 and 8.5) for periods around 2030, 2050, and 2080 using the 'delta method' (Wilby et al 2004) across the 48 representative locations in Egypt. RCP8.5 is the highest global IPCC emission scenario and the most likely future scenario when considering the current high global emissions. RCP4.5 is a lower emission scenario chosen as a contrast to RCP8.5. The scenario changes (i.e. delta's from the GCMs) were applied to the baseline AgCFSR weather data (1980–2010). The AgCFSR baseline weather data combines retrospective analyses, gridded meteorological station datasets, and remotely-sensed radiation and precipitation data to form coherent daily time series for the future scenarios (table 2).
Table 2. Change in wheat-growing season (20 November to 10 May) mean Tmax and Tmin for climate scenarios and time lines.
| Tmax | Tmin | ||||
|---|---|---|---|---|---|
| Time | GCMs | RCP 4.5 | RCP 8.5 | RCP 4.5 | RCP 8.5 |
| 2030 | GCM1 | 0.4 | 0.7 | 0.5 | 0.7 |
| GCM2 | 0.6 | 0.7 | 0.7 | 0.9 | |
| GCM3 | 1.0 | 1.2 | 1.0 | 1.3 | |
| 2050 | GCM1 | 0.8 | 1.5 | 1.0 | 1.6 |
| GCM2 | 1.0 | 1.6 | 1.5 | 2.1 | |
| GCM3 | 1.5 | 2.1 | 1.7 | 2.5 | |
| 2080 | GCM1 | 0.8 | 2.3 | 0.8 | 2.5 |
| GCM2 | 1.5 | 3.0 | 2.0 | 3.9 | |
| GCM3 | 2.1 | 3.5 | 2.5 | 4.5 | |
The simulated relative impacts from the crop models were applied to the representative regional production before upscaling to national production.
Using three GCMs allowed us to quantify the climate model uncertainty in these estimates.
Relative impacts
The relative change (r) in grain yield, ET, and WUE were calculated as follows:

Wheat consumption and demand
To contrast future production with future demand for wheat, per capita wheat demand was calculated based on current wheat consumption as follows:
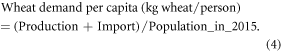
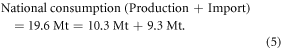
Here, import in 2013 was 10.3 Mt (http://fao.org/faostat/en/#data/TP) (between 9.8 and 11.4 Mt between 2010 and 2013), and production in 2014 was 9.3 Mt (http://fao.org/faostat/en/#data/QC) (9.5 Mt in 2013).
The total national wheat consumption for Egypt was calculated as follows:
Here, the population for 2014 was 89 580 000 (http://esa.un.org/unpd/wpp/Download/Standard/Population/).
The consumption or demand per person was then calculated as follows:

The current per capita demand of 220 kg wheat per capita was assumed to be constant in the future. A reduced consumption of 180 kg wheat per person was considered as an additional scenario. Population projections for Egypt were derived from UN population scenarios (Roser and Ortiz-Ospina 2017).
Scenario of future wheat intensification
In addition to land expansion, the current land intensification rate of 34% of wheat (1 in 3 years wheat is grown on the same land) across all irrigated land in Egypt (FAO 2016) was increased to 50% (1 in 2 years wheat is grown on the same land) as a potential adaptation option (El-Beltagy 2009). Full irrigation and no nitrogen limitations were assumed, similar to the current wheat cropping systems in Egypt (MALR 2014b).
Loss in current agricultural land due to land sprawl
Since 2011, an estimated 0.03 M ha of agricultural land has been lost per year due to the illegal settlements on the outskirts of towns (SWERI 2017) and it is assumed to continue at this rate to add to a production loss of 0.54 Mt by 2035 (1.14 Mt by 2055, 2.04 Mt by 2085) (based on a current mean yield in these areas of about 7.7 t ha−1). This loss was also considered for the projections of future wheat production in Egypt.
Results and discussion
An ensemble of three wheat models, namely NWHEAT, CERES, and CROPSIM of DSSAT Version 4.7 (Hoogenboom et al 2017) were used to simulate wheat yield in Egypt. The ensemble means were close to the yield measured in field experiments at four sites, with observed and simulated yield declining with an increase in seasonal temperature (figure 2). Other detailed crop variables from these field experiments were also well simulated with the three crop models together (supplementary figure S2). In addition, the CERES and NWHEAT models had previously been tested individually against data from field experiments where atmospheric CO2 concentrations were elevated (Tubiello et al 1999, Asseng et al 2004, O'Leary et al 2015) and temperature was increased (Asseng et al 2015). Despite some different functionality, all three models have been shown to give similar results in a sensitivity analysis with temperature and atmospheric CO2 concentration changes (Kassie et al 2016), confirming their suitability for use in climate change impact assessments.

Figure 2. Observed grain yield (symbols, mean; error bars, ± 1 s.d.) for sites at Sakha, Menofya, Benisuef, and Aswan (see triangles in figure 1) and simulated grain yield (lines, means of three wheat crop models; shaded areas ± 1 s.d.) versus growing season mean temperature for growing season (A) 2011–12, (B) 2012–13, and (C) 2013–14. Growing season is the time from sowing to maturity. Data include crops sown on the normal sowing date of 20 November (dark red) and on 30 November (green), resulting in higher seasonal temperatures. All grain yields are at 10% grain moisture.
Download figure:
Standard image High-resolution imageSimulated national wheat yield varied from 6 to 8 t ha−1 due to year-to-year variability in temperature; years with high seasonal temperature often resulted in lower simulated yield. 2010 was the warmest year since 1981; 2010 had the lowest simulated yield and coincided with the largest drop in reported national yield (figure 3). Simulated yield was higher than reported yield during the earlier part of the 30 year period, but became similar to observations in recent years (figure 3). This earlier discrepancy resembles a yield gap caused by changes in agricultural technology over the three decades (van Ittersum et al 2016), but no attempt was made here to simulate old cultivars or former cropping practices. Simulated yield was similar to observed yield over the last decade, when technology advances were small.

Figure 3. Egypt's national wheat yield (FAO) (circles), simulated yield for current irrigated areas, based on daily weather data of 20 representative locations from 1980 to 2010 (NASA, AgCFSR climate dataset, http://data.giss.nasa.gov/impacts/agmipcf/), and weighted to local reported yields from 2014 (black dotted line, 1981–2010), mean seasonal temperature (gray bars). Future yield trends for RCP4.5 (blue) and RCP8.5 (red) scenarios. Difference between simulated and FAO yields from 1980 to 2000 are due to technology gap in FAO data (due to old varieties and less efficient crop management during this time) as simulations were carried out with modern cultivars and current crop management. Measured national wheat yield of Egypt for 1981–2014 (FAO 2016) and projected yield trends (2015–2100) with yield trends due to technology advances for RCP4.5 (blue) and RCP8.5 (red) scenarios, using a method by Ewert et al (2005). The black line shows the observed national yield trend stagnation since 2000–2014 (y = 00014x + 6.4202), used as the basis for future yield projections. All grain yields are at commercial grain moisture (10%). Note that temperature data and yield simulation are only available until 2010.
Download figure:
Standard image High-resolution imageTo estimate how much wheat Egypt could produce if the new and future irrigated areas were exploited (figure 1), yield for all areas, including the additional future areas, with future climate change impact on yield were simulated (figure 4).

Figure 4. Simulated wheat yield. (A) Simulated average yield (average of 48 locations and 30 years) for Egypt for baseline (1980–2010) and future climate scenarios (without considering technology trend), and (B) relative yield change to baseline.
Download figure:
Standard image High-resolution imageThe impact of future climate change scenarios on wheat yield was assessed by coupling the crop models to changes in temperature and CO2 concentrations generated by three global climate models (GCMs) and two representative concentration pathways (RCP4.5 and 8.5) for three future decades, including the 2030s, the 2050s, and the 2080s. With increasing concentrations of atmospheric CO2 acting as a growth stimulant as shown in field experiments (Ainsworth and Long 2005, Kimball 2016), simulated irrigated wheat yield across Egypt was projected to increase slightly (2.4%) in the 2030s (figure 4), and slowly declining toward the end of the century (−1.7% by 2050s and −4.0% by 2080s) due to the increasing negative impacts from projected temperature increases (Wheeler et al 1996, Ottman et al 2012). However, the CO2 growth stimulus, could be less as suggested in the simulation (and in short term field experiments), as recently been indicated in long-term experiments in which the growth stimulus from elevated CO2 concentration in C3 grasses declined over years (Reich et al 2018).
To include a possible impact of new technologies on future crop yield, the recent observed modest wheat yield trend in Egypt, commonly found for many crops and regions in recent years (Grassini et al 2013), was extended into the future by combining continued introduction of new higher-yielding cultivars and gradual improvements in crop management (without indicating any specific changes), linking the technology advances to future emission scenarios according to the approach by Ewert et al (2005). Adding this technology trend (figure 3), the simulated projection was insufficient to mitigate the negative effects of climate change and agricultural land loss from urban sprawl (figure 5). In addition to losses of agricultural land from urban sprawl included in the projection, with 1m of sea level rise, another 200 000 ha or 1/3 of the current agricultural land in the Nile Delta in Egypt could be lost from agricultural production (not included in figure 5) (El-Nahry and Doluschitz 2010).

Figure 5. Estimated wheat demand and production with uncertainties in future decades under the irrigation expansion plan in Egypt. (A) Simulated national mean wheat production (bars) are means of results from 30 year simulations with three crop models and three climate models (for future scenarios) under RCP4.5 and RCP8.5 for 48 locations that were weighted to regional production and adjusted to reported regional yield (figure 1) and national yield in 2014 (FAO 2016). Simulations considered RCP-specific technology trends on yield (after Ewert et al 2005). Data are shown for crops grown on current irrigated agricultural land in 2015 (C), plus new areas irrigated by 2017 (N), plus future areas irrigated by 2035 (F) in the current decade and for the total irrigated agricultural land in the 2030s, 2050s, and 2080s. Filled bars are estimates for current wheat cropping intensity of 34% (i.e., growing wheat in the same field once every 3 years FAO 2016), and open bars are for future potential wheat production intensity of 50% (i.e., growing wheat on the same field once every 2 years El-Beltagy 2009). Projected losses of agricultural land with urban sprawl were also subtracted from the future production. Estimated wheat demand (lines) is based on 220 kg wheat/person and population growth continuing as today at 2.2% (yellow) or at high (red), medium (blue), or low (green) projected population growth rates (Roser and Ortiz-Ospina 2017). Demand (arrow) and production (×) are indicated for 2015 (FAO 2016). (B) Crop model and GCM uncertainties are relative standard deviations based on three crop models or three GCMs, respectively. All grain yields are at 10% moisture.
Download figure:
Standard image High-resolution imageWith the total of current, new, and future irrigated land in use and considering the impact of climate change, technology trend and urban sprawl, national wheat production could double to about 20 Mt per year (figure 5). Another approach to increase cropping area, and hence wheat production, is to intensify harvests by growing wheat on the same field once every two years instead of once every three years as currently practiced (El-Beltagy 2009). Such crop intensification could raise Egypt's national production to about 27 million t (figure 5(a)). This would make Egypt self-sufficient by the 2030s, but only temporarily if population growth continues at current rate (figure 5 and supplementary figure S3(A)). Even for a population growing at a moderate rate after 2040s, or assuming a lower per capita consumption of 180 kg wheat per person (supplementary figure S3(B)), the production increase from crop intensification would be insufficient (Roser and Ortiz-Ospina 2017). Reducing Egypt's wheat demand by lowering per capita consumption, e.g., to 100 kg wheat per capita by 2050s (MALR 2014a), would halve the demand in any population growth scenario. Changing the dietary structure to other protein sources (i.e. meat, eggs and milk), would reduce the demand for wheat. However, livestock production itself and feed production will also require water. In addition to wheat, Egypt grows barley and clover during the winter and rice, cotton and maize during the summer, all with irrigation. The water requirement for most of these crops is larger than for wheat (Osama et al 2017). Hence, having fewer calories and proteins from wheat will require other food substitutes with likely an even higher water demand.
Uncertainties in estimating yield impacts were relatively small and lower than the extant of the year-to-year variability (figure 5). The uncertainties for the crop models, RCPs, and GCMs were similar until the mid-century, but thereafter crop model uncertainty was at least twice as high as GCM uncertainty (figure 5).
Since all crops require irrigation in Egypt due to its low annual rainfall, crop water demand and water use are critical factors for agriculture. Water use efficiency would not change or would slightly increase despite the projected increase in temperature with future climate change (figure 6). This is because total evapotranspiration during a growing season would be less due to shorter growth duration with higher temperatures and more efficient transpiration due to elevated atmospheric CO2 concentrations (Deryng et al 2016, Kimball 2016). Therefore, as a consequence of expanding irrigated land, crop water demand per unit yield will not be affected by climate change, but will substantially increase from 6 billion m3 per year currently to approximately 14 billion m3 per year with expanding irrigated land, and to a total of approximately 20 billion m3 per year with additional crop intensification (figure 6).

Figure 6. Estimated water use efficiency and national wheat crop irrigation water demand in future decades under the irrigation expansion plan in Egypt. (A) Simulated national mean water use efficiency are means of 30 year simulations (black) with three crop models and three climate models (for future scenarios) under RCP4.5 (blue) and RCP8.5 (dark yellow) for 48 locations in this decade (current) and the 2030s, 2050s, and 2080s. (B) Simulated national wheat irrigation water demand for current irrigated agricultural land, plus new areas irrigated by 2017 (N), plus future areas irrigated by 2035 (F) in the current decade (C, black) and in the 2030s, 2050s, and 2080s, under RCP 4.5 (green) and RCP8.5 (red). Water demand was adjusted for technology trend in yield according to Ewert et al (2005). Current wheat production intensity of 34% (i.e., growing wheat on the same field once every 3 years FAO 2016 (green and red)). Possible future potential wheat cropping intensity of 50% (i.e., growing wheat on the same field once every 2 years El-Beltagy 2009 (light green and dark red)).
Download figure:
Standard image High-resolution image
The estimated crop water demand indicates how much water a wheat crop physically requires. For areas near the Nile, irrigation water can be pumped from the river itself, but for areas further afield groundwater will be required (MALR 2014a). Water from both sources contains salt, which must be taken into consideration when estimating irrigation water requirements. If the irrigation water in Egypt has an average salinity of approximately 1500 mg l−1 (Amer and Ridder 1989, Salim 2012), 15% more irrigation per year will be required to leach the soil and prevent salt from accumulating and harming plant growth (Rhoades et al 1992). In addition, current irrigation efficiency across Egypt is estimated to be only approximately 50% because of flood irrigation, although ongoing efforts aim to increase this to 70%–80% (El-Beltagy 2009) by installing, managing, and maintaining more efficient irrigation systems (Lascano and Sojka 2007). With a future irrigation efficiency of 70%–80% plus 15% additional water for leaching, 35%–45% more water than the actual crop demand will be required for irrigation, resulting in a total water demand of 27–29 billion m3 per year for the expanded and intensified future wheat production in Egypt.
Groundwater is slow to recharge due to low rainfall across Egypt, so pumping large amounts of water for irrigation is unlikely to be sustainable in some of the new and future regions (UNEP 2010). Water flow of the Nile River is not projected to decline with climate change, but the flow is likely to be more variable (Siam and Eltahir 2017). Therefore, the Egyptian government is planning a number of projects in collaboration with the African Nile basin countries. It is considering bringing additional water from both the Congo River and the Jonglei Canal in Sudan by 2035 (Sharaky 2013, MALR 2014a) as well as desalinating seawater by mid-century (MWRI 2005, MALR 2014a).
Conclusions
If the population growth in Egypt remains high to moderate (Roser and Ortiz-Ospina 2017), the demand for wheat will continue to outpace wheat production. Simultaneously, the competition for water from cities will also increase (Flörke et al 2018). The planned agricultural land expansion and wheat cropping intensification will be insufficient to meet the growing wheat demand, and Egypt will continue to have to rely on wheat import in the future. While Egypt has the land, technology, and foresight to expand wheat production and at least reduce wheat imports, meeting the increased demand for irrigation water will be challenging. Similarly, increasing or even just maintaining irrigated areas will be difficult for all of northern Africa and many other irrigated regions in the world (Wisser et al 2008, Elliott et al 2014).
Acknowledgments
We thank the Agricultural Model Intercomparison and Improvement Project (AgMIP) for support. This project was partly funded by the Egyptian Ministry of Scientific Research through a postdoctoral fellowship to AK at University of Florida, USA. We thank the Agricultural Research Center (ARC) and the Soils, Water and Environment Research Institute (SWERI) for assistance with wheat experiments used in model testing. We also thank the Ministry of Agricultural and Land Reclamation (MALR) for statistical and spatial data of wheat production and land reclamation. We thank M Abou Zeid for informative discussion about current and future irrigation systems and water resources in Egypt.