

Abstract
Wheat (Triticum aestivum) is the most widely grown food crop in the world threatened by future climate change. In this study, we simulated climate change impacts and adaptation strategies for wheat globally using new crop genetic traits (CGT), including increased heat tolerance, early vigor to increase early crop water use, late flowering to reverse an earlier anthesis in warmer conditions, and the combined traits with additional nitrogen (N) fertilizer applications, as an option to maximize genetic gains. These simulations were completed using three wheat crop models and five Global Climate Models (GCM) for RCP 8.5 at mid-century. Crop simulations were compared with country, US state, and US county grain yield and production. Wheat yield and production from high-yielding and low-yielding countries were mostly captured by the model ensemble mean. However, US state and county yields and production were often poorly reproduced, with large variability in the models, which is likely due to poor soil and crop management input data at this scale. Climate change is projected to decrease global wheat production by −1.9% by mid-century. However, the most negative impacts are projected to affect developing countries in tropical regions. The model ensemble mean suggests large negative yield impacts for African and Southern Asian countries where food security is already a problem. Yields are predicted to decline by −15% in African countries and −16% in Southern Asian countries by 2050. Introducing CGT as an adaptation to climate change improved wheat yield in many regions, but due to poor nutrient management, many developing countries only benefited from adaptation from CGT when combined with additional N fertilizer. As growing conditions and the impact from climate change on wheat vary across the globe, region-specific adaptation strategies need to be explored to increase the possible benefits of adaptations to climate change in the future.
Export citation and abstract BibTeX RIS

Original content from this work may be used under the terms of the Creative Commons Attribution 4.0 license. Any further distribution of this work must maintain attribution to the author(s) and the title of the work, journal citation and DOI.
1. Introduction
Wheat is the most traded and planted crop in the world, covering 216 million hectares with an average yield of 3.5 t ha−1 (at 11% moisture content) and a total production of 765 million tons worldwide (FAOSTAT 2019). More than half of the world's wheat production goes toward human diets while the remainder goes to the animal feed and processing industry (Curtis 2002, FAO 2018). Wheat world demand (including food, seed, and industrial and feed use) has increased over the last years (USDA 2019). At the same time, agriculture faces many challenges because of growing environmental concerns related to water use for irrigation and fertilizer as well as pesticide losses (Cassman and Harwood 1995, Fan et al 2012). Added to this, agriculture is projected to be one of the business sectors most affected by climate change in the future (Rosenzweig et al 2014).
Past temperature trends show that wheat yield has declined by −5.5% for the period from 1980 to 2010 due to 0.13 °C decadal temperature increase (Lobell et al 2011). Rising global temperatures, rainfall changes, and extremes in the future are projected to further affect wheat production by mid and end of century (Challinor et al 2014, IPCC 2014, Rosenzweig et al 2014, Asseng et al 2015). Asseng et al (2015) and Zhao et al (2017) estimated that wheat production is projected to decline by −6% per °C of further global warming. Mid and high latitudes are less affected and may benefit from a warming of 1 °C–3 °C, while low latitudes close to the Equator are projected to be more affected due to already supra-optimum temperature in those areas (Xiong et al 2019). Developing countries may be more impacted by climate change because many of them have production systems with limited access to technology. However, these areas have a large improvement potential due to a large yield gap between current and attainable yields (Neumann et al 2010, Mueller et al 2012).
Global climate change impacts on wheat production have been explored in the past using diverse methodologies, but few consider adaptation strategies. Rosenzweig et al (1994) reported one of the first global climate change impact and adaptation studies for cereal production using three Global Climate Models (GCM) and two atmospheric CO2 levels of 330 ppm (current conditions) and 555 ppm (elevated CO2), with reference point crop simulations across the globe. Adaptation strategies included cultural practices, new cultivars, and crops varying among countries. Results showed generally negative impacts under current CO2 levels, but elevated CO2 showed alleviative effects mostly for high latitude areas but less so for tropics and low latitudes. Adaptation strategies showed some positive effects but were not sufficient to overcome negative impacts for most countries. Parry et al (2004) conducted a study using one GCM with multiple emission scenarios and yield transfer functions, which projected a higher magnitude of grain yield losses under the highest CO2 emission scenario, with greater yield benefits for developed countries than for developing countries. Rosenzweig et al (2014) used seven global gridded crop models for a climate change assessment for mid and end of century. These simulated climate change impact patterns were similar among models with high latitudes projected to be less affected by climate change, while tropical and low latitude areas were projected to be the most affected. Challinor et al (2014) conducted a global meta-analysis on simulated climate change impacts on major cereals, which showed that yield declines can be expected for wheat with a temperature increase above 2 °C with steeper declines as temperature increases, although adaptation strategies may increase yields by 7%–15%.
One of the most effective adaptation strategies to climate change in the long term is the development of new genetic cultivars to improve tolerance to abiotic stresses and take advantage of periods of optimum temperature and rainfall (Challinor et al 2014, Reynolds et al 2016, Prasad et al 2017). Crop simulation models can be used as a complementary tool to field experiments to conduct exploratory tests of genotype, environment, and management interactions for certain crop genetic traits that may offer benefits under future climate conditions (Gouache et al 2015, Chenu et al 2017, Tao et al 2017, Rötter et al 2018). For instance, Hestlot et al (2014) developed an extension for model quantitative trait loci × environmental interactions as a useful tool to explore genetic traits that may perform better under current and future climate. Martre et al (2015a) conducted a study in Europe using a crop model (SiriusQuality2) with a long term dataset for three contrasting locations to explore the performance of 75 wheat parameters related to grain yield and grain protein content, using two rates of nitrogen (N), which showed that parameter responses were dependent on site and N supply. Ludwig and Asseng (2010) used the Agricultural Production Systems sIMulator (APSIM) Nwheat model to identify possible genetic traits related to early vigor to improve crop yield under climate change in a Mediterranean-type environment. Results showed that high early specific leaf area and a longer vegetative cycle resulted in increased wheat yield, but yields were the greatest when accompanied with additional N fertilizer applications. In addition, Hernandez-Ochoa et al (2019) showed that late flowering under semi-arid conditions in Mexico resulted in yield benefits under future warmer climate by mid-century. However, combined traits including early vigor, heat tolerance, and longer vegetative cycle combined with improved N management resulted in the highest yield increases. Tao et al (2017) took a similar approach for barley, using an eight-crop model ensemble at two contrasting climate sites in Europe to explore the benefits of new barley crop ideotypes under future climate. That study used varying phenology, leaf growth, photosynthesis, drought tolerance, and grain formation, and presented that, among others, new ideotypes with longer reproductive growing period may result in yield benefits under future climate.
The use of crop model ensembles for climate change impact studies has become more popular recently as the ensemble mean or median has been shown to be closer to observed data under a wide range of environments. Also, using crop model ensembles allows quantifying the uncertainty of projections (Rötter et al 2012, Asseng et al 2013a, Martre et al 2015b). Crop simulation models can be executed at a global scale and provide important opportunities in terms of exploring global and regional trends for food security policies (Elliot and Regan 1993, Rosenzweig et al 2014, Gbegbelegbe et al 2017, Müller et al 2017). With the current study, we aim to use a climate crop multi-model ensemble to explore the impacts of climate change and adaptation strategies specifically for new genetic traits together with crop management at regional and global scale and to quantify the range of uncertainty and variability for mid-century.
2. Materials and methods
2.1. Crop simulation models
The wheat simulation models used in this study include CROPSIM–CERES, CROPSIM, and Nwheat within the Decision Support System for Agrotechnology Transfer, DSSAT v.4.6 (Jones et al 2003, Hoogenboom et al 2004). The three DSSAT wheat models are embedded into the DSSAT platform using the same inputs for climate and the same sub-models for soil water and soil N. The models differ in their approach in simulating crop development and growth and particularly heat stress. The selected wheat models have been widely used to study diverse cropping systems around the world (Jones et al 2003, Van Ittersum et al 2003, Asseng et al 2004, Asseng and Turner 2007, White et al 2011, Lazzaretti et al 2015, Kassie et al 2016, Ruane et al 2016, van Bussel et al 2016). None of the three models showed a bias towards the extremes in larger multi-model comparison (e.g. Asseng et al 2015). Crop simulation models are embedded within the Mink system, which is a global-scale gridded simulation platform for the use of crop and economic models for agriculture at a global scale (Robertson 2017).
The DSSAT wheat models simulate the elevated CO2 stimulus on growth when N is not limiting. The response to elevated CO2 in these models has been validated with various free-air CO2 enrichment (FACE) experiments (O'Leary et al 2015, Kimball et al 1995, 2001, Asseng et al 2004, Kassie et al 2016).
The three wheat models simulate crop phenology based on Zadoks' scheme accumulation of degree days, which is a numerical-based system with nine main phenological phases divided in the sub phases within each main phase (Zadoks et al 1974, Hunt and Pararajasingham 1995, Ritchie et al 1998, Asseng et al 2013b). Models also include vernalization and photoperiod responses affected by temperature and photoperiod. The CROPSIM–CERES and CROPSIM temperature responses are expressed as cardinal temperature functions, which control crop growth and development, and organic matter mineralization (Hunt and Pararajasingham 1995). The Nwheat model was derived from APSIM–Nwheat, which was originally developed from the CERES-Wheat (Asseng et al 1998, 2004, Asseng 2004, Kassie et al 2016). Similar to the other two models, temperature in Nwheat affects biomass accumulation, CO2 assimilation, rate of grain filling, leaf senescence during grain filling, N demand to grain and vapor pressure deficit, but considers an acceleration of leaf senescence with daily maximum temperature above 32 °C (Asseng et al 2011, Kassie et al 2016). The three models simulate on a daily time step using the radiation use efficiency method for crop biomass accumulation, taking into account water and nitrogen dynamics including water and nitrogen stress (Keating et al 2003, Jones et al 2003).
2.2. Global climate data for baseline and future scenarios
The years 1980–2010 were selected as the historical baseline (figure 1) to compare with future climate change and adaptation impacts on wheat production. This climate period is considered a sufficient period for climate analysis (Guttman 1989, WMO 1989, Rosenzweig et al 2013). Daily maximum (Tmax) and minimum (Tmin) temperature, rainfall, and solar radiation in the Mink system were collected from National Centers for Environmental Prediction and University Corporation for Atmospheric Research (NCEP/NCAR) reanalysis database (Kalnay et al 1996). The spatial resolution of the NCEP data for Tmax and Tmin, and solar radiation was approximately 1.884° N/S and 1.865° E/W. Rainfall data at 0.5° resolution corresponding to the same time period was collected from the Global Precipitation Climatological Center of the National Oceanic and Atmospheric Administration (GPCC NOAA, US).

Figure 1. Maps of mean seasonal (a) minimum temperature, (b) maximum temperature, (c) mean temperature, and (d) cumulative precipitation for wheat-growing regions and season (from sowing to maturity) for baseline 1980–2010. Growing season defined by Nwheat model simulations.
Download figure:
Standard image High-resolution imageFor the future scenarios, Representative Concentration Pathways (RCP) 8.5, which represent the highest greenhouse gas emission scenario, was selected for mid-century (2041–2070) impact assessment. The RCPs are greenhouse gas concentration trajectories for future climate adopted by the Intergovernmental Panel on Climate Change (IPCC 2013). Five downscaled and bias-corrected GCM scenarios (table 1) from the Inter-Sectoral Impact Model Intercomparison Project (ISI-MIP, revised version from November 2015) were collected from the Potsdam Climate Institute (Müller and Robertson 2014). Daily temperature and rainfall values were extracted and averaged into monthly averages for the baseline period (1980–2010) and the 2050s future period (2041–2070). Calculated monthly changes were applied to the daily climate of the historical weather data (baseline) to create future scenarios. The future scenario daily value of temperature is the original daily value plus the calculated change between the future monthly value from the GCMs and the historical monthly value. Daily rainfall values were adjusted using the same procedure. Solar radiation remained unchanged for the future scenarios.
Table 1. Global climate models for climate scenario simulations provided daily data on maximum and minimum temperature, rainfall, and solar radiation.
| Climate model | Model acronym |
|---|---|
| US Geophysical Fluid Dynamics Laboratory | GFDL-ESM2M |
| The Institute Pierre Simon Laplace | IPSL-CM5A-LR |
| UK Hadley Centre for Climate Prediction and Research | HadGEM2-ES |
| Japan Agency for Marine-Earth Science and Technology | MIROC-ESM-CHEM |
| The Norwegian Climate Centre | NorESM1-M |
The atmospheric CO2 level for the historical baseline (baseline level) was set to 362 ppm, corresponding to the 30 year mean of the baseline period (1980–2010). Crop simulations for future scenarios were conducted with the projected (2041–2070) elevated atmospheric CO2 at 572 ppm (IPCC 2013) to determine the combined effect of temperature, rainfall, and elevated CO2.
2.3. Global soil profiles and initial conditions
The geo-referenced HC27 generic soil profile database with 0.083° resolution was used for this study (Koo and Dimes 2010). The HC27 global soil distribution map results from the combination of three major texture types (clay, loam, sand), organic carbon levels (high, medium, low), and soil depths (shallow, medium, deep), in which the Mink system applies thresholds to the appropriate soil characteristics of the Harmonized World Soil Database (HWSD) to define which out of 27 soil options represents a grid cell (Robertson 2017). The database also contains initial soil water content, which is a proxy of rooting depth from the HWSD soil database and mineral nitrogen (Nachtergaele et al 2010, Gbegbelegbe et al 2017). The models were initialized three months before sowing to ensure soil water profile buildup.
2.4. Global sowing dates
Sowing dates for spring cultivars were selected using a growing degree-days algorithm that identifies the optimum planting time depending on temperature, setting the planting time at the start of the selected month. For the winter cultivars, the October sowing window was selected for the northern hemisphere, while the April sowing window was selected for the southern hemisphere. Sowing dates are after Gbegbelegbe et al (2017), based on a summary from multiple data sources including the Spatial Production Allocation Model (SPAM) gridded maps (You et al 2013, 2017) and Food and Agriculture Organization (FAO) statistics.
2.5. Global fertilizer application
The N applications were initially based on Gbegbelegbe (2017), but were adjusted using the 2007–2009 FAO yield (FAO 2018) and experts' knowledge to represent wheat yield increases over recent years (figure 2). Fertilizer was split up to three times following the same rules stated in Gbegbelegbe (2017).
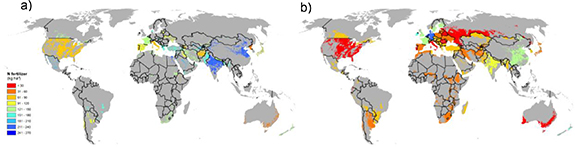
Figure 2. The average country annual nitrogen fertilizer application for 2007–2009, for (a) irrigated wheat and (b) rainfed wheat. Updated from Gbegbelegbe et al (2017) and FAOSTAT (2019).
Download figure:
Standard image High-resolution image2.6. Global irrigation application
Irrigation and rainfed land data are after Gbegbelegbe et al (2017), based on a summary from multiple data sources including the SPAM gridded maps (You et al 2013, 2017) and FAO statistics. As in Gbegbelegbe et al (2017), irrigation was set to occur when the soil profile reached 70% of available water depletion threshold in first 20 cm in the top soil layer.
2.7. Crop genetic coefficients and cultivar distribution
Crop genetic coefficients for the CROPSIM–CERES model corresponding to representative spring, facultative, and winter cultivars were first obtained from Gbegbelegbe et al (2017) and revised using field experiment data and experts' knowledge. Crop coefficients were then translated into the CROPSIM and Nwheat models based on their definition and units. Table 2 shows the updated set of cultivar genetic coefficients used for the global simulations. Cultivar distribution was based on the mega-environment distribution from CIMMYT, which assigns a cultivar type depending on growing conditions and disease pressures (Monfreda et al 2008).
Table 2. Crop genetic coefficients for crop models CROPSIM–CERES, CROPSIM, and Nwheat.
| CROPSIM–CERES | ||||||||
|---|---|---|---|---|---|---|---|---|
| Mega environment a | Benchmark variety | P1V b | P1D c | P5 d | G1 e | G2 f | G3 g | PHINT h |
| Spring varieties | ||||||||
| ME1 | PBW343 | 0 | 58 | 660 | 22 | 40 | 1 | 120 |
| ME2 | Kubsa | 0 | 58 | 660 | 22 | 40 | 1 | 120 |
| ME3 | Alondra | 0 | 58 | 660 | 22 | 40 | 1 | 120 |
| ME4 | Bacanora (Kauz) | 0 | 58 | 660 | 24 | 40 | 1 | 120 |
| ME 5 | Kanchan | 1 | 60 | 630 | 22 | 40 | 1.5 | 100 |
| ME 6 | Saratovskaya | 1 | 70 | 630 | 22 | 40 | 1.5 | 120 |
| Facultative varieties | ||||||||
| ME 7 | Pehlivan | 24 | 85 | 600 | 22 | 40 | 0.5 | 120 |
| ME 8 | HalconSNA | 24 | 85 | 600 | 22 | 40 | 0.5 | 120 |
| ME 9 | Bacanora | 24 | 85 | 600 | 22 | 40 | 0.5 | 120 |
| Winter varieties | ||||||||
| ME 10 | Bezostaya | 27 | 110 | 600 | 22 | 45 | 0.5 | 135 |
| ME 11 | Brigadier | 27 | 130 | 600 | 22 | 45 | 0.5 | 135 |
| ME12 | Gerek79 | 27 | 110 | 600 | 22 | 45 | 0.5 | 135 |
| CROPSIM | ||||||||
| Mega environment | Benchmark variety | VREQ i | PPSEN j | P8 k | G#WTS l | GWTS m | SHWTS n | PHINT o |
| Spring varieties | ||||||||
| ME1 | PBW343 | 20.5 | 50 | 490 | 22 | 40 | 1 | 120 |
| ME2 | Kubsa | 20.5 | 50 | 490 | 22 | 40 | 1 | 120 |
| ME3 | Alondra | 20.5 | 50 | 490 | 22 | 40 | 1 | 120 |
| ME4 | Bacanora (Kauz) | 20.5 | 50 | 490 | 24 | 40 | 1 | 120 |
| ME 5 | Kanchan | 21 | 50 | 460 | 22 | 40 | 1.5 | 100 |
| ME 6 | Saratovskaya | 21.2 | 55 | 460 | 22 | 40 | 1.5 | 120 |
| Facultative varieties | ||||||||
| ME 7 | Pehlivan | 24 | 80 | 430 | 22 | 40 | 0.5 | 120 |
| ME 8 | HalconSNA | 24 | 80 | 430 | 22 | 40 | 0.5 | 120 |
| ME 9 | Bacanora | 24 | 80 | 430 | 24 | 40 | 0.5 | 120 |
| Winter varieties | ||||||||
| ME 10 | Bezostaya | 27 | 105 | 430 | 22 | 45 | 0.5 | 135 |
| ME 11 | Brigadier | 27 | 125 | 430 | 22 | 45 | 0.5 | 135 |
| ME12 | Gerek79 | 27 | 105 | 430 | 22 | 45 | 0.5 | 135 |
| NWheat | ||||||||
| Mega environment | Benchmark variety | VSEN p | PPSEN q | P5 r | GRNO s | MXFIL t | STMMX u | PHINT v |
| Spring varieties | ||||||||
| ME1 | PBW343 | 1.2 | 1.5 | 660 | 24 | 2 | 3 | 120 |
| ME2 | Kubsa | 1.2 | 1.5 | 660 | 24 | 2 | 3 | 120 |
| ME3 | Alondra | 1.2 | 1.5 | 660 | 24 | 2 | 3 | 120 |
| ME4 | Bacanora (Kauz) | 1.2 | 1.5 | 660 | 26 | 2 | 3 | 120 |
| ME 5 | Kanchan | 1.5 | 1.5 | 630 | 24 | 2 | 3 | 100 |
| ME 6 | Saratovskaya | 1.9 | 2.5 | 630 | 24 | 2 | 3 | 120 |
| Facultative varieties | ||||||||
| ME 7 | Pehlivan | 3.7 | 2.9 | 600 | 24 | 2 | 3 | 120 |
| ME 8 | HalconSNA | 3.7 | 2.9 | 600 | 24 | 2 | 3 | 120 |
| ME 9 | Bacanora | 3.7 | 2.9 | 600 | 24 | 2 | 3 | 120 |
| Winter varieties | ||||||||
| ME 10 | Bezostaya | 5.0 | 3.2 | 600 | 24 | 2.5 | 3 | 135 |
| ME 11 | Brigadier | 5.0 | 3.6 | 600 | 24 | 2.5 | 3 | 135 |
| ME12 | Gerek79 | 5.0 | 3.2 | 600 | 24 | 2.5 | 3 | 135 |
a Revised cultivar selection from Gbegbelegbe et al (2017).CROPSIM-CERES: b P1V: optimum vernalizing temperature, required for vernalization (°C day). c P1D: photoperiod response (% reduction in rate·10 h−1 drop in photoperiod). d P5: grain filling (excluding lag phase duration, °C day). e G1: Kernel number per unit canopy weight at anthesis (#·g−1). f G2: standard kernel size under optimum conditions (mg). g G3: standard, non-stressed mature tiller weight (including grain, g dry weight). h PHINT: interval between successive leaf tip appearances (°C day).CROPSIM: i VREQ: vernalization required for maximum development rate (days). j PPS1: photoperiod sensitivity (% reduction in rate per 10 h drop in photoperiod phase). k P8: grain filling period (degree days). l G#WTS: standard grain number per unit canopy weight at anthesis (# g−1). m GWTS: standard grain size in optimum conditions, normal plant density (mg). n SHWTS: standard, non-stressed shoot dry weight at maturity (including grain, g). o PHINT: interval between successive leaf appearances (degree days).Nwheat: p VSEN: sensitivity to vernalization (0 refers to insensitive and 5 refers to very sensitive). q PPSEN: sensitivity to photoperiod as a slope of the relative rate of development for day lengths above critical daylength (1 h−1) in which 0 refers to insensitive and 5 refers to very sensitive. r P5: thermal time (base 0 °C) from beginning of grain filling to maturity. s GRNO: coefficient of kernel number per stem weight at the beginning of grain filling (kernels g−1 stem). t MXFIL: potential kernel growth rate (mg kernel−1 per day). u STMMX: potential final dry weight of a single tiller (excluding grain) (g stem−1). v PHINT: interval between successive leaf appearances (degree days).
2.8. Global simulated yield aggregation
Raster files corresponding to each mega-environment cultivar, nitrogen level, sowing dates, GCMs, and crop models were combined in one single raster, keeping separated irrigated and rainfed simulations. Then the baseline and future national wheat production were obtained by summing up all the wheat production by grid cell. Country yields were calculated running irrigated and rainfed production simulations separately and then dividing to the total combined irrigated and rainfed areas to report the aggregated yield per country, which was later used to compare with the observed wheat yield and production data. Global wheat production changes due to climate change and adaptation strategies were then calculated by percentage difference between future scenario (without and with the adaptation strategies) and baseline global production.
2.9. Model validation and performance
All three DSSAT wheat models were compared with the mean of a 3 year period from 2007 to 2009 including wheat aggregated yield, production and harvested acreage from FAOSTAT (2019). Observed grain yield data was moisture adjusted to 0% and compared to the simulated model ensemble mean wheat country yield and production using the root mean square error (RMSE). In addition, model performance was evaluated at a finer scale for the United States state and county yield level data using part of the methodology by Müller et al (2017), which is a global gridded model approach for model performance in terms of reproducing observed spatial variability.
2.10. Adaptation treatments
A new wheat cultivar parameterization that included combined genetic traits related to early vigor, heat tolerance, and late flowering was created. In CROPSIM–CERES and CROPSIM, heat tolerance was simulated by increasing the optimum temperature for photosynthesis by +2 °C, whereas for Nwheat, the leaf senescence threshold due to heat stress was increased by 2 °C. Early vigor was simulated by increasing the specific leaf area in the vegetative phase by 25%. Under future scenarios the crop tends to flower 5–7 d earlier than the current baseline climate, therefore, parameter P1 (temperature sum for tillering phase) was increased to gain back those days and allow the crop to accumulate more biomass before anthesis (Hernandez-Ochoa et al 2019).
Additional N fertilizer has been used in combination with potential new traits to explore if a new trait or trait combination requires more N to express. An economically and environmentally risk analysis for the additional N was not performed. The suggested adaptation strategies were implemented for the future scenarios (table 3).
Table 3. Simulated future treatments for global wheat production for 2050s.
| Treatment | Description | Adaptation |
|---|---|---|
| 1 | Current climate change impacts | No adaptation |
| 2 | Combined genetic traits (CGT) | Including traits of heat tolerance + early vigor + late flowering (after Hernandez-Ochoa et al 2019) |
| 3 | CGT + N | Treatment 2 + additional 30 kg ha−1 (irrigated) and 10 kg ha−1 (rainfed) of N fertilizer. |
Several factors, including temperature, water deficit and water access have been identified as major causes in recent wheat yield variability across the world (Zampieri et al 2017). The DSSAT wheat models simulate the impact of temperature, including heat stress and water balance, including drought stress and leaching N with heavy rainfall. With future climate change, additional reductions in yield will mostly come from increasing temperatures (Lobell and Burke 2008) and we included traits for an increase in heat tolerance. An early vigor trait was included as a possible adaptation to terminal drought (Asseng et al 2003).
3. Results
3.1. Baseline climate data
Global seasonal climate shows that wheat is grown under a wide range of environments (figure 1), from high rainfall areas with minimum seasonal temperatures of <−5 °C in the Northern latitudes in Europe and eastern US to mild winters with low rainfall such as in India, Egypt, and most of Mexico, all important wheat producers, where irrigation is necessary to supply crop water demand. China, the largest wheat producer in the world, shows diverse wheat growing environments, with high-yielding areas in the North China plain but lower yields toward the central and southeast regions, where wheat is grown with either full or supplementary irrigation and considerable erratic seasonal rainfall (Fischer et al 2005, Li et al 2007, Peng 2011). Another main wheat producer, Russia shows a more homogeneous wheat-growing environment where wheat is grown under rainfed conditions over winter into spring and summer. Also, Australia shows particular Mediterranean and humid subtropical type climates, with mild temperatures during the winter and seasonal rainfall between 100 and 400 mm, with water and heat stress being common during the grain-filling period, generally resulting in low yields.
3.2. Baseline wheat yield and model validation and performance
Figure 3 shows the simulated 30 year average baseline yield map for aggregated global wheat yield. The top wheat producers show diverse yield levels with Western Europe and the North China plain yielding from 6 to 7 t ha−1, while in India and the central and southeast areas in China show yields between 3 and 4 t ha−1, similar in Argentina and South Brazil, where wheat is grown in a humid subtropical environment under rainfed conditions. Despite being a top wheat producer, Russia has wheat yields that tend to be low, with most areas producing 1–2 t ha−1 grain yields. Africa also has a diverse growing environment mostly characterized by warm temperatures and low rainfall. There are high-yielding areas in Egypt, where wheat is grown entirely with irrigation, but low-yielding environments are in most of Central and South Africa with less than 1 t ha−1 grain yields, although their contribution to global production is low.

Figure 3. (a) Simulated model ensemble (mean of CROPSIM–CERES, CROPSIM, and Nwheat crop models and 30 year period) global aggregated (cells weighted according to irrigated and rainfed wheat production) wheat yield for baseline (1980–2010), using CIMMYT mega environment cultivar distribution at 0.5 × 0.5° pixels, (b) simulated mean model ensemble versus observed wheat yield and (c) simulated versus observed country wheat production for mean of 2007–2009. Observed data for 2007–2009 after FAO (2018). All wheat yield and production data are shown at 0% moisture. Vertical bars (visible when larger than the symbol) represent the s.d. of the mean of the three models. Horizontal bars (visible when larger than the symbol) represent s.d. of the mean of observed yields and country production for 2007–2009. Large wheat producers include countries with wheat cultivated area between 2.7 and 26.9 million ha, medium producers report between 0.19 and 2.6 million ha, and small producers include countries with area between 0.00005 and 0.18 million ha.
Download figure:
Standard image High-resolution imageGenerally, the model ensemble captured country wheat yield levels for low-yielding and high-yielding countries with simulated yields between 0.6 and 8.3 t ha−1. However, the simulated yields tend to be overestimated, likely due to observed yield data containing some pest and disease effects, which are not considered in the crop model simulations (figure 3(b)). In addition, the presented data are an aggregation of diverse crop management practices, such as applications of fertilizer and irrigation, sowing dates, and cultivar choice, which all add to yield variation and uncertainty in the reported yields. Similarly, global country wheat production was captured well with the model ensemble for the top wheat producers, which represent more than half of the global wheat production, but less so for the medium and small producers (figure 3(c)). In addition, yield variability in the simulations was larger in the observed data due to different spatial resolution and higher simulated year-to-year variability.
When simulating the US yields, wheat yield for the baseline showed various growing environments with wheat yields of up to 5 t ha−1, but the national average is approximately 2.3 t ha−1. When comparing observed versus simulated US state wheat yields and production, the crop model ensemble mean often underestimated wheat yields likely due to lack of specific observed data at finer model resolution. In addition, poor quality reporting of production and harvested area and therefore yield could be another reason. National wheat production was poorly simulated for high and low wheat-producing states. A similar poor model performance was observed for US county wheat yields (figure 4).
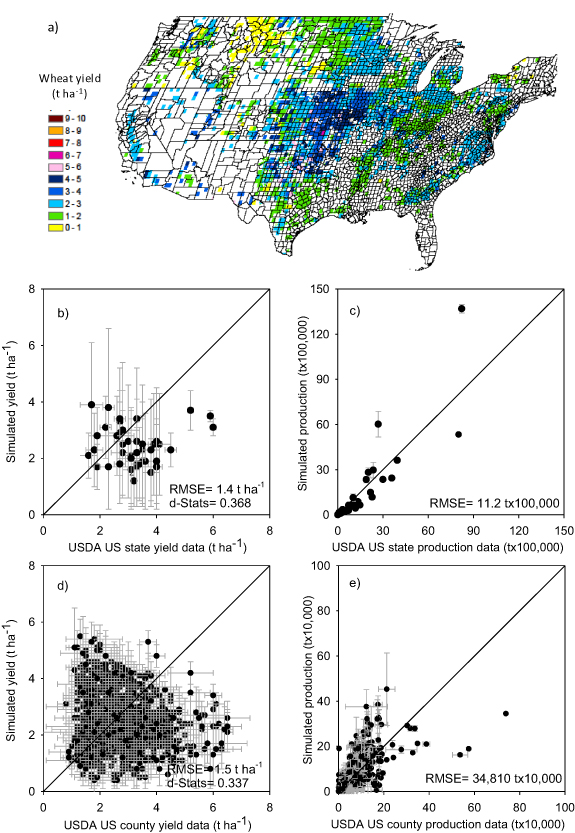
Figure 4. (a) Simulated model ensemble (mean of CROPSIM-CERES, CROPSIM and Nwheat models) USA aggregated (cells weighted for irrigated and rainfed production) wheat yields for baseline (1980–2010) using CIMMYT mega environment cultivar distribution at 0.5 × 0.5° pixels, (b) simulated versus observed yield, (c) simulated versus observed US state wheat production, (d) simulated versus observed wheat yield, and (e) simulated versus observed US wheat county production. Observed data for the 2005–2007 county and 2007–2009 state, from the United States Department of Agriculture (USDA). All wheat yield and production data are shown at 0% moisture. Vertical bars (visible when larger than the symbol) represent the s.d. of the mean of the three models. Horizontal bars (visible when larger than the symbol) represent s.d. of the mean of observed yield and county production for the 3 year period.
Download figure:
Standard image High-resolution image3.3. Climate change and adaptation strategy impacts
Simulation results indicated that climate change is projected to reduce global wheat production by mid-century (figure 5(a)), but with large differences across the globe. For example, areas in Western Europe showed a yield increase. France, a top wheat producer in Europe, showed mostly positive impacts on wheat yields. However, areas from the West of France projected reduction on wheat yields due to slightly higher temperatures compared to Central and East regions (figure 1). Russia was projected to have mostly a decline in wheat yield as result of warmer temperatures, despite the projected rainfall increase in this region. Canada, which mostly produces wheat during the springtime, was projected to have increased wheat yields under future climate, as warmer temperature was beneficial for crop growth and yield. The US showed variable responses to climate change with rainfed winter wheat under low rainfall conditions on the West and the Great Plains showing yield declines but also showing yield increases in high rainfall areas in the Northeast. South America showed mostly yield reductions as result of higher temperatures, mainly in South Brazil, Paraguay, and Bolivia. However, few areas in Northeast Argentina (Asseng et al 2013c), a large wheat-producing region, benefited from an increase in rainfall.

Figure 5. Maps of simulated model ensemble mean relative wheat yield change for (top panel) climate change impacts, where red circles and numbers represent African and South Asian (India, Pakistan, Bangladesh, and Nepal) countries combined, (middle panel) combined genetic traits (CGT) and (bottom panel) CGT and additional nitrogen application by 2050s. Values are the mean of 30 year, three crop simulation models (CROPSIM–CERES-wheat, CROPSIM and Nwheat, and five global climate models) for Representative Concentration Pathway 8.5 for 2050s, using CIMMYT mega environment cultivar distribution at 0.5 × 0.5° pixels.
Download figure:
Standard image High-resolution imageSimulations for South Asian countries suggested a different magnitude of climate change impacts with India and Pakistan being the most affected countries with a general decline of wheat yields of −16%, particularly due to warmer temperatures. However, areas in West Iran, Afghanistan, Nepal, and Burma could experience a positive response to climate change. African wheat-producing countries were mostly negatively affected by a −15% decrease due to the combined effects of warmer temperature, higher background temperatures, and a projected decline in rainfall, except for areas where there is already high rainfall during the season as in West Ethiopia and Zimbabwe. Egypt, one of the main wheat producers in this area, all irrigated, was simulated to have general declines of wheat yields due to warming temperatures by mid-century. Mediterranean-type climates in Spain and Australia, where wheat is mostly grown under rainfed conditions, were suggested to have detrimental wheat yields due to the combination of warmer temperatures and declining rainfall. Generally, small and low producers showed large negative climate change impacts in the future, indicating that less developed countries may be more affected by climate change by mid-century.
Adaptation strategies were projected to alleviate some of the climate change impacts in the future (figures 5(b) and (c)). Combined genetic traits (CGT) resulted in mostly positive yield impacts in the future, despite climate change, with significant increase mostly in non-limiting environments in terms of rainfall and nitrogen inputs such as Western Europe, parts of China, and the Northeastern US. However, in countries or regions with already low rainfall and low N inputs under rainfed conditions, the CGT resulted in further detrimental wheat yields. However, in total, global wheat production showed a small increase by mid-century with the suggested traits. When adding N fertilizer in addition to the suggested traits in the future, yields increased globally, indicating that improved cultivars will require more nutrients to express their potential in improving yields (figure 5). However, in areas such as the Western US and most regions in Russia, the suggested CGTs with additional N management alleviated only part of the negative impacts from climate change, resulting in negative overall impacts by mid-century in these regions.
Figure 6 shows global climate change and adaptation impacts on global wheat production weighted by country production levels. Climate change is projected to reduce global wheat production by −1.9%, but with the suggested adaptation strategies of CGT, yields will increase by approximately 4.7% and by 13.3% when implemented with additional N fertilizer. Spatial variability was much larger than climate and crop model uncertainty for all treatments, but climate uncertainty tended to be lower than crop model uncertainty.

Figure 6. Simulated global impact of climate change (weighted by production) for Representative Concentration Pathway 8.5 for 2050s. Error bars, indicating 10% and 90% variability of grid cells (left bar), crop model uncertainty (CROPSIM–CERES, CROPSIM and Nwheat, middle bar) and global climate model uncertainty (right bar).
Download figure:
Standard image High-resolution image
4. Discussion
A multi-climate/multi-crop model ensemble suggested that climate change may have variable spatial impacts on wheat yields with global production being projected to decline by mid-century. However, adaptation strategies including new traits and additional N fertilizer application could alleviate some of these impacts for key wheat-growing regions. The number of global modeling studies in the literature is scarce, mainly due to difficulties on measuring and estimating accurate input information at global scale especially for cultivar and crop management aspects. In a previous study, Gbegbelegbe et al (2017) used a single crop model, the CROPSIM–CERES wheat model, to simulate growth and development of wheat at a global scale using field experimental data from CIMMYT to calibrate yield components and grain yield for 17 wheat mega-environments, covering all global wheat areas. In the current study, two additional models were employed (CROPSIM and Nwheat) to improve model accuracy by using a multi-model ensemble mean and to be able to quantify model uncertainty. The multi-model ensemble with three crop models showed reasonable results for model calibration, and partially improved model accuracy for the global simulations, with a RMSE for grain yield of 1.3 t ha−1 and d-index of 0.84 (compared to RMSE of 1.3 t ha−1 and d-index of 0.79) for simulated versus FAO reported country-aggregated yield data. A similar methodology that incorporated the same three crop models was recently used in studies for wheat in Egypt and Mexico (Asseng et al 2018, Hernandez-Ochoa et al 2018, 2019), with similar impacts for these two specific countries. Xiong et al (2019) used the three DSSAT wheat models to study the contributions of climate model, crop model, parameterization and management to the overall uncertainty of yield simulation responses under future warming climate and found that total uncertainty for mid- and high latitudes (up to 50% on average) is larger than for low latitudes (about 24%). They found that crop model uncertainty was larger than the other sources combined, similar to our results. Xiong et al (2019) suggested that geospatial data and model parameterization, rather than the crop models are the main cause for this large uncertainty.
The comparison of simulated and recorded yield for states and counties in the US appear rather poor (RMSE of 1.4–1.5 t ha−1). This might point to shortcomings in global gridded models simulating lower scale regional yields. This might also be due to a mismatch of input information, like crop management of N and irrigation (if applicable), sowing and cultivar choices and aggregated yield records. Similar to country yield statistics, a lot of uncertainties are in regional yield records (Gbegbelegbe et al 2017), while the simulation-observation discrepancies appear less at the country scale. Additionally, the SPAM gridded maps used to process model simulation results when compared to state and county wheat yield data also resulted in additional uncertainty because they correspond to average wheat areas for specific years. However, actual changes in yield data depend on farmers' decisions regarding markets and socioeconomic changes. Reported USDA wheat yields are an aggregation of diverse crop management practices, including possible pest, disease, and weed effects, which the models do not consider, further adding to model-observation discrepancies.
Müller and Robertson (2014) using the DSSAT CERES wheat model reported climate change impacts ranging from −18% to −21% yield decline when using RCP 8.5 for mid-century, which are larger than the ones found in the current study. The higher magnitude of the impacts in their study occurred because they did not account for increased atmospheric CO2 concentrations. The global climate change impacts found in our study are also more conservative than the ones found by Rosenzweig et al (2014) for end of century, but there are similar trend patterns among regions especially on higher levels of warming and at low latitudes. Parry et al (2004) found similar country climate change impacts when using the highest emission scenario for mid-century, but negative impacts were more pessimistic than the ones found in this study. Challinor et al (2014) also showed a wide range of responses in a cereal yield meta-analysis for temperature impacts reported in the literature, but responses tended to be mostly negative, with approximately 70% of the studies showing negative temperature impacts by mid-century. Asseng et al (2019) used a 32‐multi‐model ensemble to simulate global wheat yield and reported a small positive impact of climate change on global wheat yield, which was likely due to several of the ensemble models not accounting for N limitations and therefore overestimating a possible atmospheric CO2 stimulus. The positive CO2 response varied depending on the region mostly due to temperature, water availability, and particularly nitrogen inputs, but it was often insufficient to overcome the negative impacts of climate change at global scale. Potential benefits of CO2 on grain yield could reduce the grain protein concentration, especially in low-rainfall regions with low N supply not compensating for the reduced protein due to elevated CO2 (Kimball et al 2001, Asseng et al 2019).
Climate change in high latitudes (e.g. France, Germany, and northern China, all large wheat-producing countries/region) show positive impacts on wheat grain yield as warming temperatures will also benefit wheat growth through an extended early spring growing season. But warmer temperatures and insufficient rainfall by mid-century, as projected at the same latitude in Russia and northwestern United States, will cause negative impacts on rainfed wheat. This disagrees with Webber et al (2018), Asseng et al (2019), Rosenzweig et al (2014), and Müller and Robertson (2014), who all found positive climate change responses for wheat yield in regions of high latitudes. At lower latitudes, close to the tropics and areas with already warm temperatures and insufficient rainfall such as North India, Pakistan, and Bangladesh in South Asia, which are highly dependent on irrigation, climate change was projected to have a detrimental response on wheat yield as seasonal temperature is already within the upper limits of optimum temperature, further increasing the risk of crop damage.
China, the largest wheat producer in the world, is projected to have mixed impacts from climate change. However, at the national scale wheat yields were simulated to slightly increase by approximately 1.2%. Chen et al (2018) used a crop model (MCWLA) and reported similar positive climate change impacts for wheat in China (approximately 4% increase). However, the slightly higher response in Chen et al (2018) was due to differences in considering solar radiation changes in the future (solar radiation was kept unchanged in our study, but allowed to change in the Chen et al (2018) study) and possible differences in simulated CO2 responses. Among large wheat-producing countries, India, Russia, Pakistan, and Morocco showed the largest yield reduction due to climate change, which agrees with Müller and Robertson (2014). The current simulations projected a climate change negative impact of −9.3% yield decline for Egypt, which is slightly more negative than the one projected by Asseng et al (2018) for this country. Webber et al (2018) analyzed the effects of climate change and abiotic stresses on wheat production across Europe and projected winter wheat yield increases by 4% for mid-century with CO2 fertilization effects taken into account and average growing conditions becoming more favorable in cooler climates.
The current results showed that combined genetic traits as an adaptation strategy could be used to alleviate climate change impacts, although responses varied widely depending on the growing environment and management practices in use. Ludwig and Asseng (2010) reported that increased early plant vigor improved wheat yields in a Mediterranean-type environment, but required additional N input, which was also observed in this study. They showed that late flowering may be beneficial under warmer temperatures, and could be the reason for a yield increase in South Brazil under future climate change. For example, in subtropical environments in South America a short period to flowering combined with an extended period of grain setting can increase wheat yield (Garcia et al 2011, Beche et al 2018). Early vigor was proposed to improve early root growth and increase nitrogen uptake during the vegetative stage (Liao et al 2004, Ludwig and Asseng 2010). This trait combined with late flowering could result in greater biomass and improve source-sink balance in warm environments where the phenological development is usually faster, except in region with prone to water stress, such as the Western US, most regions in Russia, Australia, and many of the African countries. Heat tolerance is also a trait of great importance to adapt to climate change to reduce the demanding impact from increasing temperature on photosynthesis and green leaf area, especially in low latitude regions (Xiong et al 2019). A limited response to the proposed traits generally occurred when yields were already limited by constraints in water and N stress and low levels of organic matter, besides temperature and rainfall changes. Traits that benefit biomass during vegetative stage, in some situations (e.g. low rainfall and heavy soils) can result in reduced soil water during grain filling and lower yields (Asseng et al 2003, Bourgault et al 2020). Hernandez-Ochoa et al (2019) simulated combined genetic traits, including early vigour, which resulted in positive yield impacts for irrigated systems but not under rainfed conditions. However, when additional N fertilizer was applied in combination with combined genetic traits yield response was positive for both irrigated and rainfed systems, but the increase in yield was much higher in rainfed systems, suggesting that response to combined genetic traits could be limited in environments with water and nitrogen stress. Bourgault et al (2020) found that early vigour under elevated atmospheric CO2 concentrations can lead to more severe terminal drought stress in rainfed systems as a result of more water use pre-anthesis and greater drought stress post-anthesis.
Extreme weather events could also become more frequent in the future and could be underestimated in this study as projections of heat damage effects are simulated by taking into account only changes in daily absolute temperatures and not possible changes in the frequency of occurrence. Another limitation is that most crop models miss functions for simulating excess water, an important cause of wheat yield variability across the world (Zampieri et al 2017), a pre-request for exploring adaptation traits for access water with crop models. Webber et al (2018) reported that drought is the most limiting climatic factor for winter wheat across Europe. Elevated atmospheric CO2 concentration could lead to increased water use due to enhanced leaf growth, despite an increased water use efficiency under elevated CO2, depending on the vigor of the crop and soil water availability. This could become a concern not only for Europe, but also for other important wheat-producing regions as global warming is projected to increase the frequency and intensity of severe water-scarcity events, especially in developing countries and low-income regions in Asia and Africa (Trnka et al 2019).
Globally, the nitrogen use efficiency of wheat is approximately 35% (Ortiz-Monasterio et al 2001). This could limit improved genotypes to express their potential under climate change conditions. In addition, there are limits to increase N inputs in agriculture as the cost of N has increased over the last decade due to its dependency on energy prices (Wiggins and Levy 2008). In France, N fertilization rates have declined since the 1980s also due to environmental concerns (Brisson et al 2010). In addition, N fertilizer contributes to greenhouse gasses and produces urea, which is a high-energy consuming process that further contributes to CO2 released to the atmosphere (Brunelle et al 2015, Millar et al 2018). Other practices that may improve soil organic carbon, such as slow-release fertilizers and conservation agriculture (Dolan et al 2006), were not considered in the current study, but could help to further improve nitrogen use efficiency. Response to new traits together with additional N fertilizer showed that N management and use efficiency are important factors to maximize genetic gains and overcome climate change impacts, which could also lead to higher profitability and a decreased risk of crop yield decline. While N is readily available in developed countries to achieve the benefits of new breeding lines, in developing countries, additional N fertilizer is often not available. Therefore, other additional approaches are needed, for instance by increasing the legume component in crop rotations to increase N availability for wheat (Franke et al 2018) or specifically breeding for increased nitrogen use efficiency (Cormier et al 2016) to enhance the response of the proposed higher yielding future cultivars.
5. Conclusions
Climate change is projected to decrease global wheat production by −1.9% by mid-century with the most negative impacts of climate change being projected to affect countries in Africa and South Asia, with average yield reductions of −15% and −16% by 2050. Global wheat production could also be largely affected, as top wheat-producing countries such as India, Russia, Australia and Pakistan are projected to have declining wheat yields. In general, wheat breeding with new traits is a promising climate change adaptation option, but its effect will vary among regions and especially could be limited under rainfed conditions where water and N stress limit benefits of traits for heat tolerance, early vigor, and delayed flowering adaptations. An increased N availability will often be required for new traits to express a higher yield potential. In many cases, region-specific adaptations to increasing temperatures and drought will be needed.
Acknowledgments
This study was supported by the CGIAR research program on wheat agri-food systems (CRP WHEAT), the CGIAR Platform for Big Data in Agriculture, the International Wheat Yield Partnership (IWYP115 Project), the Bill and Melinda Gates Foundation, the World Bank, the Mexican government through the Sustainable Modernization of Traditional Agriculture (MasAgro) project, and the International Treaty of Plant Genetic Resources for Food and Agriculture and its Benefit-sharing Fund for supporting the project with financial support from European Union. The views expressed here are those of authors and do not necessarily reflect the views of the funders or associated institutions.
Data availability statement
The data that support the findings of this study are available upon reasonable request from the authors.