
Abstract
An understanding of the role of hydro-climatic and geographic regimes on regional actual evapotranspiration (AET) change is essential to improving our knowledge on predicting water availability in a changing climate. This study investigates the relationship between AET change for a 60 year period (1951–2010) and the runoff sensitivity in 255 undisturbed catchments over the US. The runoff sensitivity to climate change is simply defined as the relative magnitude between runoff and precipitation changes with time. Runoff sensitivity can readily explain the conflicting directions of AET changes under similar precipitation change. Under increasing precipitation, AET decreases when runoff is increasing more rapidly than precipitation based on the water balance. Conversely, AET increases when runoff is decreasing more rapidly than precipitation. This result indicates that runoff sensitivity to climate change is a key factor for understanding regional water availability change at the catchment scale. In addition, a stepwise multiple regression analysis and a geographically weighted regression analysis show that the portion of evergreen forest and the mean elevation of a catchment may play a secondary role in the spatial pattern of the AET change, and the relative importance of such explanatory variables may change over space.
Export citation and abstract BibTeX RIS

Content from this work may be used under the terms of the Creative Commons Attribution 3.0 licence. Any further distribution of this work must maintain attribution to the author(s) and the title of the work, journal citation and DOI.
1. Introduction
Understanding a change in regional water availability in a warming world is a global challenge for supporting sustainable human society and ecosystem services (Barnett et al 2005, Milly et al 2005). Intensification of the hydrologic cycle with global warming resulting from the increased concentration of CO2 may alter precipitation patterns and terrestrial evaporation and transpiration processes, potentially threatening water security (Ohmura and Wild 2002, Bates et al 2008, Huntington 2006, Shi et al 2013, Guimberteau et al 2013). Recent studies attempted to explain historical AET changes based on direct and indirect indicators such as pan evaporation (Brutsaert and Parlange 1998, Roderick and Farquhar 2002), precipitation (Hobbins et al 2004), solar radiation (Teuling et al 2009, Wild et al 2005), and soil moisture (Jung et al 2010). The complementary relationship between apparent potential evaporation (e.g. pan evaporation) and terrestrial AET led to the observed decrease in pan evaporation during the second half of the 20th century, a significant indication of increased terrestrial AET in water-limited regions (Brutsaert and Parlange 1998, Roderick and Farquhar 2002, Golubev et al 2001, Brutsaert 2006).
The main driver of AET dynamics in the land–water cycle can vary regionally (Zhang et al 2001). In Europe, solar radiation is much more important in explaining AET change than precipitation, while in central North America, precipitation change is more important than solar radiation change for 1986–1995 (Teuling et al 2009). Although increased solar radiation has been reported since the 1980s in the US (Wild et al 2005), there is no significant relation between AET and solar radiation (Teuling et al 2009). In the US increased precipitation since the 1950s (Groisman et al 2004) probably made more soil moisture available for evaporation, which resulted in increased AET. Some evidence supports the hypothesis of increased AET in large US river basins (Walter et al 2004, Milly and Dunne 2001). However, the change of AET under climate change and land cover change and its implications to the regional hydrologic cycle still remain unclear at the catchment scale.
This study investigates historical AET trends over the conterminous US and its relation with regional runoff sensitivity and catchment characteristics. We seek to explain different spatial patterns in AET changes at the catchment scale using a simple water balance equation and graphical representation. In addition, we explore the effect of static regional variables on AET trends and how the relation between AET trends and these explanatory variables might vary over space. To do this, we employ a multiple regression analysis to identify the significant main drivers and a geographically weighted regression (GWR) model to investigate spatial dependency and spatial autocorrelation in the AET trend.
2. Materials and methods
A region's AET, if undisturbed by anthropogenic activities, can be estimated by a simple water budget as precipitation (P) minus runoff (Q) (equation (1)). The storage term fluctuations in soil infiltration and deep percolation can be negligible over an annual time scale (ΔS = 0 in equation (1)) (e.g., Zhang et al 2001, Teuling et al 2009, Walter et al 2004, Milly and Dunne 2001). Based on this assumption, equation (1) can be expressed in terms of the changes over time (equation (2)). The equation (2) explains that a runoff change with time (∂Q/∂t) and a precipitation (or air temperature) change with time (∂P/∂t) control AET change with time (∂AET/∂t). This study considers runoff sensitivity as the relative magnitude between runoff change with time (∂Q/∂t) and precipitation (or air temperature) change with time (∂P/∂t). Thus, high runoff sensitivity indicates that the long-term linear trend of annual runoff (∂Q/∂t) is steeper (greater absolute value) than annual precipitation (∂P/∂t) (or air temperature).


Annual AET was calculated as annual precipitation (mm) minus annual runoff (mm) for 255 catchments (see figure 1) in the conterminous US for water years (1 October–30 September) 1951–2010 (n = 60). The 255 USGS streamflow gauging stations were selected based on a criteria of having 60 water years of complete daily streamflow records from 2057 streamflow sites having unregulated catchments accessed from Geospatial Attributes of Gages for Evaluating Streamflow, version II (GAGES II, http://water.usgs.gov/GIS/metadata/usgswrd/XML/gagesII_Sept2011.xml) (Falcone 2011). In the US during the last 50 years increasing irrigation has significantly affected AET change (Guimberteau et al 2012). To minimize anthropogenic effects on AET changes we used the 255 catchments with unimpaired flow conditions (no significant diversions nor controlled by dams). The catchments chosen represent a wide range of physiographic regions in terms of climate, geology, soils, topography, and land use across the conterminous US (see the supplementary table available at stacks.iop.org/ERL/8/044002/mmedia). We calculated annual runoff using daily streamflow data for 255 sites obtained from the USGS National Water Information System (http://waterdata.usgs.gov/nwis/sw). Monthly precipitation and maximum and minimum air temperatures from the parameter-elevation regressions on independent slopes model (PRISM) 4 km × 4 km grid spacing dataset (www.prism.oregonstate.edu) were obtained to estimate annual precipitation and mean air temperature. PRISM annual precipitation and mean air temperature datasets are nationwide, spatially consistent, and temporally complete (1895 to the present) (Daly et al 1994). Gridded annual precipitation totals and annual mean air temperatures (the mean of maximum and minimum air temperatures) were spatially averaged over the 255 catchments for each water year from 1951 to 2010. A minimum of four PRISM grid points were used for estimating the area-averaged value of each catchment so as to reduce bias (weather noise) from a single grid point. Annual precipitation, mean temperature, and runoff data were normalized for each site by their mean and standard deviation to estimate a standardized score of a linear slope.

Figure 1. Linear trends in (A) annual AET and (B) annual precipitation for water years 1951–2010 (n = 60) for 255 undisturbed basins in the continental US. The non-parametric Mann–Kendall trend test is used to evaluate the statistical significance of the trends (P < 0.05).
Download figure:
Standard image High-resolution imageFor selecting significant explanatory variables (predictors), we used a stepwise regression method based on F tests for explanatory variable selection with F ≤ 0.05 as inclusion and F ≥ 0.10 as exclusion criterion. Multicollinearity was checked using a variance inflation factor (VIF) of 5 as a critical threshold (Haan 2002), and any redundant variables were removed for analysis accordingly. All 91 candidate explanatory variables were associated with catchment characteristics of climate (37), hydrology (18), land cover (16), soil (11), and topology (9). These variables were obtained from the GAGES II data (Falcone 2011).
To identify the spatial relationship between the AET trend and significant explanatory variables of the multiple regression analysis, we used geographically weighted regression (GWR) models available in ArcGIS 10.0. As a local statistic, GWR models yield different coefficient values for each study basin, and are well suited to identify how local factors affect the spatial variation in the AET trend (Chang et al 2012, Fotheringham et al 2002). We used the adaptive kernel with Akaike Information Criterion (AIC) estimated bandwidth in creating weight metrics because of the inhomogeneous distribution of the catchments in the US. The adjusted coefficient of determination (adjusted R2) and AIC were used for comparing ordinary least square (OLS) and GWR models to identify which model could interpret AET trends better. GWR models have been used for understanding spatial patterns of water use (Wentz and Gober 2007), water quality (Chang and Psaris 2013), and runoff trend (Chang et al 2012).
3. Results
Overall, annual AET over the past 60 years increased across the US, although it declined in some catchments (figure 1(A)). Our result supports the previous findings of AET trends during the past 60 years (Hobbins et al 2004, Walter et al 2004, Milly and Dunne 2001). Nationwide AET has increased annually +6.5 mm/decade computed as the difference between increased annual precipitation (+7.6 mm/decade) and increased annual runoff (+1.1 mm/decade) based on their mean annual values for the study basins. The AET trend is comparable to values obtained from large river basins in the US; +6.9 mm/decade for the Mississippi river basin (Milly and Dunne 2001), +3.9 mm/decade to +18.6 mm/decade for six large river basins and the Southeast basins (Walter et al 2004). These trends might be interpreted that increased AET resulted in lower rate of increased runoff even though precipitation increased at a higher rate. Locally, AET shows positive trends in 191 basins (75%), although only 49 basins (19%) are significant at the 0.05 significance level (figure 1(A)). The spatial pattern of AET trends (figure 1(A)) generally coincides with precipitation trends that exhibit increasing trends throughout the US with some exceptions in the Pacific Northwest, California, and the Midwest (figure 1(B)). In 73 basins (30%), AET and annual precipitation have opposite trends, indicating that their AET could be influenced by secondary drivers.
The 255 catchments are clustered into six different groups (figure 2(A)), based on the runoff sensitivity to precipitation change. However, the runoff sensitivity to air temperature change does not portray any apparent clustering (figure 2(B)), indicating that air temperature may not be a good predictor for explaining AET spatial patterns. Two groups (a) and (f) in figure 2(A) support the general hypothesis that precipitation change leads to AET change (e.g., Hobbins et al 2004). The two groups show low runoff change (∂Q/∂t) to precipitation change (∂P/∂t), indicating that these groups have low runoff sensitivity to precipitation change. However, groups (b) and (e) in figure 2(A) have high runoff sensitivity and opposing AET and precipitation trends. This is because increasing runoff (+∂Q/∂t in equation (2)) is steeper (greater) than increasing precipitation (+∂P/∂t in equation (2)) ((b) in figure 3(A)). Group (e) in figure 3(A) shows that the difference between precipitation and runoff widens with time because runoff is decreasing more rapidly than precipitation (−∂Q/∂t >− ∂P/∂t in equation (2)), resulting in increasing AET. Some basins in (b) in figure 2(A) show an increase in AET despite high runoff sensitivity. These basins have smaller runoff magnitudes compared to their precipitation magnitudes (runoff to precipitation ratios below 20%). Located in the Great Plains and Midwest, the basins have negligible runoff trends in relation to precipitation change. The trends of (c) and (d) in figure 2(A) can be understood by contradictory trends between precipitation and runoff. The contradictory trends include increased AET under increased precipitation ((c) in figure 3(A)), and decreased AET under decreased precipitation ((d) in figure 3(A)). Most of these groups are randomly distributed over the continental US, although group (e) dominates in the Pacific Northwest and group (a) dominates in the Great Plains (figure 3(B)).
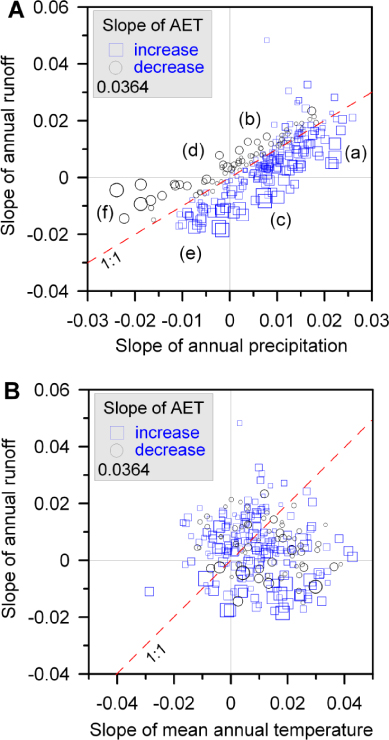
Figure 2. Relation among linear trends of (A) annual AET, runoff, and precipitation and (B) annual AET, runoff, and mean temperature. Squares (increasing slope of AET) and circles (decreasing slope of AET) show the direction and magnitude of the linear trend of AET for each of the 255 basins. The six lower-case letters in (figure 2(A)) indicates: (a) increasing AET with increasing precipitation and runoff, (b) decreasing AET with increasing precipitation and runoff, (c) increasing AET with increasing precipitation but decreasing runoff, (d) decreasing AET with decreasing precipitation but increasing runoff, (e) increasing AET with decreasing precipitation and runoff, and (f) decreasing AET with decreasing precipitation and runoff. Red dashed line indicates equal slopes for annual runoff and precipitation. The number (0.0364) indicates the magnitude of the reference symbol in the legend.
Download figure:
Standard image High-resolution image
Figure 3. (A) Linear trends in precipitation and runoff annual time series for six basins representing six different groups ((a)–(f) in figure 2(A)). s1 is the slope of annual precipitation and s2 is the slope of annual runoff. (B) The spatial distribution of the six groups. Red circle indicates the locations of the six basins.
Download figure:
Standard image High-resolution imageThe multiple regression analysis identifies annual precipitation and annual runoff trends, the portion of evergreen forest in a drainage area, and mean elevation as significant predictors of AET trends (p < 0.01). The multiple regression model explains 67% of the variance in AET trends with a significant F level (168.6). However, a regression model using only annual precipitation trend as an independent variable explains 14% of the variance in AET trends (p < 0.001,F = 43.8), and a regression model using only annual runoff trend explains 15% of the variance (p < 0.01,F = 6.2). Including both variables into the regression model can explain up to 63% of the variance in AET trends (p < 0.001,F = 215.9), indicating that runoff sensitivity is a key diagnostic criterion of AET change at a catchment scale.
It is well established that AET is closely linked with vegetation characteristics (Zhang et al 2001). In this study, the portion of evergreen forest in a drainage area is detected as a significant explanatory variable of the spatial pattern of AET trends. However, the portion of other vegetation types such as deciduous and mixed forest is not significant. The evergreen forest predictor is negatively correlated with the AET slope in basins where AET is decreasing (n = 64, Pearson's correlation coefficient is −0.56, p < 0.01). Whereas, there exists a positive correlation between the evergreen forest predictor and the AET slope in basins where AET is increasing (n = 191, Pearson's correlation coefficient is 0.47, p < 0.01). Such a contrasting relation suggests that other spatial factors might influence AET trends from basin to basin, which provides a rationale to use spatial techniques such as GWR that capture the spatially varying relationships between dependent and independent variables.
Maps of GWR coefficients for the four predictors show distinct spatial patterns (figure 4). Annual precipitation trend coefficients are higher in the West and Northeast than inland regions, suggesting that marine influence (possibly high advective winds) may have a positive effect on increasing AET trends (figure 4(A)). Annual runoff and annual precipitation trends are highly inversely correlated (figure 4(B)). Evergreen forest land cover coefficients are generally positive in the Midwest, Southeast, and Western US (with the exception of southern California) (figure 4(C)). The coefficient is negative in the Great Plains and the Northeast. The mean elevation coefficient map also exhibits an interesting spatial pattern (figure 4(D)). Elevation has a negative effect on AET trends in most of the western US and portions of the Midwest and the Northeast, suggesting that higher elevation areas may be experiencing the depletion of moisture available during the summer as a result of early snowmelt. In contrast, most lowlands along the Mississippi river (where mean elevations are significantly lower than other basins) portray positive coefficients.

Figure 4. The spatial variation of the geographic weighted regression coefficients of four explanatory variables (A) annual precipitation trend, (B) annual runoff trend, (C) the portion of evergreen forest in a drainage area, and (D) mean elevation. Blue circle indicates a positive coefficient and red circle indicates a negative coefficient.
Download figure:
Standard image High-resolution image
4. Discussion and conclusion
Our result demonstrates that identifying internal drivers (runoff sensitivity) can improve an understanding of long-term AET dynamics at a catchment scale and predicting regional water availability. Some studies quantified catchment runoff sensitivity using a water–energy balance framework (Renner et al 2012, Renner and Bernhofer 2012) and the Budyko framework (Roderick and Farquhar 2011). However, there is still no robust method of estimating runoff sensitivity across all catchments. In the future, runoff sensitivity might be altered episodically due to wildfire, deforestation and other anthropogenic effects, and gradually due to natural climate variability and global warming (Barnett et al 2005). In snowmelt-dominated regions, snowpack and snowmelt buffer against interannual precipitation change, resulting in relatively lower runoff sensitivity to precipitation change than in more rainfall-dominated regions. Although there is relatively little agreement among global climate models regarding the magnitude and direction of precipitation change, these models consistently project warmer climate in the 21st century (Randall et al 2007). If snowpack is reduced (or eliminated) in snow-dominated or snow-rain transient regions by future warming, runoff sensitivity will increase. Long-term prediction of water availability based on historical observations in snow-dominated regions will become more difficult to make because current snow-runoff forecast procedures assume stationarity (Milly et al 2008). However, it is not entirely clear how global warming is directly responsible for changes in AET and water availability (figure 2(B)). One possible reason is that a global warming signal is weaker than the variation of precipitation over the past 60 years. Continuous direct observations of AET (e.g., flux measurement by eddy covariance technique (Jung et al 2010)) and its indicators will be a clue for unveiling the relationship between the trend in terrestrial AET and global warming.
The dynamic relationship between AET and streamflow in a drainage basin is closely related to a nexus of water, energy and carbon cycles (Teuling et al 2009, Jung et al 2010). Despite the importance of AET in these cycles, their interactions remain unknown. Our finding demonstrates that the portion of evergreen forest in a drainage area significantly contributes to annual AET trends. This result reconfirms that vegetation type is an important indicator of predicting regional AET trends, although deciduous forest and other vegetation are not significant. However, the lack of long-term observation of forest cover change may underestimate the effect of vegetation on historical AET trends in this study. Also, we did not consider the effect of carbon dioxide (CO2) concentration on plant transpiration. To date, there is little agreement on the effect of higher CO2 concentration in the atmosphere on transpiration from vegetation. One hypothesis projects the decline of transpiration because the stomata of leaves will open less to take up the same amount of CO2 for photosynthesis (Gedney et al 2006, Betts et al 2007), while another hypothesis suggests that transpiration will increase due to increased plant growth resulting in increased leaf area (Bates et al 2008).
However, spatial analysis in our study indicates that the relationships between AET trends and explanatory variables vary spatially, indicating that the driving forces of AET trends for each basin might be different. A regional approach is useful for understanding the dynamics of changing water availability. Our spatial analysis results suggest an insight for understanding long-term AET trends at the catchment scale based on runoff sensitivity metrics and heterogeneous hydrologic landscape characteristics. The spatial pattern of AET trends can be explained by the complex combination of runoff trends, precipitation trends, portion of evergreen forest cover, and mean elevation at the basin scale. The changing signs of GWR coefficients suggest that the mechanisms of AET trends are not the same over space. By appreciating such local relationships across the continental US, we can plan for locally specific water budgets and thus sustainable water resource management strategies. Additionally, this study may contribute to improve our knowledge on the runoff response of an ungauged basin according to future climate change and land cover change.
Trend detection studies are often sensitive to dataset selection, data period, and detection methods, indicating that different conclusions might be drawn with different datasets, time periods, and methods (Bae et al 2008). Additionally, the trend analysis can be affected by changes in measurement techniques, measurement errors, varying station density, and changes in catchment land-surface characteristics. Therefore, considering these possible uncertainties in our results can provide a more accurate assessment of future water availability.
Acknowledgments
We thank two anonymous reviewers for their constructive and insightful comments. This research was partially supported by the US National Science Foundation under grant No. CR-1038925. Additional support for Jung was provided by Institute for Sustainable Solutions at Portland State University.