
Abstract
With a vast area of marginal land, the Loess Plateau of China is a promising region for large-scale production of second-generation energy crops. However, it remains unknown whether such production is sustainable in the long run, especially under climate change. Using a regional climate change model, PRECIS, we analyzed the impact of climate change on Miscanthus production in the Loess Plateau. Under three emission scenarios, A2, B2, and A1B, both the average yield and total area capable of supporting Miscanthus production would increase continuously in the future period (2011–2099). As a result, the total yield potential in the region would increase by about 20% in this future period from the baseline period (1961–1990). This was explained primarily by predicted increases in temperature and precipitation across the Loess Plateau, which improved the yield of the perennial C4 plants relying exclusively on rainfed production. The areas that are currently too dry or too cold to support Miscanthus production could be turned into energy crop fields, especially along the arid–semiarid transition zone. Thus the Loess Plateau would become increasingly desirable for growing second-generation energy crops in this century, which could in turn contribute to soil improvement and ecological restoration of the region.
Export citation and abstract BibTeX RIS

Content from this work may be used under the terms of the Creative Commons Attribution 3.0 licence. Any further distribution of this work must maintain attribution to the author(s) and the title of the work, journal citation and DOI.
1. Introduction
The development of second-generation energy crops on marginal land has great potential to provide a source of renewable energy (Heaton et al 2008b, Karp and Shield 2008, Oliver et al 2009, Somerville et al 2010). In addition to ensuring energy security, these energy crops with a high net energy output and a strong ability in carbon sequestration should also generate positive environmental effects such as mitigating climate change and ecological restoration (Anderson-Teixeira et al 2012, Gelfand et al 2013, Robertson et al 2008). Miscanthus is considered to be the most promising second-generation energy crop in China (Sang 2011, Sang and Zhu 2011). Miscanthus is a C4 perennial plant capable of producing a high biomass in cool climate regimes (Dohleman and Long 2009, Heaton et al 2004, 2008a, Naidu et al 2003), making it a suitable energy crop for growing in northern China where marginal land is particularly abundant (Liu et al 2012a, Sang and Zhu 2011, Tian et al 2009).
The Loess Plateau, a region of more than 60 million hectares (Mha) in northwestern China, is one of the most seriously eroded places in the world (Chen et al 2007). A previous study demonstrated that Miscanthus lutarioriparius, a species growing up to 7 m in its native habitats in central China, was able to adapt to semiarid areas and produced a high biomass in the Loess Plateau (Yan et al 2012). On the basis of this field experiment, a yield model was developed to estimate the yield potential of the Miscanthus energy crop across the Loess Plateau (Liu et al 2012b). Using climate and land-use data over the past 30 years, the study suggested that a total of 33.3 Mha of presumably marginal land would potentially be available for growing Miscanthus, with an estimated average yield of 16.8 tons per hectare per year (t ha−1 yr−1).
Energy crop production is a long-term effort and its yield potential is sensitive to a number of climate factors, including temperature, precipitation, and radiation. Therefore, addressing the question of how climate change would impact the yield and area available for growing Miscanthus in the Loess Plateau is crucial for making decisions on future bioenergy production. This issue in general has received increasing attention in many places worldwide (Bryan et al 2010, Haberl et al 2011, Lasch et al 2010, Sasaki et al 2009). Some studies suggested that the productivity of the Miscanthus × giganteus energy crop in Europe would decrease from 2020 or 2050 under different scenarios of climate change, leading to a reduction in precipitation (Hastings et al 2009, Tuck et al 2006). Nevertheless, second-generation energy crops, such as reed canary grass and Miscanthus, were expected to become better adapted to the higher latitudes due to temperature increases (Tuck et al 2006).
In China, the impact of climate change on crop production has been studied only for food crops, such as cereals (Chavas et al 2009, Liu et al 2010, Ren et al 2012, Tao et al 2009). Here we reported a detailed analysis of the impact of climate change on Miscanthus production in the Loess Plateau. Our analyses considered three IPCC SRES, A2, B2, and A1B emissions scenarios (Nakicenovic and Swart 2000), for the projections of the baseline (1961–1990) and future (2011–2099) periods. These were generated from one of two regional climate models that had been carefully validated and most frequently applied to food crop production in China (Lin et al 2005, Xiong et al 2009). The potential yield of the Miscanthus energy crop in the Loess Plateau was predicted to increase in the future period under all three scenarios compared with that in the baseline period due to increases in both temperature and precipitation. Certain areas of the region that are currently too cold and/or too dry to support Miscanthus production would become suitable for growing the energy crop under these scenarios of climate change. This work, adding to the previous studies, supported that the Loess Plateau could be a suitable place for Miscanthus production not only in the present but also into the distant future. The details from the analyses are instructive for the decisions to be made on the sustainable development of bioenergy in this region.
2. Material and methods
2.1. Study region
The Loess Plateau extends from central to northwestern China (34°–45° 5'N, 101°–114° 33'E). It belongs to the warm or temperate continental monsoon climate, which is dominated by the East Asian Monsoon (Chen et al 2007, Fu et al 2009, Wang et al 2011). The average annual temperature ranges from 6 to 10 ° C from northwest to southeast and the annual precipitation is largely between 300 and 600 mm. In particular, annual precipitation is unevenly distributed in the Loess Plateau, with the majority of precipitation occurring in July and August. The region spans from arid, semiarid to semihumid zones and therefore is considered to be a semiarid to semihumid transitional zone which is very sensitive to climate change.
2.2. Climate scenarios
Regional climate scenarios were generated by the regional climate change model PRECIS (Providing Regional Climates for Impacts Studies) (Jones et al 2004, Xu 2004, Zhang et al 2006). PRECIS took the output of the global model, HadAM3H, at its lateral boundaries using a high resolution (50 km × 50 km grid). There were 262 grid cells covering 62.4 Mha of the Loess Plateau. PRECIS simulated daily values of temperature, radiation, and precipitation in two periods, the baseline from 1961 to 1990 and the future from 2011 to 2099. Its performance in the simulation of China's climate was validated (Xu et al 2007). The scenarios of CO2 concentration followed the B2, A1B, and A2 emission scenarios, which presented low–medium–high emission based on the IPCC SRES storylines (Nakicenovic and Swart 2000). The CO2 concentration scenarios in PRECIS were derived from SRES emission scenarios which used a simple carbon cycle model and did not consider a potential acceleration in increasing CO2 concentrations due to climate–carbon cycle feedbacks.
Because different climate models simulated different response patterns in temperature and precipitation, it was important to compare the behavior of PRECIS with those from other climate models in order to reflect this source of potential uncertainty. A total of 17 climate models were available through the Program for Climate Model Diagnosis and Intercomparison (PCMDI) for the IPCC Fourth Assessment Report (Meehl et al 2007). Climate scenarios from PRECIS produced warming similar to the average from all of the 17 models for China but produced wetter conditions than the average from these models for China (Xiong et al 2008). A2 PRECIS predicted that precipitation increased 5% for the 2020s relative to the baseline, whereas the average of all models was 0.5%. For the 2050s, PRECIS predicted that precipitation increased 10%, while the all-model average was 3.6%. For the 2080s, it predicted that precipitation increased 15%, while the all-model average was about 10%.
2.3. Yield model
A yield model was previously developed for estimating the yield potential of Miscanthus energy crops in the Loess Plateau based on the yield of Miscanthus lutarioriparius measured in an experimental field located in Qingyang, Gansu Province in China in 2010 (Liu et al 2012b). This yield model was derived from the radiation model (Monteith 1977), especially with reference to its application in the field study of M. × giganteus (Beale and Long 1995). In the study of M. lutarioriparius, the model incorporated the variation of growing season length described by a nonlinear relation of annual accumulated temperature over 10 ° C. Water limitation reflected by precipitation was also taken into consideration, given that the Loess Plateau is largely an arid and semiarid area. According to the field data, we estimated the yield potential in Qingyang in 2010 to be 22.5 t ha−1 yr−1 after a two-year field experiment (Liu et al 2012b, Yan et al 2012). Using this model, we estimated the productivity of the energy crop each year in the baseline period (1961–1990) and the future period (2011–2099) at each grid cell using the annual incident radiation, annual accumulated temperature over 10 ° C (AT10), and annual precipitation at each grid cell in the Loess Plateau in the two periods.
Note that the yield was set to zero in the grid wherever annual precipitation was less than 250 mm or AT10 was less than 2000 degree days (Liu et al 2012b). Because the radiation data provided in the three climatic scenarios were not validated, we used the observed average radiation from 1961 to 1990 in each grid cell in the Loess Plateau to scale the radiation in the baseline. We also used the observed radiation in Qingyang from 2011 to 2012 to scale the radiation for the future period in order to be consistent with the radiation in Qingyang in 2010. Because considering land-use change over the 90-year period was not possible, this study did not include land quality in the yield model. As a result, this study focused on the impact of climate change on Miscanthus yield and the trend of potential yield rather than an estimate of the total potential yield in the Loess Plateau.
To evaluate the validity of the yield model that was developed based on biomass yield in the 2010 growing season, we tested the consistency between the measured and model-predicted yield for the 2011 and 2012 growing seasons. At the end of the growing seasons, plant height and tiller diameter of M. lutarioriparius planted in the Qingyang experimental field was measured. The biomass of these individuals was determined based on the relationship established from a linear regression analysis between biomass and plant volume obtained for 112 individuals in the 2010 growing season (Yan et al 2012). The plant volume was calculated from the plant height and diameter measured at the end of the growing season as a cone shape. The yields of 2011 and 2012 were predicted by the model using the climatic data of the year, including annual incident solar radiation, annual accumulated temperature, and annual precipitation. The same 112 individuals were compared for the three consecutive years using a t-test.
2.4. Data sources
Data for the annual incident solar radiation, annual accumulated temperature, and annual precipitation in 2010 and the radiation in 2011 and 2012 in Qingyang were obtained from daily data from the Xifeng Metrological Station adjacent to the Qingyang experimental site (Gansu, China). The radiation from 1961 to 1990 in the Loess Plateau was obtained from the China Meteorological Data Sharing Service System (http://cdc.cma.gov.cn/). Daily simulated radiation, temperature, and precipitation across the Loess Plateau in the baseline period from 1961 to 1990 and the future period from 2011 to 2099 were taken directly from RegCM3 output from Chinese Academy of Agricultural Sciences and used as the input necessary to drive the yield potential model above. All climate scenario datasets were compiled at a resolution of a 50 km × 50 km grid. The data were converted from geographic coordinates to projected coordinates in order to align them spatially and then assembled according to their geographical midpoints.
2.5. Simulation and statistical analyses
Given all the data described above, the annual yield potential at each grid cell in the Loess Plateau was calculated for the two periods using the yield model. Based on the simulated 90-year (from 2011 to 2099) yield potential dynamics, we calculated the trend of average yield change in the Loess Plateau and the trend of yield change at each grid cell using the linear regression method. Linear regression analysis was used to identify trends and the relative contributions of climatic variables in the simulated yield time series (Xiong et al 2012). The relative increasing percentage rate was also calculated, which was the increasing trend divided by the average yield. The trends of the change of annual precipitation, annual radiation, and annual AT10 were calculated at each grid cell in the future period using linear regression. All statistical analyses were conducted using R 2.15.1 for Windows (R Development Core Team 2011). We then used marginal analysis to identify the degree of the impacts of three climatic variables, annual precipitation, annual radiation, and annual AT10, on yield using the partial derivative of the yield. The maps of yield, the trend of yield change, the relative rate of yield change, the effect of three climatic variables on yield, and the trend of climate change were generated by interpolating between 262 grid cells in the Loess Plateau.
3. Results
Under the three climate scenarios, we obtained the basic patterns of climate change for the baseline (1961–1990) and the future (2011–2099) periods at 262 grid cells (50 km × 50 km grid) covering 62.4 Mha of the Loess Plateau. At first, the average change of a climatic variable at all grid cells was calculated for the baseline and future periods (figure S1, available at stacks.iop.org/ERL/8/044003/mmedia). Annual precipitation in the Loess Plateau increased slightly from the baseline to future periods, while its fluctuation range nearly doubled (figures S1(a)–(c)). Annual radiation decreased slightly, while its variation increased from the baseline to the future period (figures S1(d)–(f)). Annual accumulated temperature (AT10) increased conspicuously from the baseline to the future periods, with the increase especially rapid after 2040 (figures S1(g)–(i)).
Next, trends in the change of the three climatic variables from 2011 to 2099 under the three scenarios were compared at each grid cell using linear regression. The trend in annual precipitation did not decrease significantly at any grid cell under any scenarios (figures S2(a)–(c), available at stacks.iop.org/ERL/8/044003/mmedia). There were significantly (P < 0.05) increasing trends in about 20% of the grid cells on average in the three scenarios and those at the remaining grid cells did not change significantly. Annual radiation did not change significantly in about 66% of the grid cells on average in the three climate scenarios (figures S2(d)–(f)). It decreased significantly (P < 0.05) in about 32% of the grid cells. The map showed that the decreasing trends concentrated in the northern and northwestern parts of the region. As for annual AT10, there were significantly (P < 0.05) increasing trends in all of the grid cells across the Loess Plateau under all scenarios (figures S2(g)–(i)).
Next, we calculated the average annual yield potential of Miscanthus throughout the Loess Plateau over 30 years for the baseline and over 90 years for the future. Compared with the baseline, the average annual yield, the area available (yield larger than zero), and total annual yield all increased in the three climate scenarios. The average annual yields increased roughly from the northwestern to southeastern areas under all three scenarios (figure 1). The average annual yield was 16.92, 18.67, 18.46, and 19.04 t ha−1 yr−1 in the baseline and the A2, B2, and A1B scenarios, respectively (figure 2(a)). The area available for growing Miscanthus energy crops was 52.19, 57.44, 56.02, and 57.35 Mha in the baseline and the A2, B2, and A1B scenarios, respectively (figure 2(b)). The land available for Miscanthus production apparently extended westward from the baseline to the future. Total annual yield was 0.88, 1.07, 1.03, and 1.09 billion tons in the baseline and the A2, B2, and A1B scenarios, respectively (figure 2(c)).
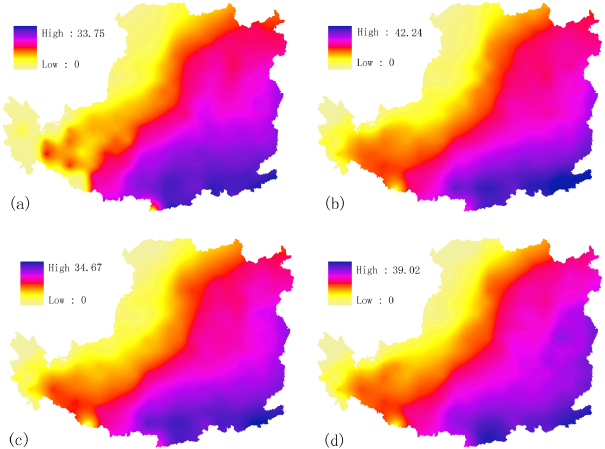
Figure 1. Maps of the annual yield potential of Miscanthus lutarioriparius in the Loess Plateau of China for the baseline (1961–1990) and future (2011–2099) periods under the three climate change scenarios considered by the regional climate model, PRECIS. (a) Baseline, (b) future under the A2 scenario, (c) future under the B2 scenario, and (d) future under the A1B scenario.
Download figure:
Standard image High-resolution image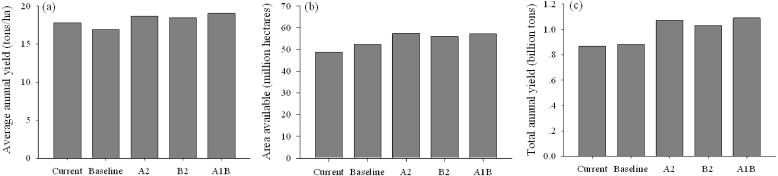
Figure 2. Comparison of the potential yield and area available for growing Miscanthus between the present and future periods. (a) Average annual yield, (b) area available, and (c) total annual yield in the Loess Plateau. Baseline, future scenarios (A2, B2, and A1B), and the presumable current situation estimated previously from the climatic data of the past 30 years (Liu et al 2012b) were compared.
Download figure:
Standard image High-resolution imageFor the trend of average yield change across the Loess Plateau, linear regression indicated that the trend increased significantly (P < 0.05) in the future period under all scenarios (figure 3). At each grid cell, the trend of yield change in the future was tested by linear regression and the slopes of the linear trend varied from 0.049 to 0.225 t ha−1 yr−1, from 0.013 to 0.191 t ha−1 yr−1, and from 0.022 to 0.214 t ha−1 yr−1 in the A2, B2, and A1B scenarios, respectively (figure 4). Under the three scenarios, the areas with rapid increases were located largely in the west and northeast of the Loess Plateau. The trends in the southeastern corner differed among the three scenarios, implying certain uncertainties in the model prediction. When the relative increasing percentage rate was used to evaluate the trend, they were more consistent among the three scenarios (figure 5). The slopes of the linear trend spanned from 0 to 4.13%, from 0 to 3.92%, and from 0 to 4.30% in the A2, B2, and A1B scenarios, respectively. The increase was most rapid in the west.
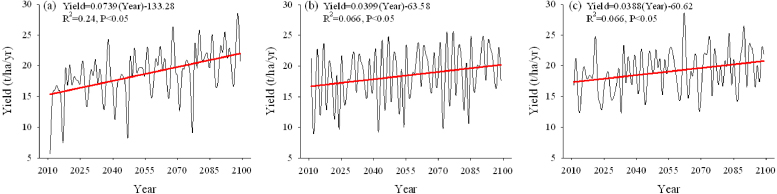
Figure 3. Average annual yield of Miscanthus in the Loess Plateau for the future period under the three climate change scenarios considered by the regional climate model, PRECIS. (a) A2, (b) B2, and (c) A1B. Red line represents linear regression.
Download figure:
Standard image High-resolution image
Figure 4. Maps of the trend of yield change on a 50 km × 50 km grid across the Loess Plateau. Color coding indicates the change from the lowest to the highest for the future period predicted under the three scenarios by the PRECIS model. (a) A2, (b) B2, and (c) A1B.
Download figure:
Standard image High-resolution image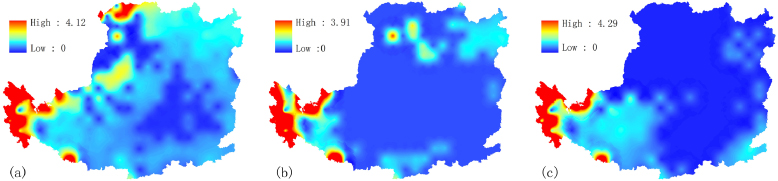
Figure 5. Maps of the relative rate of yield change on a 50 km × 50 km grid across the Loess Plateau. Color coding indicates the relative change from the lowest to the highest for the future period (2011–2099) predicted under the three scenarios by the PRECIS model. (a) A2, (b) B2, and (c) A1B.
Download figure:
Standard image High-resolution imageMarginal analysis was used to estimate the impacts of the three climatic variables on the yield at each grid cell and indicated that they were similar among the three climate scenarios. Annual precipitation had the largest impact on yield, especially in the northern (0.04 on average) and middle (0.03 on average) parts of the regions (figures 6(a)–(c)). The variable with the next level of impact was annual AT10, with the areas that were highly impacted (0.035) located in the southwestern and northeastern corners of the region (figures 6(g)–(i)). As for annual radiation, the impact was relatively weak, with an increase from the northwest (nearly 0) to the southeast (0.006) across the Loess Plateau (figures 6(d)–(f)).

Figure 6. Maps of the effect of the three climatic variables on yield on a 50 km × 50 km grid across the Loess Plateau. Color coding indicates the magnitude of the effect from the lowest to highest for the future period predicted under the three scenarios by the PRECIS model. (a)–(c): precipitation, (d)–(f): radiation, (g)–(i): temperature under scenarios A2, B2, and A1B, respectively.
Download figure:
Standard image High-resolution imageThe yield model was validated by analyzing biomass and climatic data obtained in Qingyang for the 2011 and 2012 growing seasons. A linear regression without intercept of the tiller biomass with the tiller volume measured in 2010 in Qingyang had an R2 = 0.93 (P < 0.05,n = 112) with a linear coefficient of 0.68 (figure S3, available at stacks.iop.org/ERL/8/044003/mmedia), suggesting that tiller volume was a good estimate of biomass. Using the established relation between the biomass and the volume of the largest tiller in an individual in 2010, we estimated the biomass of the same 112 individuals in 2011 and 2012 based on the height and diameter of tillers measured at the ends of the growing seasons. The yields for these two years were also calculated using the yield model and compared with the field measurements (figure S4, available at stacks.iop.org/ERL/8/044003/mmedia). The yield measurements were not significantly different from the model prediction for the 2011 and 2012 growing seasons (P = 0.55,n = 112; P = 0.10, n = 112; t test). This suggests that the yield model developed based on the yield measurements of the 2010 growing season can reliably predict the yield of the subsequent growing seasons. Thus, the measurements of the individuals of M. lutarioriparius with different genotypes over the three growing seasons provided a unique opportunity for testing the response of biomass yield to climatic factors and the validation of the yield model.
To investigate land-use change under the climate scenarios, we defined grid cells suitable or unsuitable for energy crop production. If the yield at a grid cell was always above zero in consecutive 10 years, we considered the grid cell to be suitable for planting Miscanthus. Otherwise, it was considered to be unsuitable. Based on the annual yield potential calculated across the Loess Plateau, we obtained the transition from suitable to unsuitable grid cells and vice versa between the baseline and future periods (figure 7). Of 262 grid cells, 180, 175, and 185 remained suitable for growing Miscanthus in the A2, B2, and A1B scenarios, respectively. The number of the grid cells remaining unsuitable was 41, 52, and 39 in the A2, B2, and A1B scenarios, respectively. They were located primarily in the northwest of the region. The number of grid cells changing from suitable to unsuitable was much larger than other way around. The former had 38, 32, and 37 grid cells and the latter had only 3, 3, and 1 grid cells in the A2, B2, and A1B scenarios, respectively. Land-use change occurred primarily along the line dividing the arid and semiarid zones of the Loess Plateau.

Figure 7. Maps of land-use change at 50 km × 50 km grid cells across the Loess Plateau in the future period predicted under the three scenarios by the PRECIS model. Yellow: land remaining unsuitable for growing Miscanthus; red: land changing from unsuitable to suitable; black: land changing from suitable to unsuitable; green: land remaining suitable. (a) A2, (b) B2, and (c) A1B.
Download figure:
Standard image High-resolution image
4. Discussion
4.1. Change in potential yield and growing area of Miscanthus energy crop
Under the climate change scenarios, our model predicted that Miscanthus yield in the Loess Plateau increased in the future. Comparing with the baseline, the average yield at all grid cells in the Loess Plateau would increase 10.3%, 9.1%, and 12.6% in A2, B2, and A1B scenarios, respectively (figure 2). The average yield potential of the baseline was 16.9 t ha−1 yr−1, very close to the value of 16.8 t ha−1 yr−1 estimated previously using the climate data of the past 30 years (Liu et al 2012b). This indicated that the climate parameters inferred from the climate change model and validated by the previous studies were reasonably close to the real situation in the past.
In addition to the increase in the average yield potential, the area available for growing Miscanthus energy crops would also increase in the Loess Plateau for the future period. In comparison with the baseline, the area of land potentially available increased by 10.1%, 7.3%, and 8.9% in A2, B2, and A1B scenarios, respectively (figure 2). Because the land available and average yield both contributed to energy crop production, the increase in the total yield of Miscanthus reached high percentages for the entire Loess Plateau, 21.6%, 17.0%, and 22.4% in A2, B2, and A1B scenarios, respectively.
This impressive level of yield increase was at least partly owing to trends of increase that continued without major setback throughout the future period (figure 3). In contrast, the previous studies reported that the production of Miscanthus in Europe would decrease from 2020 or 2050 under various scenarios due primarily to a reduction in precipitation (Hastings et al 2009, Tuck et al 2006). Thus, the Loess Plateau would be a desirable place for the large-scale production of energy crops from now into the future.
4.2. Climatic factors influencing future energy crop production
The marginal analyses showed that an increase in precipitation had the largest impact on yield, followed by an increase in temperature in the Loess Plateau. Changes in radiation had little effect on the yield. Specifically, the average contribution of annual precipitation to yield was 0.0375, i.e., 1 mm precipitation led to an additional 0.0375 tons of biomass per hectare per year. This was twice as much as the contribution of a temperature increase. The Loess Plateau mainly consists of arid and semiarid areas, such that water shortage has been the key limiting factor for the yield of food crops that rely exclusively on rainfeed. The relative increase was especially sharp in the western part of the Loess Plateau, which is relatively dry and cold at the present time.
The area available for growing Miscanthus would increase mainly because some parts change from unsuitable to suitable for energy crop production. The land was assumed to be unsuitable if annual precipitation was less than 250 mm or AT10 was lower than 2000 degree days (Liu et al 2012b). With the climate change, the trend of increase in precipitation and AT10 would change land use mainly from unsuitable to suitable. The combination of the two factors also led to such a change concentrating in the arid–semiarid transition zone which marginally supports energy crop production under the present climatic conditions.
The study of the impact of climate change on food crop production in this region also predicted a generally increased trend of precipitation and yield. Li et al (2011) used the WEPP model and reported a change of −17–25% for wheat yield and −2–39% for maize yield in the next 40 years using the projection of −2.6–17.4% change of precipitation. Another study reported a similar result, but the food yield would increase slightly in the next 40 years, along with a 23–37% predicted increase in annual precipitation (Zhang and Liu 2005). In comparison with food crops, the energy crop would have a more sensitive response to the increase of precipitation. This is likely because the biomass yield has a better linear relationship with water availability under rainfed conditions than grain yield. Moreover, the positive response to the temperature increase is probably also quite unique to the C4 energy crop. A comparison of the response of food and energy crops to climate change will be an interesting topic to study for a region such as the Loess Plateau where both crops are likely to coexist.
Under all scenarios, atmospheric CO2 concentration will increase in the future. Because such an increase is likely to have rather little impact on the productivity of C4 plants (Leakey et al 2009, de Souza et al 2013), CO2 concentration was not incorporated into the yield model. Nevertheless, there have been reports that the change in CO2 concentration might play a role in water uses, such as evapotranspiration, which in turn indirectly affect photosynthesis and yield, especially under drought conditions (Leakey et al 2009, Hussain et al 2013). Future studies focused on the impact of growing Miscanthus energy crops on soil water content and even the regional hydrologic cycles are needed to paint a more complete picture of yield changes under climate change (Le et al 2011).
4.3. Land-use changes for sustainable energy crop production
In a previous study using the recorded climate data of the past 30 years, it was estimated that an area of nearly 49 Mha could potentially support Miscanthus production in the Loess Plateau (Liu et al 2012b). More than 15 Mha of this was considered to be high-quality cropland, pasture or land suitable for afforestation, which should be dedicated for growing food crops to ensure food security. Under the scenarios of climate change, land that could potentially support Miscanthus production increased to about 57 Mha by the end of the century. This was due primarily to the change of land incapable of supporting Miscanthus production into land suitable for growing the energy crop as a result of increases in annual temperature and/or precipitation. Meanwhile, it was inevitable that land previously suitable for growing energy crops would change into high-quality cropland or pasture with the climate change, which would reduce the total area of marginal land that can actually be utilized for producing energy crops. This trend of land-use change, however, was not estimated in this study because more detailed land-use criteria for food and energy crop production had yet to be established.
In any event, land-use change in either direction would generate positive environmental effect in the Loess Plateau. Growing perennial energy crops on land with relatively poor natural conditions can lead to additional soil carbon accumulation and the improvement of soil structure and function (Lal 2004, Matamala et al 2008, McLauchlan et al 2006, Post and Kwon 2000). Restored soil fertility will further reduce soil erosion and improve land productivity. In the case that marginal land used for energy crop production is converted to cropland with the climate change, the land would benefit from growing perennial energy crops in terms of soil improvement. In essence, energy crop production for at least a period of time in the region suffering from serious erosion would function as means of ecological restoration. This, combined with the climate change, would create a larger area of high-quality cropland in the Loess Plateau, currently one of the most seriously eroded regions in the world.
Thus, the interchange between land for food and energy crop production may contribute to the development of a more sustainable agricultural system in regions where land had been overused for growing annual food crops and suffered from erosion and degradation. The rotation between food and perennial energy crops, especially with climate change taken into consideration, would give rise to a new agricultural system balancing food and energy crop production in the long run.
In addition to this overall strategy, this study provides a map of energy crop yield trends under scenarios of climate change. Across the region, it could form a basis for guiding long-term bioenergy development and ecological restoration in the Loess Plateau. Obviously, there is still much room for further analyses that would ensure more accurate and detailed guidance for economic and environmental development. There is a need to establish more detailed and grounded models based on an understanding of the response of Miscanthus production to climate change. In particular, the availability of additional sources of climate change scenarios at a finer resolution in the regional climate model will help in evaluating and improving the analyses.
5. Conclusions
This study indicated that the Loess Plateau would continue to be a desirable region for large-scale production of Miscanthus energy crops under the scenarios of climate change in this century. The predicted increases in temperature and precipitation together led to increases in per hectare yield and area suitable for growing this C4 perennial grass in the Loess Plateau. The establishment of a new agricultural system with both food and energy crops would provide opportunities for the long-term sustainable development of the economy and environment of the region. Appropriate land-use changes associated with the rotated production of food and energy crops would contribute to food security, renewable energy development, and ecological restoration.
Acknowledgments
We thank Yinlong Xu for providing climate data generated by the PRECIS model, Changbo Liu for technical assistance in data processing, and Juan Yan for helpful comments on the manuscript. The work was supported by the Key Program of the National Natural Science Foundation of China (91131902) and the Knowledge Innovation Program of the Chinese Academy of Sciences (KSCX2-EX-QR-1).