

Abstract
In the last few decades, temperatures in the Arctic have increased twice as much as the rest of the globe. As permafrost thaws in response to this warming, large amounts of soil organic matter may become vulnerable to decomposition. Microbial decomposition will release carbon (C) from permafrost soils, however, warmer conditions could also lead to enhanced plant growth and C uptake. Field and modeling studies show high uncertainty in soil and plant responses to climate change but there have been few studies that reconcile field and model data to understand differences and reduce uncertainty. Here, we evaluate gross primary productivity (GPP), ecosystem respiration (Reco), and net ecosystem C exchange (NEE) from eight years of experimental soil warming in moist acidic tundra against equivalent fluxes from the Community Land Model during simulations parameterized to reflect the field conditions associated with this manipulative field experiment. Over the eight-year experimental period, soil temperatures and thaw depths increased with warming in field observations and model simulations. However, the field and model results do not agree on warming effects on water table depth; warming created wetter soils in the field and drier soils in the models. In the field, initial increases in growing season GPP, Reco, and NEE to experimentally-induced permafrost thaw created a higher C sink capacity in the first years followed by a stronger C source in years six through eight. In contrast, both models predicted linear increases in GPP, Reco, and NEE with warming. The divergence of model results from field experiments reveals the role subsidence, hydrology, and nutrient cycling play in influencing the C flux responses to permafrost thaw, a complexity that the models are not structurally able to predict, and highlight challenges associated with projecting C cycle dynamics across the Arctic.
Export citation and abstract BibTeX RIS
1. Introduction
Permafrost soils contain 1460–1600 Pg (1015 g) carbon (C), a stock roughly double in size to the C presently in the Earth's atmosphere (Hugelius et al 2014, Schuur et al 2015, Strauss et al 2017). Continuously frozen soils keep the C stocks buried in permafrost, which is widespread across an area that covers 24% of the terrestrial Northern hemisphere (Brown et al 2002). Over the last few decades, the Arctic has been experiencing rapid increases in temperature (Huang et al 2017, Richter-Menge et al 2017), and frozen ground conditions are projected to become less stable in the coming decades (Romanovsky et al 2010, 2012). Warming and drying threaten permafrost in upland ecosystems as a result of increased natural drainage as the water table descends (Hinzman et al 2005, Liljedahl et al 2016). In low lying areas the reverse occurs, and ground subsidence caused by permafrost thaw can create anoxia as the topography and the underlying permafrost prevent runoff. Once thawed, organic matter is vulnerable to decomposition, and large amounts of C from permafrost ecosystems are projected to be released to the atmosphere in the form of carbon dioxide (CO2) and methane (e.g. Schädel et al 2014, Schuur et al 2015). Any additional release of C to the atmosphere has the potential to amplify climate change and the permafrost C feedback, although the magnitude of the response is highly uncertain.
The representation of permafrost C dynamics in process-based Earth system models remains a crucial challenge in projecting potential C cycle—climate feedbacks (McGuire et al 2018). Manipulative experiments provide opportunities to inform these long-term projections about the magnitude, and underlying mechanisms of permafrost C dynamics in a changing Arctic (Oberbauer et al 1992, Mauritz et al 2017, Christiansen et al 2018). Chamber based field CO2 flux measurements represent the balance of gross primary productivity (GPP) and ecosystem respiration (Reco) and document gains and losses of C in response to environmental change. Experimental soil warming in the field can be achieved by installing snow fences that passively warm the soil during winter months (Dorrepaal et al 2009, Natali et al 2011, Johansson et al 2013, Leffler et al 2016, Christiansen et al 2018). This type of passive warming is distinct from air warming and active soil warming techniques, which are not covered in this manuscript.
While field-based experiments provide detailed information on process-based mechanisms and small-scale variations in C dynamics in response to warming, they are limited in space and time and rarely extend beyond a decade. Process-based models have been used for circumpolar projections of near-surface permafrost degradation (Lawrence and Slater 2005, Lawrence et al 2012, Slater and Lawrence 2013, Koven et al 2013a) and C dynamics under various scenarios of future warming (Koven et al 2011, Schaefer et al 2011, MacDougall et al 2012, Schaphoff et al 2013, Schneider von Deimling et al 2012, 2015, Koven et al 2015b, Burke et al 2012, 2017). Differences in modeled permafrost extent and C dynamics among models are large and disagree on estimation of present-day permafrost extent, the size of the permafrost C pool, and the timing and amount of permafrost C release and plant C uptake. A recent model intercomparison project assessed permafrost degradation, changes in soil and vegetation C, and whole ecosystem C for low and high emissions pathways (Representation Concentration Pathways, RCP4.5 and RCP8.5, (McGuire et al 2018)). For most models, net loss of ecosystem C would not occur until after 2100 as vegetation gain would offset soil C losses until then. By 2300, soil C losses exceeded gains in vegetation C but variation among models was large. The lack of agreement across models is striking and implies that new ways to evaluate and improve the underlying biogeophysical and biogeochemical processes in these models is required.
One method towards improving model performance is to utilize field experimental data to examine model responses to environmental perturbations. Here, we use eight years of field-based measurements of CO2 dynamics from a unique snow-fence experimental field warming study, in which permafrost is experimentally degraded in an upland tundra site, and compare it with Community Land Model (CLM) simulations that replicate the field experiment. Using results from grid cells that broadly represent active layer thickness (ALT) and productivity in control plots, we evaluate the modeled CO2 response to warming and compare it to equivalent results from the field experiment. The objectives of this study are to: (1) compare the magnitude and pattern of environmental variables in CLM4.5 and 5.0 relative to experimental warming in the field; (2) evaluate annual and seasonal responses of ecosystem CO2 dynamics that are simulated by the model after eight years of warming, and (3) identify key drivers responsible for variation and bias between field and model responses.
2. Methods
2.1. Field experiment
In this field-to-model comparison, we used eight years of data (data citations are provided in the supplementary material, available online at stacks.iop.org/ERL/13/105002/mmedia) from an experimental field warming study that was established in the fall of 2008 (Natali et al 2011). The Carbon in Permafrost Experimental Heating Research site is situated in upland moist acidic tundra in the Eight Mile Lake Watershed (−149.23°W, 63.88°N, 670 m.a.s.l.) and is completely underlain by permafrost (Osterkamp et al 2009, Schuur et al 2009). The area is characterized by degrading permafrost and a mean annual air temperature of −0.94 °C from 1977 to 2015 (Healy and McKinley Stations, Western Regional Climate Center and NOAA National Centers for Environmental Information). The vegetation is dominated by the graminoid Eriophorum vaginatum, mosses, vascular plants, and deciduous shrubs (Schuur et al 2007, Natali et al 2011, Deane-Coe et al 2015, Salmon et al 2016). Experimental warming is imposed by installing six snow fences that accumulate snow, insulate the ground and increase surface and deep soil temperatures during the winter and into the spring. The unique feature of this experimental setup is the springtime removal of the additional snow prior to melt out. Snow removal from the warmed plots prevents a delayed start of the growing season and avoids additional water input. Details of the experimental design can be found in Natali et al (2011); numerous publications address the effects of warming and permafrost degradation on aboveground biomass (Deane-Coe et al 2015, Salmon et al 2016), nitrogen (N) availability (Salmon et al 2016), vegetation phenology (Natali et al 2012), and gaseous C fluxes (Natali et al 2014, Mauritz et al 2017).
Net ecosystem exchange (NEE) was measured between May and September using an automated chamber system, and CO2 concentrations were measured continuously using an infrared gas analyzer (LI-820, LICOR Corp., Lincoln Nebraska). We obtained net NEE values by gap-filling using a hyperbolic light-response curve, and Reco was modeled using an Arrhenius-type temperature response and soil temperature at 10 cm. Gap-filling was used to fill in missing data and to estimate Reco under low light conditions (when photosynthetically active radiation was <5 μmol m2 s−1; details can be found in Mauritz et al (2017)). GPP was calculated as GPP = NEE − Reco, where positive NEE values denote a CO2 sink. Annual NEE was estimated by using the average of two non-growing season Reco models developed by Webb et al (2016) for the non-growing season months (October–April).
Aboveground plant biomass during the first five years of the field experiment is calculated using a point intercept method and site-specific allometries based on harvests performed at this site (Salmon et al 2016). No direct measurements of aboveground biomass were performed for the last three years of the field experiment.
2.2. Model experiments
Two versions of CLM were used for the model simulations, CLM4.5 (Oleson et al 2013) and CLM5.0 (http://www.cesm.ucar.edu/models/cesm2/land/). CLM4.5 includes processes that permit simulation of critical thermal, hydrologic, and biogeochemical processes that are relevant for permafrost and its response to climate change (Koven et al 2013b, Lawrence and Slater 2005, Lawrence et al 2008, Riley et al 2011, Swenson et al 2012). CLM5.0 includes numerous changes and additional processes, including, critically for this comparison, a reformulation of the coupling between C and N cycles that in principle permits plants to uptake N during periods when they are not photosynthesizing. For each model, a control and snow-fence simulation was performed at 0.5 degree resolution for Alaska and Western Canada (Southwest bound: 58°15'N, 179°45'W; Northeast bound: 84°45'N, 95°15'W, figure S1) with transient atmospheric forcing from the GSWP3 version 1 climate reanalysis http://hydro.iis.u-tokyo.ac.jp/GSWP3/. Simulations were spun up to steady state conditions by cycling over atmospheric conditions from 1901–1920. Subsequently, transient control simulations followed the typical land only protocols over the 20th century (Oleson et al 2013, Koven et al 2013b). In the snow-fence simulation, the effects of the field snow-fence on ground temperature were replicated by decreasing the snow thermal conductivity by 50%, which effectively increases the snow insulation and warms the ground without affecting the water budget of the model. The reduced snow thermal conductivity was used for the period September through March. On April 1, the snow conductivity was reverted to its standard value, following the snow removal in the field experiment. To best match the vegetation characteristics at the field site, all of the grid cells in the domain used the same Arctic C3 grass plant functional type (PFT), which is the CLM PFT that represents tundra.
Analyses centered on edaphic conditions and C fluxes during the first eight years of warming. We focused data analyses and model evaluations on model grid cells that experience similar environmental and biological conditions as the field site location (figure S1). Details on grid cell selection can be found in the supplement.
2.3. Variables
We selected variables from all model simulations that were equivalent to variables measured in the field experiment (table 1). Model output is monthly and the measurement frequency for field data varies from half-hourly (soil temperatures and C fluxes, table 1) to multiple times a week (thaw depth, water table depth, and leaf area index) to once a year (e.g. snow depth, aboveground biomass, and leaf chemistry). For seasonal variation, we averaged monthly values over eight years and for trends over time we averaged values over all months for a given year (soil temperature) or only over the growing season months (water table depth). Cumulative CO2 fluxes were calculated by summing half-hourly data to monthly values to match model output. Field and model GPP, Reco, and NEE were additionally summed to growing season periods. We also estimated an annual cumulative NEE value that accounts for respiration during the non-growing season (October–April, details are provided in the field data section).
Table 1. Environmental variables, carbon dynamics, and plant related variables measured in the field experiment and extracted from model simulations.
| Variablea | CLM variable | Unita | Frequency (field)b | |||
|---|---|---|---|---|---|---|
| Description | Field | Model | ||||
| Environmental | Soil temperature | 10 cm depth | TSOI_10 CM, | °C | K | Half-hourly |
| Thaw depth | Active layer thickness | ALT | cm | m | Multiple times per week during growing season | |
| Water table depth | ZWT_PERCH | cm | m | Multiple times per week during growing season | ||
| Snow depth | Snow height | SNOWDP | m | m | 1x yr−1 (March or April) | |
| Carbon fluxes | GPP | Gross primary productivity | GPP | g CO2-C m−2 half-hour−1 | g CO2-C m-2s−1 | Half-hourly |
| Reco | Ecosystem respiration | ER | g CO2-C m−2 half-hour−1 | g CO2-C m-2 s−1 | Half-hourly | |
| NEE | Net ecosystem exchange | NEE | g CO2-C m−2 half-hour−1 | g CO2-C m−2 s−1 | Half-hourly | |
| Plant related | Biomassc | Aboveground peak biomass | LEAFC | dry g m−2 | g C m−2 | 1x yr−1 (July) |
| Foliar carbon | LEAFC | % | g C m−2 | 1x yr−1 (July) | ||
| Foliar nitrogen | LEAFN | % | g N m−2 | 1x yr−1 (July) | ||
| LAId | Leaf area index | TLAI | Unitless | Unitless | ∼ biweekly during growing season | |
aUnits for field and model data were corrected for analyses to match each other. bIn the field, measurements were taken each year from 2009 to 2016 except for biomass, which was only measured from 2009 to 2013, and LAI, which was measured in 2011 and from 2013 to 2016. Model data are available for each month and year. cAbove ground peak biomass in the model was calculated as leaf C multiplied by 2 assuming plant biomass consists of 50% C. dLAI estimated for field was based on parameters and equations from Street et al (2007). LAI = a*e(b*NDVI); a = 0.0148, b = 6.192, parameters and equation from Street et al (2007), NDVI measured in the field.
3. Results
3.1. Environmental variables
During the experimental period (2009–2016), mean annual soil temperature at 10 cm depth in the field control plots was 0.41 ± 0.24 °C (figure 1(a)). Modeled annual soil temperatures at 10 cm in the control simulations were colder (−3.79 ± 0.19 and −5.29 ± 0.2 in CLM4.5 and CLM5.0 respectively), which was to be expected given that the selected grid cells were further north than the field site location (figure S1). The warming treatment increased soil temperature by 0.83 ± 0.13 °C in the field and 1.32 ± 0.07 in CLM4.5 and 1.40 ± 0.08 °C in CLM5.0 (figure 1(b), table S1). Soil warming occurred during winter months in both the field and models and was strongest in March (figures 1(c) and (d), table S2).
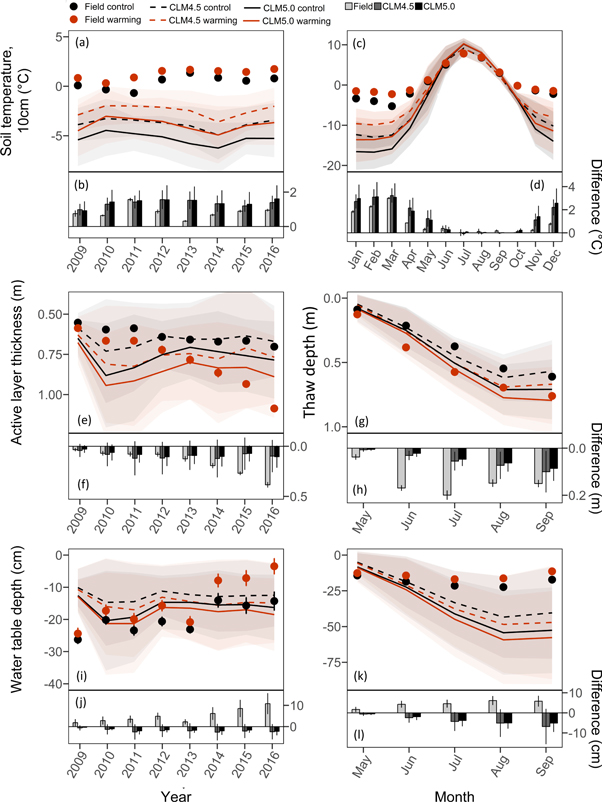
Figure 1. Environmental variables for eight years of warming for field and model data. Mean annual values for soil temperature at 10 cm depth are shown in (a), active layer thickness in (e), growing season water table depth in (i). Mean monthly values averaged over eight years are shown in panels (c), (g), and (k). Note that (e) and (f) show active layer thickness and (g) and (h) thaw depth. Bar graphs show the difference between warming minus control for annual data in (b), maximum in (j), and monthly in (d), (h), and (l). For field and modeled data, black dots and lines represent control and red represents warming. Values are means of six field replicates (snow fences), 75 grid cells in CLM4.5, and 42 grid cells in CLM5.0. Error bars are standard errors in the field and standard deviation in the modeled data. Shaded areas show standard deviated for modeled data (light grey for control and light red for the warming treatment). Note different axis scaling between annual and seasonal panels.
Download figure:
Standard image High-resolution imageAt the beginning of the field experiment, ALT in control plots was 0.55 ± 0.01 (figure 1(e), table S1) and similar in the models as defined by the geographical masking criteria. With each year of warming, ALT increased linearly but to a lesser extent in the models than in the field (figure 1(f)). Over the course of the growing season, field and model thaw depth showed similar trends (figure 1(g), table S2) although the difference in thaw depth between warming and control was greater in the field (figure 1(h)).
Averaged over eight years, mean growing season water table depth in the field was closer to the surface in the warmed plots (−14.6 ± 2.7 cm) than in the control plots (−19.7 ± 1.6 cm), and the warmed plots became wetter each year (figure 1(i)). In the models, control water table depth varied little over the eight years and was similar in magnitude to the field (−12.6 ± 0.5 cm in CLM4.5, and −16.1 ± 0.9 in CLM5.0; figure 1(i), error represents variation across years) but unlike in the field, the warming treatment dried the soils out. After snow melt in May, modeled water table depth was similar to the field and then dropped each month until September with warmed soils in the models drying out more than the modeled control (figures 1(k) and (l), table S2).
3.2. Carbon fluxes
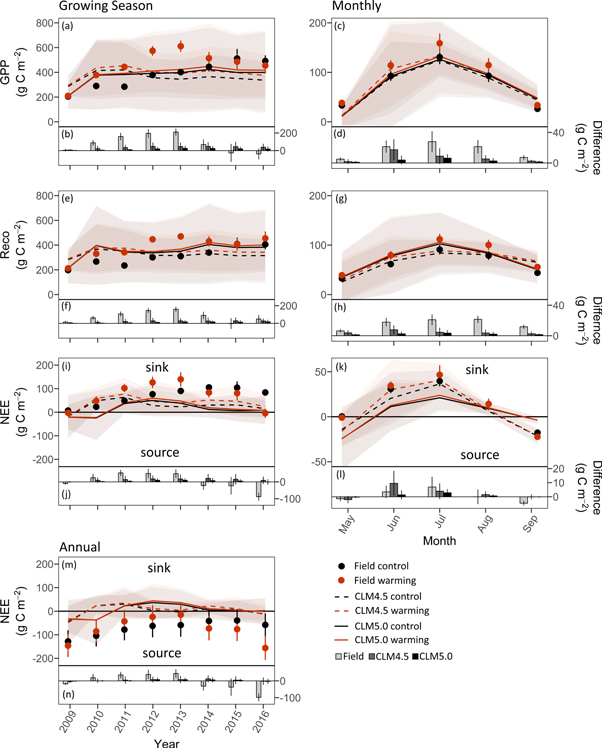
Cumulative growing season (May–September) GPP increased in control plots over the experimental period in the field (204–492 g C m−2 yr−1, figure 2(a), table S1). Warmed plots showed stronger increases in GPP in the first four years of warming (2009–2013) compared to control plots and then declined in the second half of the experimental period. The largest relative difference between warming and control in the field was in 2011 with 57% higher GPP values in the warming treatment whereas after eight years GPP was 8% lower in warmed plot compared to control (figure 2(b), table S1). In the first year of simulations, modeled GPP was similar to field measurements as defined by the selection of grid cells. Warming had a gradual but smaller effect on GPP in both models than in the field. After three years of warming (2011), when the highest difference was found in GPP in the field, CLM4.5 showed an increase in GPP of 8% with warming and CLM5.0 an increase of 2%. Interannual patterns of growing season Reco in the field and models were comparable to GPP (figure 2(e) and (f), table S1). Seasonal GPP and Reco showed similar fluctuations in field and modeled data with peak fluxes occurring in July (figure 2(c) and (g), table S2).
Figure 2. Growing season cumulative GPP (a), Reco (e), NEE (i), and cumulative annual NEE (m) for eight years of warming for field and modeled data. Growing season ranges from May through September. Panels (c), (g), and (k) show cumulative monthly fluxes averaged over eight years. Bar graphs show the difference between warming minus control for growing season fluxes in (b), (f), and (j), for monthly fluxes in (d), (h), and (l), and for annual NEE in (n). Positive numbers in the upper panels show a C sink and negative numbers show a C source. For field and modeled data, black dots and lines represent control and red represents warming. Values are means of six field replicates (snow fences), 75 grid cells in CLM4.5, and 42 grid cells in CLM5.0. Error bars are standard errors in the field and shaded areas show standard deviation for modeled data (in both models light grey is control and light red is the warming treatment). Note different axis scaling between annual and seasonal panels.
Download figure:
Standard image High-resolution image
Cumulative growing season NEE in field controls showed C uptake (7–84 g C m−2 yr−1) during the eight years of the experiment. Modeled controls started as small growing season C sources (CLM4.5–18 g C m−2 yr−1; CLM5.0–21 g C m−2 yr−1) and then became C sinks in the second year. In the field, the difference in growing season NEE between warmed and control plots increased until year five (2013: relative increase of +55%) whereas in year eight, NEE in warmed plots had declined to −105% of NEE in control plots (figure 2(i) and (j)). In contrast, the models exhibited a gradual increase and linear NEE response to warming.
When accounting for non-growing season CO2 dynamics, the field site was a net C source each year in both control and warmed plots (negative NEE, figure 2(m), table S1). Warmed plots were a smaller CO2 source in years two to five in the field experiment, and in year six (2014) and onward, the warmed plots became a larger CO2 source than the control plots (2016, control: −58 and warming: −156 g C m−2 yr−1). Generally, modeled cumulative NEE for control and warming fluctuated around zero with a minimal difference between control and warming indicating that the ecosystem may be C neutral over the years (figure 2(m)).
3.3. Biomass and plant tissue responses
In the control plots, peak biomass in July ranged from 420 g dry weight m−2 in the first year to 582 g dry weight m−2 in year five of the experiment (2013). Though aboveground biomass increased in all plots during the first five years of the experiment, increases in the warmed plots were greater and by year five, warmed plots had 25% more aboveground biomass than controls (table S1). Aboveground peak biomass in the model is leaf C multiplied by two, assuming plant biomass consists of 50% C. In both models, peak biomass was less than half of what was estimated in the field (CLM4.5: 199 g dry weight m−2 in the first year, CLM5.0: 113 g dry weight m−2) and CLM5.0 showed consistently lower values than CLM4.5 (table S1).
4. Discussion
Experimental warming increased soil temperature and ALT in both the field and models but this caused saturated soils in the field and drier soils in the models. These different responses in environmental variables to soil warming led to higher increases in GPP, Reco, and NEE in the field in the first five years of warming and a decline in all CO2 flux components after five years. In both models, warming caused a gradual but weaker increase in GPP, Reco, and NEE that continued throughout the experimental period. These nonlinear patterns in CO2 fluxes in the field experiment indicated that soil warming and permafrost thaw created water dependent dynamics that may increase the C source strength of the ecosystem, a trend that was not captured by either of the models.
4.1. Observed and modeled biogeophysical variables
Arctic landscapes are very heterogeneous and soil warming can lead to warmer and wetter soils but also to warmer and drier soils as water table depth responses can be patchy. Throughout the field experimental period, we observed increases in annual soil temperatures and ALT in the control plots, which presumably is in response to the ongoing climate change that is already occurring (Richter-Menge et al 2017). Modeled soil temperature at 10 cm was much colder during winter months than in the field, which led to colder annual temperatures in the models. The selection of grid cells was limited to those that had similar ALT and GPP values as in the field in year one and did not account for accurate initial soil temperatures. This approach ensured that the volume of available soil C matched field conditions and matching GPP ensured comparable vegetation dynamics. Adding soil temperature to the mask for grid cell selection resulted in only a few grid cells in CLM4.5 and none in CLM5.0. It is unclear whether the mismatch between model mean soil temperatures and active layer predictions is due to model physics or whether the site-level environmental meteorological conditions are not representative of the regional-scale atmospheric dynamics used to drive the model.
Over the course of the eight years of experimental warming, permafrost on the plot scale has resulted in wetting and drying as expected with widespread thaw at the landscape level (Osterkamp et al 2009). Ground ice content in the field accounts for 54% (±6%) up to a depth of 1 m at the beginning of the experiment (in 2009) and cryogenic structures are porous ice closer to the surface and ice lenses occurring further down the profile. Total ice content may still be underestimated as sampling of soil cores excludes massive ice wedges. Not only did the model predict drier surface soils with warming as opposed to the field, it also predicted the water table depth to move further away from the surface during the growing season and at a higher rate in the warming treatment. The divergence in the models from the field is most likely due to the loss of ground ice in the field causing the ground to subside and the surface getting closer to the water table, a feature that is not represented in the model versions included in our analysis. Lee et al (2014) incorporated excess ice into soil layers of CLM4.5 and then projected the amount of surface subsidence that could occur. However, the subsidence that was calculated was only characteristic and the model hydrologic state was not strongly affected by the inclusion of excess ice. Thaw-induced soil drying as a result of increased drainage was also observed in previous modeling efforts (Lawrence et al 2015, Chadburn et al 2017). Ground surface subsidence generally exhibits a heterogeneous pattern depending on the amount of ground ice and high precipitation can enhance subsidence and move the water table closer to the surface (Mauritz et al 2017). The effects of subsidence have thus far not been considered in models meaning that we likely are missing an important dynamic in permafrost transitions.
An additional factor that could potentially contribute to the divergence in water table dynamics between field observations and model simulations could be discrepancies in soil hydraulic properties between field and model. The soil properties at the site are described as Aeolian silt but detailed soil characterizations are not available. In CLM, soil properties are specified in each grid cell based on the Harmonized World Soil Database. If the specified deep soil properties in the selected CLM grid cells do not reflect those at the site, the runoff and soil drying response to warming could differ. Without more detailed characterization of deep soil properties at the site, it is difficult to probe this question in detail, though we should note that we are effectively sampling CLM for several different soil types through our grid cell filtering method. The differences in water table depth between observed and modeled data demonstrates that accurate representation and prediction of near-surface hydrology in the Arctic remains a challenge in models complicating comparisons between field manipulation experiments and models.
4.2. Factors contributing to variable CO2 dynamics with warming in the field
For accurate simulation of CO2 dynamics to soil warming, we need to consider which environmental and biological factors are linked to the increase in growing season CO2 flux components in the first five years of the experiment followed by a decrease. Growing season fluxes provide the best resolution of field CO2 fluxes as non-growing season CO2 dynamics rely on models and gap-filling and our understanding of non-growing season fluxes remains limited. In contrast, growing season GPP is directly linked to photosynthesis and can be easily compared between field and models.
The GPP response as observed in the field could be driven by two primary factors: active layer deepening and subsequent increase in N availability. Deepening of the active layer with soil warming expands the rooting zone and increases the space for vertical root distribution where plants access nutrients and water (Iversen et al 2014). Thaw of deep permafrost soil not only increases the potential rooting zone for tundra plants but also releases biologically available N that is accessible to support further plant growth (Keuper et al 2012, Salmon et al 2016, Keuper et al 2017, Wild et al 2018). Plant growth in moist acidic tundra is often N-limited (Shaver et al 1992, Chapin et al 1995, Mack et al 2004, Sistla et al 2012) and at the field experiment higher aboveground plant biomass during the initial thaw stages has been linked to increasing N availability (Salmon et al 2016). In addition, thaw and changing N availability may promote changes in species composition, and field manipulations suggest there will be a shift to greater shrub dominance with warming over longer time scales (e.g. Chapin et al 1995, Sistla et al 2013, DeMarco et al 2014). At the field site however, the observed increase in GPP during the first five years of warming induced by thaw was driven by productivity of the already dominant sedge, E. vaginatum (Salmon et al 2016), which is consistent with the transient response observed in Sweden by Johansson et al (2013).
The decline in GPP, Reco, and NEE in the field after five years of warming demonstrates that a deepening of the ALT and increasing N availability cannot drive unlimited GPP increases. Initial thaw might allow a rapid response of existing dominant species but over longer timeframes different drivers may dominate. The loss of ground ice resulting in soil subsidence and a water table position closer to the surface may favor plant species capable of dealing with more water-logged conditions. Unpublished data from the latest field season (year nine of the field experiment, Taylor et al 2017) show that E. vaginatum declines in wet areas possibly explaining the decline in GPP which turns the ecosystem into an annual C source with continued warming.
4.3. Model divergence from field observations
Increases in GPP in response to warming are strongly attenuated in both models compared to the field experiment. Both ALT and N limitation can be identified as main causes for the weaker increase in GPP with warming in the models. ALT increased less than 15% in both models in year eight of soil warming compared to a 55% increase in the field which added more depth for root growth, water uptake and nutrient acquisition in the field. Smaller increases in ALT with warming in the model are the result of colder winter temperatures in the model compared to the field site. Further, N limitation of Arctic plant productivity may not be well represented in either of the models. This is indicated in CLM4.5 by a lack of change in the fraction of potential GPP (FPG) with warming over time as well as a very weak response in net N mineralization with warming (table S3). In CLM5.0, nutrient limitation shows almost no change with warming and increases in net N mineralization with warming were less than 10% over the years (table S3). Additional N availability with depth was shown to have a small effect on plant productivity in CLM4.5 (Koven et al 2015a), which further emphasizes insufficient representation of N limitation in CLM4.5. Nutrient cycling along with aboveground and belowground coupling and microbial dynamics were also identified as inadequately represented processes for high latitude ecosystems in CLM4.5 (Bouskill et al 2014). Modifications to the plant N cycle in CLM5.0 aimed to improve the realisms of vegetation N cycling (Shi et al 2015, Ali et al 2016, Ghimire et al 2016); (http://www.cesm.ucar.edu/models/cesm2/land/). While aspects of the terrestrial N cycle are improved with these developments, results here show a surprising low level of N limitation in arctic ecosystems simulated by both versions of CLM (table S3). Thus, although warming stimulates modest changes in N mineralization rates, given low plant nutrient limitation, this elicits negligible changes in plant productivity. This suggests that aspects of the soil biogeochemical code and considerations of plant—microbial competition for N deserve further revisions in the CLM. Improving nutrient limitation to better capture future changes in the C balance has also been identified for other models (Chadburn et al 2017) and provides a key process that can improve model performance.
5. Conclusion
Models are an important tool to project future C dynamics in the Arctic, as well as globally. To obtain meaningful projections for the global C cycle, we need to ensure that the relevant processes in models are represented and validated against field observations. In this study, the models are able to capture some but not all aspects of an experimental warming. Both versions of CLM predict that the response to warming is gradual and increases in GPP, Reco, and NEE are small with warming, and that short-term ecosystem C gains give way to medium-term C neutrality. This is in contrast to the field observations, which showed that initial increases in C uptake subsequently reverse to C losses, such that ecosystem C losses exceeded C gains after eight years of experimental warming. Short-term responses as observed in the first five years of the field experiment are not indicative of longer-term responses requiring manipulative experiments to continue beyond a decade.
This field and model comparison provides insights into the underlying causes for model divergence of ecosystem responses to soil warming on a decade-long timescale. The divergences between field and model responses to warming demonstrate the importance of thaw-induced changes in surface hydrology and N limitation on C dynamics and that it will be critical to accurately represent these processes in future model projections.
In this data-model comparison, we have identified important steps for model improvement and as a next step it will be crucial to expand site level comparisons between observational and model data to global simulations. The complexity of interacting processes in models will need to be carefully evaluated and accounting for the spatial heterogeneity in tundra landscapes and the proportion of wet and dry surface soils on the circumpolar scale will be challenging but important elements to consider.
Acknowledgments
Supporting funding to CS and EAGS was provided by the National Science Foundation Study of Environmental Arctic Change (SEARCH) Grant #1331 083. Part of this work was based on support provided by the following programs: US Department of Energy, Office of Biological and Environmental Research, Terrestrial Ecosystem Science (TES) Program, Award #DE-SC0006982 and updated with DE-SC0014085 (2015–2018); National Science Foundation CAREER program, Award #0747 195; National Parks Inventory and Monitoring Program; National Science Foundation Bonanza Creek LTER program, Award #1026 415; National Science Foundation Office of Polar Programs, Award #1203 777.
DML and CDK are supported by Reducing Uncertainties in Biogeochemical Interactions through Synthesis and Computation Scientific Focus Area (RUBISCO SFA), which is sponsored by the Regional and Global Climate Modeling (RGCM) Program in the Climate and Environmental Sciences Division (CESD) of the Office of Biological and Environmental Research (BER) in the US. Department of Energy Office of Science. DML is supported by NSF Grant PLR-1304220.