


Abstract
Arctic tundra is a globally important store for carbon (C). However, there is a lack of reference sites characterising C exchange dynamics across annual cycles. Based on the Greenland Ecosystem Monitoring (GEM) programme, here we present 9–11 years of flux and ecosystem data across the period 2008–2018 from two wetland sites in Greenland: Zackenberg (74°N) and Kobbefjord (64°N). The Zackenberg fen was a strong C sink despite its higher latitude and shorter growing seasons compared to the Kobbefjord fen. On average the ecosystem in Zackenberg took up ∼−50 g C m−2 yr−1 (range of +21 to −90 g C m−2 yr−1), more than twice that of Kobbefjord (mean ∼−18 g C m−2 yr−1, and range of +41 to − 41 g C m−2 yr−1). The larger net carbon sequestration in Zackenberg fen was associated with higher leaf nitrogen (71%), leaf area index (140%), and plant quality (i.e. C:N ratio; 36%). Additional evidence from in-situ measurements includes 3 times higher levels of dissolved organic carbon in soils and 5 times more available plant nutrients, including dissolved organic nitrogen (N) and nitrates, in Zackenberg. Simulations using the soil-plant-atmosphere ecosystem model showed that Zackenberg's stronger CO2 sink could be related to measured differences in plant nutrients, and their effects on photosynthesis and respiration. The model explained 69% of the variability of net ecosystem exchange of CO2, 80% for photosynthesis and 71% for respiration over 11 years at Zackenberg, similar to previous results at Kobbefjord (73%, 73%, and 50%, respectively, over 8 years). We conclude that growing season limitations of plant phenology on net C uptake have been more than counterbalanced by the increased leaf nutrient content at the Zackenberg site.
Export citation and abstract BibTeX RIS

Original content from this work may be used under the terms of the Creative Commons Attribution 4.0 license. Any further distribution of this work must maintain attribution to the author(s) and the title of the work, journal citation and DOI.
1. Introduction
The Arctic is rapidly changing; ongoing global climate change has already started to redesign high latitude ecosystems and challenge the functioning and resilience of arctic tundra (Box et al 2019). These high latitude ecosystems contribute to <8% of the global land area yet they play a key role in the global C cycle (McGuire et al 2012). Additionally, tundra regions show a marked sensitivity to climatic and environmental changes (ACIA 2005). Shortening of the spring snow cover duration and increase of vegetation greenness (Myers-Smith et al 2020) and enhanced permafrost warming (Romanovsky et al 2017) have serious consequences for ecosystem-atmosphere interactions, and these may result in feedback loops intensifying climate warming further. Thus the response of the terrestrial Arctic C cycle to changes in climate is a major issue of global concern (McGuire et al 2012). The consequences are, however, broadly uncertain because of past difficulties in conducting research in the Arctic (Metcalfe et al 2018, Virkkala et al 2019) and its complexity. Despite such challenges there is an urgent need to understand the C cycle sensitivity in high latitudes, reducing model uncertainties (López-Blanco et al 2019) and identifying the global effects to be able to estimate solid prognostic numbers.
The likely rise in temperature (IPCC 2013) and precipitation (Bintanja et al 2020) may have multiple effects on CO2 exchange, and in turn may initiate a series of critical alterations in ecosystems. Firstly, an increment of photosynthetic C uptake can be driven by lengthening growing seasons, CO2 fertilisation (Sitch et al 2008), shrub expansion (Myers-Smith et al 2011) and vegetation greening (Myneni et al 1997). Secondly, these increases of C uptake may be counterbalanced by enhanced microbial turnover (Commane et al 2017), heterotrophic respiration (Webb et al 2016), methane emissions (Mastepanov et al 2008, Schuur et al 2015), grazing and trampling exclusion from large herbivore (Falk et al 2015), episodic biological events (Lund et al 2017), and fires (Rocha and Shaver 2011). Biologically available nutrients in soils, the net result of interacting processes such as precipitation, plant and microbial uptake, and mineralization of organic matter (Rustad et al 2001), can modify plant growth and turnover rates in arctic tundra nutrient limited ecosystems (Shaver and Chapin III 1980). Minimal variations in relation to these interrelated processes may lead to changes in ecosystem C sink-source functioning (Williams et al 2000) and so the full implications of these changes in terrestrial C dynamics remain uncertain (López-Blanco et al 2019).
The net ecosystem exchange (NEE) of CO2 is the balance between its two major modulating components: gross primary production (GPP; CO2 uptake) and ecosystem respiration (Reco; CO2 release). The exchange of CO2 between terrestrial ecosystems and the atmosphere is a key descriptor of ecosystem functioning. Eddy covariance (EC) measurements of NEE are a powerful technique for C flux measurements at landscape scale (Baldocchi et al 2001). Moreover, EC ensures high temporal resolution and minimal disturbance to the surrounding surface and vegetation. However, this method is difficult to implement in northern latitudes due to remoteness and harsh conditions (Lafleur et al 2012). Factors such as the lack of direct line power and remote connectivity, unavoidable instrument failures, extreme conditions especially in wintertime or the disturbance linked to wildlife, challenge the creation of continuous and robust datasets. Further EC data only measured net fluxes, and so are insufficient to provide a comprehensive and mechanistic picture of the underlying processes driving NEE. Conveniently, process-oriented ecosystem models can represent complex ecosystem processes shaping the NEE of CO2 (Williams et al 2000), dynamics of C stocks, and their feedbacks with important arctic related actors such as permafrost (Koven et al 2015), snow dynamics (Essery 2015) and vegetation shifts (van der Kolk et al 2016).
In this study we present a decade of EC data at two contrasting sites, each recorded over consecutive years during 2008–2018 by the Greenland Ecosystem Monitoring programme (GEM; g-e-m.dk) (Christensen et al 2017). GEM is a state-of-the-art cross-disciplinary research infrastructure leading Greenlandic ecosystem monitoring. We aim in this study to evaluate the drivers of temporal variability and quantify and explain the differences in CO2 exchange between the northernmost (Zackenberg) and southernmost (Kobbefjord) ecosystem stations. We ask the ecological questions: 'How different is high arctic NEE compared to low arctic NEE in Greenland?' and 'What are the key driving factors contributing to any identified differences?'. We hypothesize that site-specific differences such as climate, growing season length, and nutrient availability will control the variability of net C uptake between Zackenberg and Kobbefjord. EC measurements of NEE at high temporal resolution are combined with an extensive set of meteorological-, plant phenology- and soil-related observations and process-based modelling to diagnose the key differences of terrestrial net C sink strength in relation with plant phenology timing, leaf nitrogen (N) traits, and organic C and N from soil water. This paper makes use of a rich dataset to establish a robust baseline framework for model calibration and validation and to attribute observed flux differences to key processes.
2. Materials and methods
2.1. Site description
Terrestrial CO2 exchange measurements have been conducted in Zackenberg fen (Northeast Greenland, 74°N; figure 1(a)) and in Kobbefjord fen (Southwest Greenland, 64°N; figure 1(b)) since 2008 under the auspices of the cross-disciplinary GEM programme. These locations characterize high and low arctic sites (Christensen et al 2017) and are both surrounded by >1000 m.a.s.l mountains and a fjord. Annual mean temperature and precipitation are −8.6 °C and 253 mm in Zackenberg and 0.3 °C and 1081 mm in Kobbefjord during the 2008–2018 period. According to the Circumpolar Arctic Vegetation Map (Walker et al 2005) Zackenberg belongs to the subzone C bioclimate zonation with an average temperature in July of 7 °C–9 °C, while Kobbefjord fits the subzone E with an average July temperature of 11 °C–13 °C. Both fen sites have water saturated organic soils with an abundant snowmelt water supply. The precipitation falls largely as snow during the shoulder seasons and on average Zackenberg accumulates a slighter thicker (maximum) snowpack compared to Kobbefjord (1 and 0.9 m, respectively). The Zackenberg area has continuous permafrost, with maximum thaw depth variability of 0.5–1 m (Lund et al 2014), whereas no permafrost has been found in Kobbefjord (López-Blanco et al 2017). The two sites are sedge dominated fens commonly populated with Eriophorum scheuchzeri and Dupontia psilosantha (Zackenberg) and Eriophorum angustifolium and Scirpus caespitosus (Kobbefjord) (Bay 1998, Bay et al 2008) and an abundant moss layer characterized by the presence of Sanionia uncinata and Sphagnum lindbergii at each site, respectively (Hassel et al 2012). The sunlight hours from May to September differ substantially between the two sites, ranging from 14 to 21 h in Kobbefjord and from 17 to 24 h in Zackenberg.
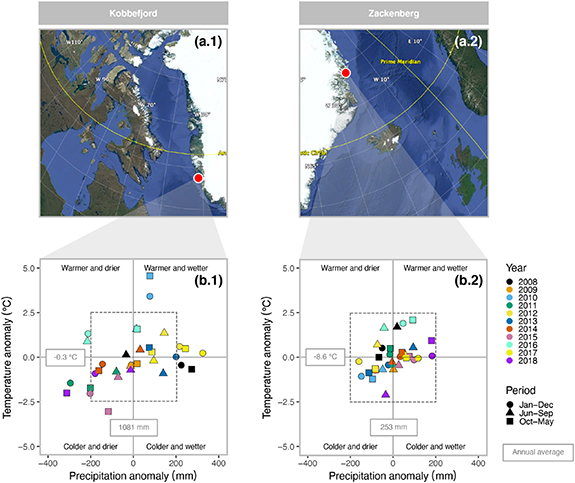
Figure 1. (a.1) and (a.2) Location of the Nuuk-Kobbefjord and Zackenberg sites, respectively (source: Google Earth Pro). (b.1) and (b.2) Annual temperature and precipitation anomalies within the analysed years (2008–2018) including annual (January to December), warm season (July to September) and cold season (October to May) averages.
Download figure:
Standard image High-resolution image2.2. Flux measurements
The EC flux data consist of high-temporal-resolution measurements for the 2008–2018 period. In Zackenberg the systems consisted of a closed-path infrared gas analyser LI-6262 (LI-COR Inc, USA) and 3-D sonic anemometer Gill R2 (Gill Instruments Ltd, UK) until August 2012, when it was upgraded to an enclosed-path LI-7200 (LI-COR Inc, USA) and Gill HS (Gill Instruments Ltd, UK). In Kobbefjord, the systems have been equipped with a closed-path infrared gas analyser LI-7000 (LI-COR Inc, USA) and a 3-D sonic anemometer Gill R3-50 (Gill Instruments Ltd, UK) until August 2018, when it was upgraded to an enclosed-path LI-7200 (LI-COR Inc, USA). The sonic anemometer in Zackenberg was installed at a height of 3 m (and the air intake was attached at the same level) while in Kobbefjord it was at 2.2 m (air intake at 2 m). In both stations we processed the high-frequency CO2 concentration and wind components data according to standard flux community techniques (i.e. FLUXNET and ICOS), including de-spiking (Højstrup 1993), 2D coordinate rotation, time lag removal by covariance optimization, block averaging, frequency response correction (Moore 1986) and Webb-Pearman-Leuning correction (Webb et al 1980). More information on the EC system setup, flux computation, and quality checks in Lund et al (2010). We post-processed the quality-checked NEE data using gap-filling and partitioning approaches. On one hand, data-gaps have been filled with a marginal distribution sampling technique (Moffat et al 2007). On the other hand, the separation of NEE into its two modulating fluxes, GPP and Reco, was achieved via traditional separation algorithms utilized in the FLUXNET community (Reichstein et al 2005, 2016). More information on flux gap-filling using marginal distribution sampling and flux partitioning using ReddyProc (Reichstein et al 2016) in López-Blanco et al (2017). Due to the absence of true night-time during the growing season in Zackenberg, the data have been processed using the daytime method (Lasslop et al 2010). The reporting of fluxes in this paper follows the standard micrometeorological sign of convection, i.e. the uptake of carbon (sink) is a negative flux while the release of carbon (source) is a positive flux. Moreover, this study defines the beginning of the growing season as three-consecutives days with negative fluxes (i.e. net C uptake) after the winter period, while the end of the growing season is characterized as three-consecutive days with positive fluxes (i.e. net C release).
2.3. Ancillary measurements
For each site a comprehensive suite of meteorological measurements, phenology related observations, biomass and soil core samples, physical soil parameters, and soil water chemistry have been collected, processed and quality-checked from the GeoBasis and ClimateBasis subprogrammes, all freely accessible from the GEM database (data.g-e-m.dk). The meteorological datasets from nearby climate stations (<2km distance) includes data on air temperature (°C), total precipitation (mm), relative humidity (%), shortwave radiation (W m−2), photosynthetic active radiation (W m−2), and snow depth (m). The phenology related variables integrate leaf area index (m2 m−2) at the peak of the growing season and end of the snowmelt period (Day of Year, DOY). Direct harvest measures of leaf area index (LAI) has been calculated using Image J (Schneider et al 2012) for July 2015 data in Kobbefjord (López-Blanco et al 2018) and July 2019 data in Zackenberg. The snowmelt period was classified at a pixel level (<20% snow cover) from a time-lapse camera (HP e427) following the procedures described by Westergaard-Nielsen et al (2017). C and N stocks (leaf, litter, stems, roots, mosses, and soil organic matter; g C m−2 and g N m−2) were collected from 5 plots of 100 cm2 area at each fen site following the procedure described in López-Blanco et al (2018). The physical soil parameters integrated in this study contains soil temperature (°C) at different soil depths and snow coverage (%) derived from the time-lapse camera. Soil water chemistry observations include dissolved organic carbon (DOC; ppm), dissolved organic nitrogen (DON; ppm), ammonium (NH4+; ppm), nitrate (NO3-; ppm) and specific conductivity (EC; μS cm−1). Further details on ancillary measurements from Zackenberg and Kobbefjord can be found in Lund et al (2012) and López-Blanco et al (2017).
2.4. Ecosystem modelling focused on arctic processes
We run the soil-plant-atmosphere (SPA) model (Williams et al 1996, 2000) with 11 years (2008–2018) of meteorological forcing from Zackenberg, to support previous simulations at Kobbefjord (López-Blanco et al 2018). SPA is a mechanistic point model that simulates C, water and energy cycles through eco-physiological principles in a vertically resolved canopy and soil profile. SPA models (1) a radiative transfer scheme differentiating between sunlit and shaded leaf area, (2) photosynthesis based on the classic representation of carboxylation from Farquhar and von Caemmerer (1982) model plus a stomatal conductance model that balances vapour phase losses with hydraulic supply to maximise C uptake, (3) surface energy balance and evaporation based on the Penman-Monteith method, and 4) detailed distribution of water and heat transfer through the soil profile. Furthermore, the model version used here has been refined, calibrated and validated with observational data from Kobbefjord (López-Blanco et al 2018), including implementation of important arctic related processes. In this version we (1) independently calculated maintenance respiration losses considering nitrogen (N) interactions based on formulations described by Reich et al (2008) and not as a fixed ratio, and (2) improved net C uptake timing at the beginning of the growing season by restarting growing degree day summation right after the snowmelt period, using data derived from the in-situ cameras (Westergaard-Nielsen et al 2017). In López-Blanco et al (2018) we found that the model's most sensitive parameters to NEE, GPP and Reco were those related to leaf N traits and initial C stocks. Here we followed the approach applied to Kobbefjord data with separate calibration and validation years. Therefore, we manually calibrated the first 5 years of the time series (2008–2012) using the timing of specific snowmelt in Zackenberg to define the start of plant flush, average leaf nitrogen, leaf mass per area (LMA), the maximum foliar C stock (at the peak of the growing season), and the C and N stocks (litter, stem and roots). Finally, the Q10 of foliar and root respiration rates has been increased from 2 to 3 at Zackenberg to account for plant thermal acclimation to colder temperatures (Tjoelker et al 2001, Atkin and Tjoelker 2003). The rest of parameters have been kept the same as at Kobbefjord to facilitate a model performance comparison only impacted by the environmental forcing. For validation we calculated linear goodness-of-fit (R2 and RMSE) of the last 6 years (2013–2018) to evaluate the level of statistical agreement between C flux data (NEE, GPP and Reco) and model simulations.
3. Results
3.1. Interannual variability of meteorological forcing and phenology related variables
Overall, Zackenberg was colder (a difference of −8.9 °C) and drier (a difference of 828 mm in precipitation) compared to Kobbefjord. Zackenberg fen, located 10° north of Kobbefjord fen, had lower interannual and interseasonal temperature and precipitation variability between 2008 and 2018 (figure 1). During this period, annual mean temperatures and total precipitation ranged from −2.4 °C to 3.1 °C and from 559 mm to 1179 mm in Kobbefjord, but only between −9.7 °C and −6.7 °C and 93 mm and 436 mm in Zackenberg. Kobbefjord featured stronger interannual oscillations (greater than the −0.3 ± 2.5 °C and 1081 ± 200 mm anomalies delimited by the dotted box in figure 1(b.1) between specific series of years such as 2010 (warmer and wetter), 2011 (colder and drier) and 2012 (warmer and wetter); and 2016 (warmer and drier), 2017 (warmer and wetter) and 2018 (colder and drier). Zackenberg had smaller temperature and precipitation anomalies (not exceeding ±2.5 °C and ±200 mm figure 1(b.2).
These climatic conditions shaped both the snow regimes and the seasonality of the growing season. First, Zackenberg had 10% greater maximum snow depths in the cold season (October to May) and 23 days delay to the end-of-snowmelt periods than Kobbefjord (table 1). Second, Zackenberg fen switched from being a source to a sink of CO2 on July 9th (17 days later than Kobbefjord) and continued with net uptake until August 23rd (5 days before Kobbefjord). Zackenberg fen had an average growing season length of 46 days compared to 66 days in Kobbefjord (table 1).
Table 1. Summary of phenology-related variables in Kobbefjord and Zackenberg for the 2008–2018 period. Grey boxes in the background represents years where full set of variables are complete.
| Site | Variable (unit) | 2008 | 2009 | 2010 | 2011 | 2012 | 2013 | 2014 | 2015 | 2016 | 2017 | 2018 | Average |
|---|---|---|---|---|---|---|---|---|---|---|---|---|---|
| Maximum snow depth (m) | 0.6 | 1 | 0.3 | 1.4 | 1 | 0.6 | 1.1 | 1.2 | 0.5 | 1.3 | 1.1 | 0.9 | |
| End of snowmelt period (DOY) | 148 | 159 | 125 | 165 | 152 | 158 | 156 | 176 | 122 | 156 | 170 | 153 | |
| Kobbefjord | Beginning of growing season (DOY) | 167 | 182 | 150 | 209 | 169 | 174 | 169 | 188 | 151 | — | — | 173 |
| End of growing season (DOY) | 230 | 249 | 235 | 256 | 247 | 237 | — | 246 | 221 | — | — | 240 | |
| Length of growing season (DOY) | 63 | 67 | 85 | 47 | 78 | 63 | — | 58 | 70 | — | — | 66 | |
| Maximum snow depth (m) | 1.3 | 0.4 | 0.7 | 0.6 | 1.3 | 0.5 | 0.9 | 1.4 | 1.1 | 0.9 | 1.4 | 1.0 | |
| End of snowmelt period (DOY) | 184 | 156 | 174 | 171 | 183 | 155 | 182 | 184 | 169 | 171 | 202 | 176 | |
| Zackenberg | Beginning of growing season (DOY) | 191 | — | — | 177 | — | 168 | 197 | 198 | 180 | 186 | 219 | 190 |
| End of growing season (DOY) | 236 | 229 | 229 | 228 | — | 222 | 242 | 246 | 234 | 235 | 244 | 235 | |
| Length of growing season (DOY) | 45 | — | — | 51 | — | 54 | 45 | 48 | 54 | 49 | 25 | 46 |
3.2. NEE timeseries and cumulative NEE, GPP and Reco
Zackenberg fen had a higher C sink strength (>170%) compared to Kobbefjord fen (figures 2 and 3) despite its higher latitude and markedly shorter growing season (table 1 and figure 2). Zackenberg fen generally acted as a sink of CO2 over the study period, with an average NEE of −50 g C m−2 yr−1 (range +21 to −90 g C m−2 yr−1), more than twice as strong as Kobbefjord (−18 g C m−2 yr−1 with range of +41 to −41 g C m−2 yr−1)(figure 3). There were two anomalous C source years, with positive NEE; 2018 in Zackenberg and 2011 in Kobbefjord. Zackenberg 2011 has been associated with an extreme melt season (i.e. one month delay compared to the 2008–2017 period) (Christensen et al 2020). Kobbefjord featured exceptionally variable meteorology between 2010 and 2011 (López-Blanco et al 2017) facilitating optimal conditions for a biological outbreak of the noctuid moth Eurois occulta larvae (Lund et al 2017) and minimal for plant growth. The NEE of 2011 and 2018 have been ∼70 and ∼83 g C m−2 yr−1 less productive than the rest of years on average, respectively, and therefore acted as a net source of CO2.
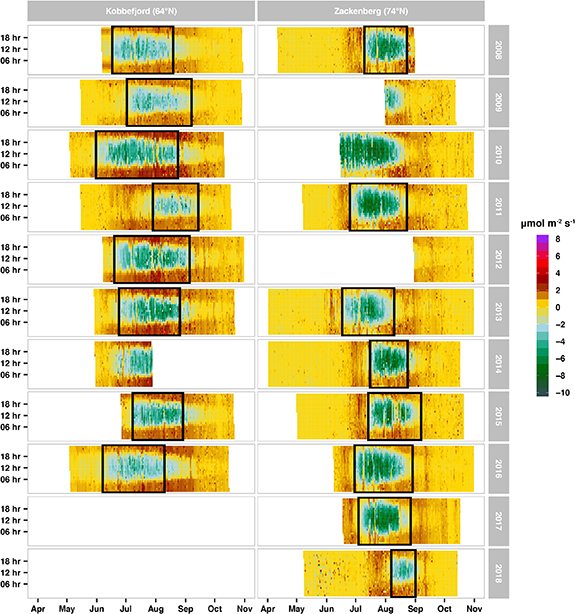
Figure 2. Time series of gap-filled NEE (2008–2018) based on the MDS algorithm from reddyproc. Green represents C uptake while the orange-dark-red denotes C release. The black box delimits the period between the start and the end of the growing season.
Download figure:
Standard image High-resolution image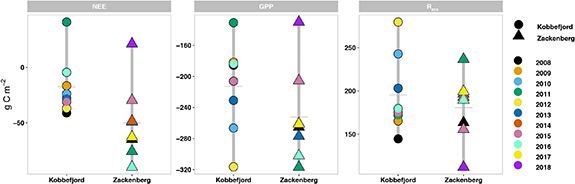
Figure 3. Cumulative ranges (vertical grey bar) and mean (horizontal grey bar) for NEE, GPP and Reco from 2008 through 2018 in Kobbefjord (circles) and Zackenberg (triangles). Years with more than half growing season missing data have been omitted in this calculation.
Download figure:
Standard image High-resolution imageIn general, the higher C sink strength observed in Zackenberg is linked to larger photosynthesis (i.e. more negative GPP) rather than reduced respiratory losses (i.e. more positive Reco) (figure 3). Specifically, Zackenberg GPP was on average −252 g C m−2 yr−1 (range of −130 to −317 g C m−2 yr−1), 18% higher than Kobbefjord GPP (−213 g C m−2 yr−1, ranging from +131 to −316 g C m−2 yr−1). The respiration released from Reco was 7% larger in Kobbefjord (195 g C m−2yr−1, range of 145 to 280 g m−2 yr−1) than in Zackenberg (181 g C m−2 yr−1, range of 112 to 237 g C m−2 yr−1).
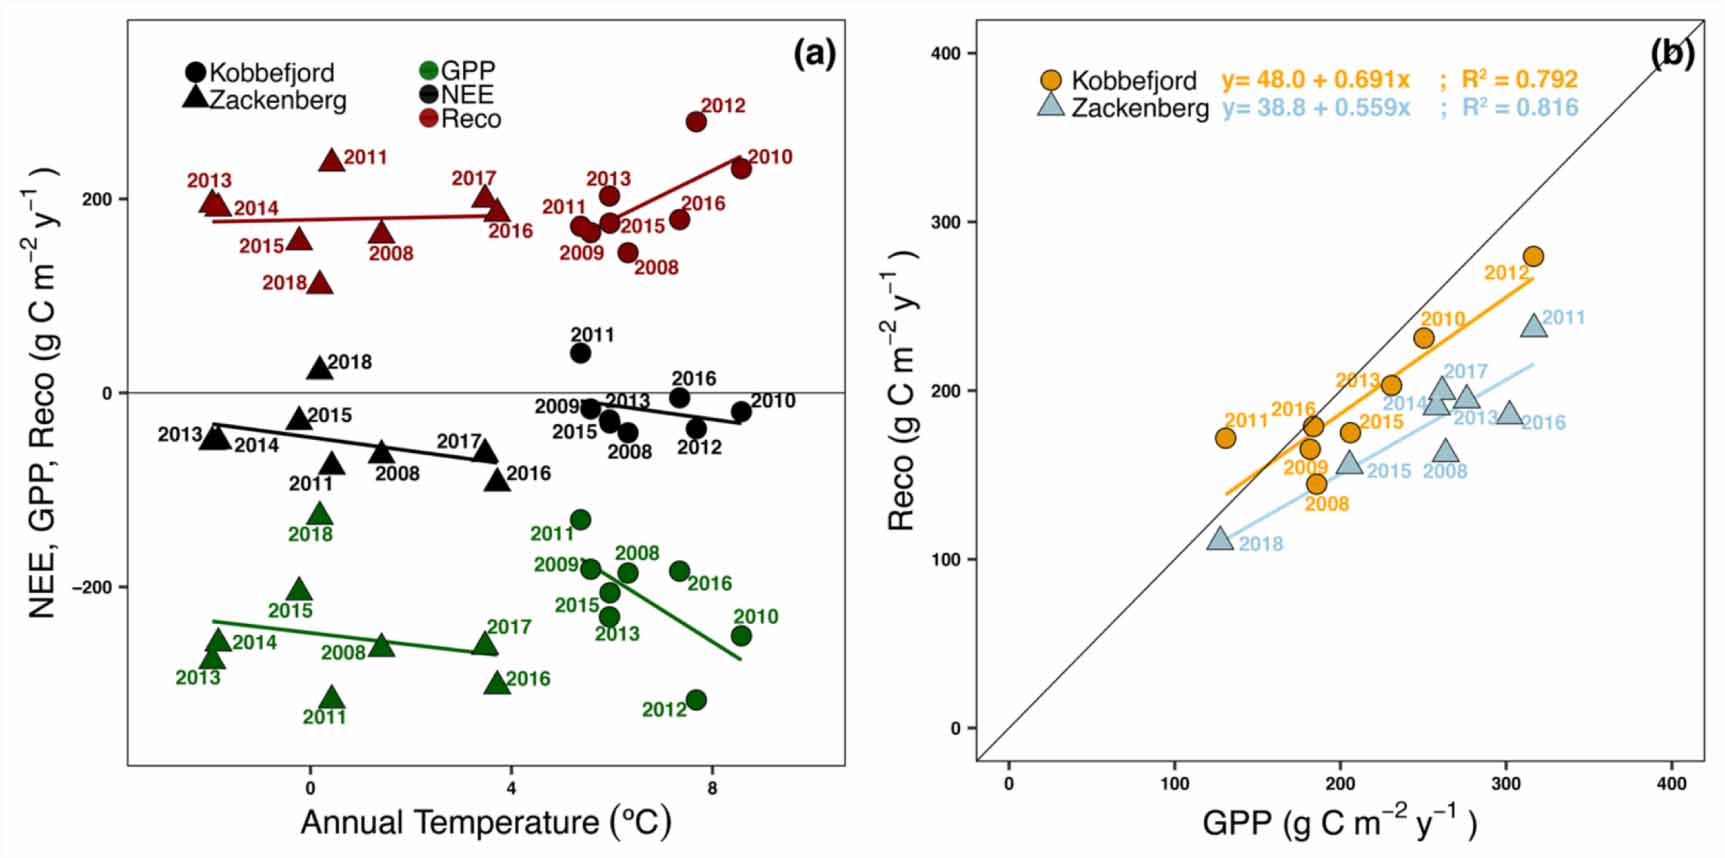
We found a lower sensitivity to annual air temperature from gross fluxes in Zackenberg (GPP slope = 6.1 g C m−2 yr−1 °C and Reco slope = 1.1 g C m−2 yr−1 °C; figure 4(a)) compared to Kobbefjord (slope = 32.7 and 25 g C m−2 yr−1 °C). This finding is consistent with the lower climate interannual variability revealed in figure 1 and the smaller sensitivity in growing season length at Zackenberg (table 1). We found a similar compensatory effect (slope, intercept, R2; figure 4(b)) between photosynthesis and respiration both in Zackenberg and Kobbefjord.

Figure 4. (a) The relationships between observed NEE (black), GPP (dark green), Reco (dark red) (g C m−2 year−1) and mean temperature (º C) between may and october for the years 2008–2018. (b) Interannual variability between GPP and Reco relationships in Zackenberg (light blue) and Kobbefjord (orange). Years with more than half growing season missing data have been omitted in this calculation.
Download figure:
Standard image High-resolution image3.3. Carbon and nutrient content in vegetation and soils
The enhanced photosynthetic activity (figures 3 and 4(b)) has been associated with higher C and N stocks and leaf traits in the aboveground domain and larger concentration levels of nutrients and minerals in soils (figure 5).
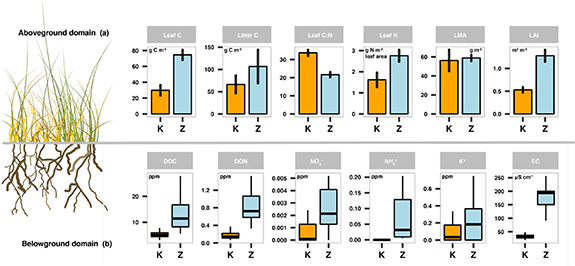
Figure 5. In-situ observations from aboveground biomass (a) and concentration levels of nutrients and minerals in soils (b) from Zackenberg fen (light blue) and Kobbefjord fen (orange). The bar plots characterize leaf and litter C stocks, leaf C:N ratio (i.e. plant quality), leaf N, leaf mass per area (LMA), and leaf area index (LAI) in the aboveground domain. The error bars contain the variability (standard deviation) out of the five fen plots. The box plots characterize soil water chemistry and catchment exports of dissolved organic carbon (DOC), dissolved organic nitrogen (DON), nitrate (NO3−), ammonium (NH4+), potassium (K+), and electroconductivity (EC) between 2015 and 2017 at maximum depth of 50 cm.
Download figure:
Standard image High-resolution imageThe new in-situ information retrieved from the 2019 sampling campaign shows systematic larger C stocks, leaf mass per area (LMA), leaf N, leaf area index (LAI), and plant quality (C:N ratio) in the Zackenberg fen (figure 5(a)). The C stocks averaged at the peak of the growing season 74.6 g C m−2 in leaves, 106.7 g C m−2 in litter, 89.3 g C m−2 in stems, and 405.2 g C m−2 in mosses. This is 44.7, 40.4, 20.1, and 9.1 more g C m−2 in leaves, litter, stems and mosses compared to Kobbefjord C stocks, respectively. Likewise, the leaf trait data pointed to consistently higher leaf N (2.3 vs 1.62 g N m−2 leaf area), LMA (58.83 vs 56.29 g m−2), and LAI (1.28 vs 0.52 m2 m−2) in Zackenberg compared to Kobbefjord (figure 5(a)). Moreover, we found that the plant quality in Zackenberg fen is 36% higher (i.e. lower C:N ratio) than Kobbefjord fen (figure 5(a)).
The water chemistry data from the first 50 cm of Zackenberg fen topsoil show consistent higher levels of Dissolved Organic C (DOC), Dissolved Organic N (DON), nitrates (NO3−), ammonium (NH4+), and electroconductivity (EC) during the 2015–2017 period (figure 5(b)). Overall, the belowground domain had 3 times more DOC (ppm), 5 times more nutrients such as DON (ppm) and NO3- (ppm), 2 times more K+ (ppm), and 5 times higher EC (μS cm−2), and slightly more acidic pH (figure 5(b)) in Zackenberg. Likewise, alkaline cations (Ca2+ and Mg2+) are 13 and 5 times higher while the acidic cations (Mn2+ and Fe2+) are 21 and 7 times higher in Zackenberg fen (figure S1 stacks.iop.org/ERL/15/094007/mmedia).
3.4. Calibration and validation of the process-based model
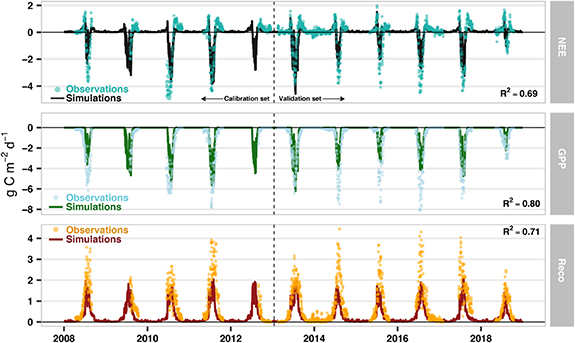
The SPA model can realistically characterise 11 years of data from the Zackenberg fen (figure 6) and 8 years of data from Kobbefjord (see López-Blanco et al (2018)), with model setup varying according to in-situ biomass and tissue N data. At Zackenberg the daily aggregated NEE (R2 = 0.69; RMSE = 0.4 g C m−2d−1), GPP (R2 = 0.80; RMSE = 0.5 g C m−2d−1) and Reco (R2 = 0.71; RMSE = 0.6 g C m−2d−1) matched the independent summertime field observations for the validation period (2013–2018). The snowmelt period information retrieved from the photo monitoring, has been used to restart the growing degree day summation, modelling the NPP allocation into the different C pools. This implementation improved significantly the beginning of the growing season timing (R2 = 0.92) and only resulted in an average 4-day shift compared to the SPA calculation.
Figure 6. Time series of observed and simulated C fluxes (NEE, GPP, and Reco) using the soil-plant-atmosphere (SPA) model in the Zackenberg site for the 2008–2018 period. The model uses the parameterization calibrated for Kobbefjord data (López-Blanco et al 2018) including modifications of the initial C stocks, leaf N, leaf mass per area (all based on in-situ field data), and Q10 of foliar and root respiration rates. Goodness-of-fit (R2) are only displayed for the validation period (2013–2018).
Download figure:
Standard image High-resolution image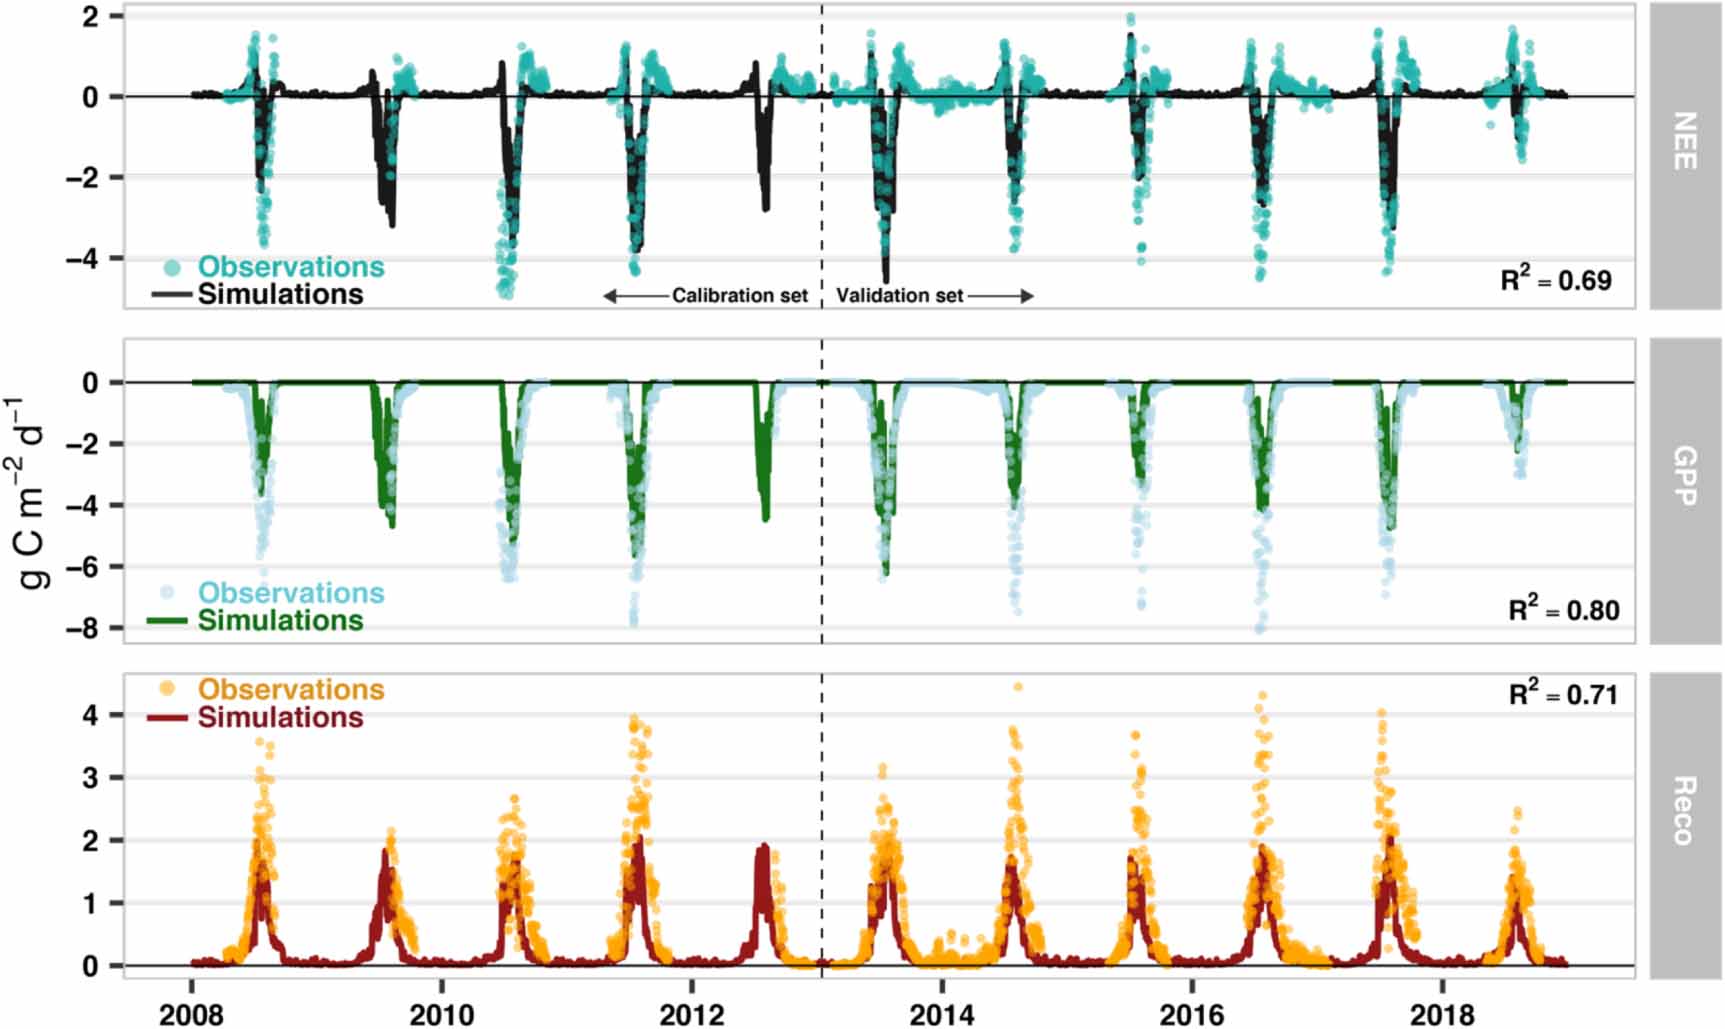
The SPA modelling showed that the observed difference in plant tissue N concentrations at Zackenberg relative to Kobbefjord could explain the identified increase the C uptake at the high Arctic site indicated by the EC observations (figure S2). SPA can generate a system consistent with Zackenberg fluxes only by parameterisation based on the biomass sampling data from the field campaign (average leaf N, LMA, maximum foliar C stock, initial C stocks of litter, roots and stems and C:N ratio in roots; see section 3.4). Using the initial calibration from Kobbefjord under Zackenberg climate fails to simulate annually aggregated NEE within the observation's range (figure S2). However, once the new information on C and N is updated in SPA, together with the updated Q10 of foliar and root respiration rates, the yearly aggregated NEE mean for the Zackenberg site between 2008 and 2018 is −54.9 ± 50.6 g C m−2 yr−1 while the NEE value extracted from the EC tower is −56.3 ± 20.9 g C m−2 yr−1. This finding shows the importance of the C and N changes, and emphasises the importance of N to C fluxes.
4. Discussion
4.1. How different is high arctic NEE compared to low arctic NEE in Greenland?
Zackenberg fen features lower interannual climate variability with systematically colder and drier conditions (figure 1), thicker snowpack, later snowmelt period (table 1), and shorter periods with net photosynthetic uptake during growing seasons compared to Kobbefjord fen (table 1, figure 2). These meteorology- and phenology-related conditions have not been an obstacle to greater C uptake than Kobbefjord, on average 32 g C m−2 more (figure 3), despite the shorter growing seasons. In this study longer growing seasons are not necessarily translated into larger net C uptake, similar to previous findings from Lund et al (2010) and Parmentier et al (2011). On average Zackenberg sequesters more C (NEE = − 70.8 g C m−2 yr−1) than other arctic wetlands at lower latitudes reported by Coffer and Hestir (2019) (table S1; mean NEE = −47.3 g C m−2 yr−1 and range of −119 to +79.3 g C m−2 yr−1) during the same period (June 1st to August 31st). Moreover, we found at least three specific extreme events that have notably disturbed the growing season C budget at both Zackenberg and Kobbefjord (figure 3). On one hand, a natural larvae outbreak had a significant impact on vegetation productivity in 2011 in Kobbefjord (Dahl et al 2017, Lund et al 2017). López-Blanco et al (2017) estimated a shift from source to sink of −30 g C m−2 yr−1 as average for the 2008–15 period to a source of 41 g C m−2 yr−1 while Lund et al (2017) reported a counterbalanced increase of C sink strength through the following 3 years. On the other hand, Christensen et al (2020) have reported multiple ecosystem effects triggered by extreme meteorological conditions indicating (1) a decrease of 18–23 g C m−2 yr−1 (close-to-zero NEE) during a 9-day rain event in 2015 and (2) a 314% weaker C sink strength in 2018 compared to the 2008–17 period forced by an extraordinary late snowmelt (i.e. 1 month delay in maximum daily CO2 uptake and 20 days shorter growing season). Reductions of 20–40 g C m−2 yr−1 are not trivial as these are similar to typical arctic fen ecosystem annual C budgets (Parmentier et al 2011).
Zackenberg fluxes were less sensitive to temperature compared to Kobbefjord (slopes of the regressions from figure 4(a)), perhaps linked to reduced phenological variability at this site (table 1). This study also found a compensatory effect between photosynthesis (GPP) and respiratory losses (Reco) for both sites (figure 4(b)) similar to previous findings reported in López-Blanco et al (2017) and previously described by Richardson et al (2007) and Wohlfahrt et al (2008). We noted however that the overall contribution to NEE in Zackenberg was dominated by photosynthesis (39 g C m−2 yr−1 more than Kobbefjord) compared to respiration (14 g C m−2 yr−1 less) (figures 3 and 4(b)). Consequently, controls of photosynthesis will be given a higher priority in the following sections.
4.2. What are the key driving factors contributing to the identified differences?
Our results suggest that the limitations of plant phenology timing and colder temperatures in Zackenberg regarding net C uptake have been more than counterbalanced by the increased content of plant tissue N, linked to richer soil nutrients. Here, it is the difference in nutrient availability, not the difference in climate, that explains the divergence in net C uptake between the two sites (figures 3, 4, 5, and S2). But at each site climate governs the interannual variability. We found higher N concentration levels in above-and below-ground plant tissues and soil water. It is well-known that arctic tundra ecosystems are generally nutrient limited (Chapin III and Shaver 1985) and that soil nutrient availability shape the patterns of plant abundance (Shaver and Chapin III 1980). Yet, site-specific differences such as geology, climate boundary conditions, flora, and fauna will control differences in nutrient availability between Zackenberg and Kobbefjord, which again contributes to differences in net C uptake.
4.2.1. C and N content in the aboveground domain.
The average foliar N measured in Zackenberg (2.76 g N m−2) is substantially larger compared to Kobbefjord (1.61 g N m−2; López-Blanco et al (2018)) (figure 5). Our foliar N estimate is similar to values previously described in the Zackenberg fen system; for instance Arndal et al (2009) reported 2.25 g N m−2 in 2004 during the peak of the season, Street et al (2012) presented 2.57 g N m−2 in 2006 and Mosbacher et al (2019) quantified 2.0 g N m−2 in 2015. Interestingly, Arndal et al (2009) found that the Zackenberg fen was the most productive system in terms of photosynthesis despite presenting the lowest biomass compared to the four surrounding ecotypes (mostly heathlands), featuring the highest leaf N, leaf chlorophyll, and moss content per unit ground area. These authors also proposed that a higher C sink strength is likely controlled by the N content in photosynthesizing tissues. Plants with high leaf N will have an enhanced productivity in fens (Aerts and Chapin 1999, Chapin III 1980). Our in-situ data (figure 5) suggest that plant C uptake is highly dependent on nutrient and mineral availability, and this explains differences in fluxes between Zackenberg and Kobbefjord (figure S2). This result opposes those from Siberian tundra sites, where microbes depolymerized, mineralized and immobilized N amounts more than the maximun capacity for plant N uptake (Wild et al 2018).
Additionally, Street et al (2012) found evidence that the well documented positive relationship between foliar N and LAI (Williams and Rastetter 1999, van Wijk et al 2005) is not shifted towards lower foliar N at high latitudes. In fact, the observed values of top canopy N per unit area were highest at Zackenberg, the second most northerly site among other low and high arctic sites such as Toolik, Barrow, Abisko and Svalbard. The authors also tested the hypothesis that lower irradiance at higher latitudes may modify the optimal development of leaf area with respect to available N; they have not found a direct result of changes in latitude and therefore day-length and/or sun angle. This finding is in line with our results (see figure S3) using a random forest machine-learning technique (Pedregosa et al 2011, López-Blanco et al 2017); the importance of photosynthetic active radiation to NEE at diurnal, seasonal and annual scales in Zackenberg (with 24-h daylight in the arctic summer) was not larger than in Kobbefjord. Likewise, Street et al (2012) found a significant correlation between the LAI-leaf N curvature and diffuse fraction of total shortwave radiation. The differences in diffuse radiation seems to be explained by cloud frequency, and Zackenberg had the lowest average summer diffuse fraction compared to Toolik, Barrow, Abisko and Svalbard. The fact that Zackenberg has lower precipitations and higher air pressure suggest less cloud cover and thus lower summer diffuse fraction compared to Kobbefjord (data not shown). This finding is important because under diffuse conditions N is distributed more uniformly due to greater light penetration (Roderick et al 2001, Meir et al 2002), regardless of other important factors such as canopy height, leaf angle and geometry (Street et al 2012).
Grazing patterns have in recent years been identified as a major driving factor for vegetation dynamics and in turn greenhouse gas exchanges in northern wetlands. Recent studies have demonstrated that small and large herbivory exclusion is capable of altering the CO2 balance and CH4 emisions (Falk et al 2015), being able to switch even the typical C sink during peak growing season into a source (Lara et al 2017). Moreover, the presence of muskox in Zackenberg has been associated with significant increases of N concentration and enhanced plant quality (i.e. C:N ratio) (Mosbacher et al 2019). Such changes are typically observed in experiments when herbivores are removed form the system (Henry et al 1990, Johnson et al 2011). The C:N ratio reported in this study from Zackenberg (21.7) is systemically lower (i.e. higher plant quality) than Kobbefjord (33.8) (López-Blanco et al 2018) and is within the range of previous observations retrieved from the same location: 22.9 (Arndal et al 2009), 21 (Mosbacher et al 2019), and 16.7 (Street et al 2012).
Higher C uptake capacity may also be positively influenced by the large abundance of mosses (405 g C m−2) and the high moss N content (10 g N m−2) (Arndal et al 2009, Street et al 2013). Bryophytes are well adapted to low light, unlike vascular plants that have a low light compensation and saturation point (Glime 2007). Hence mosses, and not the graminoids, could be an important cause of enhanced C sink in moss-dominated high arctic ecosystems during the shoulder seasons when the leaf area is reduced. In this study we show that the Zackenberg fen mosses are the major contributor to aboveground dry biomass and the total C and N pool, agreeing with previous findings from Falk et al (2015) and Arndal et al (2009). This, together with N2-fixing cyanobacteria closely associated with mosses benefiting from water saturated conditions, can enhance productivity in photosynthetic active tissues. Likewise, more moss biomass may contribute indirectly to higher C uptake (enhanced GPP) and N leaf pool sizes as the moss layer facilitate the cyanobacteria to reach larger biomass than on bare soil, thus enhancing N fixation and N availability (Arndal et al 2009).
4.2.2. C and N content in the belowground domain.
Our results show a higher availability of DOC and nutrients (DON, NO3−, NH4+, K+) for plant and microbial uptake in soils from Zackenberg during the 3-year overlap of available data (figure 5). Likewise, we found higher values of electroconductivity, commonly associated to a high presence of both cations (K+, Ca2+, Mg2+, Al3+, Mn2+, and Fe2+) and anions (Cl-, NO32−, SO42− HCO3−). In water saturated environments such as Zackenberg and Kobbefjord, nutrient concentrations are likely determined by the extensive lateral transport from adjacent slopes (Rasmussen et al 2020). Giblin et al (1991) concluded that in-situ mineralization rates of a tundra site in Alaska could not explain the available N by itself, indicating a lateral transport of nutrients into the system from the surrounding areas. The catchment for Kobbefjord fen is dominated by slow-weathering Precambrian gneisses (Søndergaard et al 2012), releasing very few (nutritive) minerals, as opposed to the catchment for Zackenberg fen with a high abundance of faster-weathering basalts and sedimentary deposits (Cable et al 2018). The downslope hydrological transport of mineral-rich weathered material is consequently higher in the Zackenberg fen catchment. Moreover, the available ions in the upper soil layers is likely elevated across the Zackenberg area due to an overall negative water balance (Westergaard-Nielsen et al 2020), whilst a positive water balance in the Kobbefjord area will favour higher levels of ion leaching from the upper soil.
During the snowmelt period in spring both Zackenberg and Kobbefjord meltwater redistributes N from uphill areas down to the low-lying fen areas. During snowmelt, the soil is still frozen, so a majority of the meltwater (and thus the soluble ions) will probably run-off as a pulse on the surface to the rivers in the first week of snowmelt (Westergaard-Nielsen et al 2020). In Zackenberg though, the fen is located in a wider catchment basin, which may favour higher landscape retention of the snowmelt water compared to Kobbefjord. Also, the possible slowing of run-off meltwater by richer biomass and larger flat areas may facilitate the accumulation of nutrients, explaining the high C and N pool sizes found in the soil water chemistry data. High values of DON, and especially oligopeptides (Farrell et al 2013), sustain faster plant and microorganism growth than does dissolved inorganic N during very short growing seasons, indicating plant adaptation to arctic ecosystems (Näsholm et al 1998). On top of that, changes in the active layer depth can result in substantial ecological and terrain disturbances such as soil organic C and N availability. For example, the existence of continuous permafrost in Zackenberg may help to retain N availability better than permafrost-free areas such as Kobbefjord (Harms and Jones Jr, 2012, Olefeldt et al 2014). Likewise, the uppermost part of the permafrost soil can immediately release more nutrients and plant-available N than active layer soils (Keuper et al 2012, Reyes and Lougheed 2015). These findings suggest that nutrients from the active layer could resupply and enrich the water column with ions from thawing permafrost, releasing a significant amount of plant-available N and ultimately stimulating net primary production.
4.3. What can be learnt from process-based ecosystem modelling?
Our CO2 exchange estimations for the 2008–2018 snow-free period using local meteorological forcing at Zackenberg and Kobbefjord can explain a significant part of the high temporal variability in NEE, GPP and Reco (figure 6, López-Blanco et al (2018)). In order to achieve the model calibration we relied primarily on in-situ data collected in 2019 during the monitoring field campaign. This aboveground biomass and soil core sampling effort was purposely designed to fill C cycle model calibration knowledge gaps. In López-Blanco et al (2018) we highlighted two important messages from Kobbefjord—N-related plant traits are the most sensitive parameters in the SPA model and therefore field data on C-N ratios decrease the model uncertainty. At Zackenberg, datasets on snowmelt period, leaf N, leaf mass per area, C:N ratio of roots, and C stocks of leaf, litter, stem, roots were critical to match model simulations with local observations of NEE (figure S2). The SPA model confirms that the differences in C cycling between the two sites are best explained when information about site-specific leaf nutrient parameters is included in the model. There is ample evidence from field manipulations of the sensitivity of primary production to nutrient additions at high latitudes, mediated by changes in plant traits (Shaver et al 2001). Our results support other Arctic biogeochemical modelling studies, e.g. TEM (McGuire et al 1992, Zhuang et al 2003) and MEL (Rastetter and Shaver 1992, Rastetter et al 2013), which concluded that regulation of arctic C cycling at the landscape and regional scales was linked to nutrient controls via C/N/P stoichiometry of plant tissues.
We also increased Q10 of foliar and root respiration rates to improve the plant respiration sensitivity to temperature since Zackenberg is ∼8.3 °C colder on annual basis (figure 1). Atkin and Tjoelker (2003) have shown that Q10 is not constant as it increases near-linearly with decreasing temperatures; short-term increases in temperature can have a greater potential impact on plant respiration in plants growing in cold climates (with an average leaf respiration Q10 ∼2.5–3). Likewise, Heskel et al (2014) revealed how in Toolik lake Q10 values also decreased with temperatures from ∼3.0 at 5 °C to ∼1.5 at 35 °C. In this version of SPA (López-Blanco et al 2018), maintenance respiration is calculated based on a modified version of the Reich et al (2008) equation built from on a strong respiration-nitrogen relationship. The fact that SPA shows a better agreement with EC observations with higher Q10 (figure S2) suggests that plants are thermally acclimated to colder temperatures and that respiration triples (i.e. Q10 = 3.0), and not doubles, per 10 °C rise in temperature (Atkin and Tjoelker 2003) at this high Arctic site.
In this study we show how to parameterize the SPA model with in-situ data from a single year peak season (figures 5 and S2). However, higher temporal information on C and N pool variability, similar to Arndal et al (2009) or Mosbacher et al (2019), may help understand the underlying processes and responses in shoulder season dynamics such as the snowmelt period, the rapid green-up and green-down phases and even extreme events such as a moth outbreak. Additionally, single year data may introduce bias. For example, 2019 (when the in-situ samples were collected) was an unusual warmer summer with thinner snow coverage compared to the 2008–2018 trend, and thus this year's meteorology may have enriched the allocation of biomass more than previous years. However, as noted earlier, our N samples in foliage in 2019 were close to values measured in other years. Finally, in relation with the model performance, the effect of changes in precipitation may have a role of interannual variation in fluxes. We found that the coefficient of determination for modelled vs measured NEE during anomalously dry summers was reduced (0.55) compared to wet summers (0.78) at Zackenberg. Further investigations of carbon-water interactions are required.
Using a simple set of parameters we can model high resolution temporal CO2 exchange with a good degree of agreement in complex arctic tundra ecosystems of varying fertility and climate. We believe this modelling framework forms an ideal framework for analysing new sites. Model simulations compared with results from multiyear CO2 exchange measurements can identify key process uncertainties, feedbacks between structure and function, and the sensitivity to extreme conditions. Two components are required to establish a description of the basic ecosystem-atmosphere interactions in the absence of direct flux measurements: (1) a quantification of the basic biomass and soil core sampling considering C and N status of the ecosystem, and (2) an ecosystem modelling component, e.g. SPA, describing the basic C dynamics based on key driving parameters, and linking C and N in plant tissues, independent of measured fluxes. Ecosystem modelling frameworks can fill process-based knowledge gaps, investigate climate feedbacks, and generate prognostic scenarios exploring the likely future implications of climate change on arctic tundra C cycle dynamics.
5. Conclusions
In this paper we used 20 years of EC measurements to explore CO2 exchange from two twin ecosystem stations in Greenland, Zackenberg (74°N) and Kobbefjord (64°N). Based on our findings we concluded that:
- (a)Zackenberg fen has a significantly higher C sink strength during repeatedly shorter growing seasons compared to Kobbefjord fen.
- (b)Zackenberg is a nutrient-richer fen—the increased C uptake strength is associated with (1) systematic higher C and N stocks, plant traits and enhanced plant quality in the aboveground domain, and (2) higher levels in soils of DOC, nutrients such as DON, NO3-, NH4+, K+, and electroconductivity in the belowground domain.
- (c)Despite the shorter growing season, carbon uptake and exchanges at Zackenberg were larger due to more nutrient—rich plant tissues.
- (d)More sites for high-temporal monitoring of terrestrial C dynamics are needed, especially in sensitive and rapidly changing arctic ecosystems, to establish robust baselines for model calibration and validation, thereby underpinning ecological forecasting techniques.
Acknowledgments
This work was supported by the Greenland Ecosystem Monitoring (g-e-m.dk) funded by the Danish Environmental Protection Agency and the Danish Energy Agency. The authors wish to thank the Nuuk and Zackenberg Ecological Research Operations. We thank more specifically the GeoBasis programme, which manages the eddy covariance and microclimate systems, as well as the active layer, water table, snow dynamics and soil water chemistry measurements. We would also like to thank Dr Julien Fouché for fruitful discussions on nutrient availability controls in plants and soils.
Data availability statement
Observational data from the Greenland Ecosystem Monitoring (GEM) programme are freely available from the GEM database (data.g-e-m.dk). Post-processed data and scripts are available from the corresponding author upon reasonable request.