


Abstract
The UVES (Ultraviolet and Visible Spectrometer) M Dwarf Planet Search program surveyed 40 M dwarfs and 1 M giant from 2000 through 2007 March. Two of the M dwarfs were double-lined spectroscopic binaries. The 38 single-lined M dwarfs in this survey are among the nearest and brightest M dwarfs. Starting with the reduced 1D spectra provided by the UVES team, we reanalyzed the UVES velocities of Proxima Cen as part of the "Pale Red Dot" program. The velocity rms decreased from 3.6 to 2.3 m s−1. Motivated by this result, we have harvested all of the raw data from the UVES M Dwarf Planet Search from the European Southern Observatory (ESO) archives and have written custom packages to generate 1D spectra from the raw data, and velocities from the 1D spectra. The median improvement in the velocity rms from the new analysis is 1.8 m s−1. Six of the 38 M dwarfs from the original study had a velocity rms < 4 m s−1. In the reanalysis presented here, 22 of these stars have a velocity rms < 4 m s−1. We improve the upper limits on possible planets orbiting these stars by a factor of typically two to three. For many of these M dwarfs, these observations represent the first epoch of high-precision velocity measurements.
Export citation and abstract BibTeX RIS
1. Introduction
Prior to the discovery of extrasolar planets, both theory (Boss 1995; Lissauer 1995) and popular imagination (Star Wars, Star Trek) envisioned that most planetary systems would resemble the solar system, with terrestrial planets orbiting in the inner few astronomical units, giant planets orbiting further out, all in concentric circular orbits (e < 0.1). It was not known what fraction of stars might host planets, with estimates ranging from near 0% to nearly 100%.
Not surprisingly the first decade of extrasolar planet discoveries was dominated by giant planets. They are much easier to find. The vast majority of the first 200 planets were found from precision velocity surveys (Butler et al. 2006). What was surprising was the diversity of planetary architecture, including hot Jupiters (Mayor & Queloz 1995; Butler et al. 1997) and eccentric planets (Marcy & Butler 1996; Cochran et al. 1997).
Since well before the detection of extrasolar planets, the main driver of the field has been the desire to detect and study terrestrial mass planets, especially those in the habitable zone where liquid water might plausibly exist on the surface of the planet (Kasting et al. 1993).
When the UVES (Ultraviolet and Visible Spectrometer) M Dwarf Planet Search program began in 2000 March, fewer than 50 exoplanets were known, only one of which was hosted by an M dwarf (Delfosse et al. 1998; Marcy et al. 1998). All of the known planets at that time were larger than a Saturn-mass. Compared to solar-type stars, terrestrial mass and potentially habitable planets around M dwarfs are much easier to detect. The lower mass of the host star yields a larger Doppler velocity amplitude. Due to the lower luminosity of M dwarfs, the potentially habitable zone is much closer to the host star. This further increases the Doppler velocity amplitude, and allows many orbits to be observed in a relatively short period of time. Working against this, the habitable zone around M dwarfs is narrower with respect to G and K dwarfs. A statistical analysis of the Kepler data suggests that 25% of M dwarfs harbor terrestrial and super-Earth planets in the habitable zone (Dressing & Charbonneau 2015). The primary problem with observing M dwarfs is their intrinsic faintness.
The UVES M Dwarf team (Kürster et al. 2003a) presciently combined the advantages of the large aperture VLT-UT2 (Very Large Telescope, Unit Telescope #2, European Southern Observatory (ESO), Paranal Observatory, Chile) with the spectacular new UVES spectrometer (Dekker et al. 2000), a cross dispersed echelle with a resolution of 130 K, to survey 40 nearby M dwarfs and 1 M giant. The M dwarfs were selected to have a V magnitude of ≤12.2 and a distance within 37 pc (Zechmeister et al. 2009, hereafter ZKE2009). Active stars were avoided based on their X-ray luminosity (Hünsch et al. 1999). The goal of this program was to probe the nearest M dwarfs with sufficient precision to detect terrestrial mass and potentially habitable planets. The results of this study, spanning 8 yr, were published in ZKE2009. While no planets were found in this study, it represents a ground breaking effort, combining a bold vision with state-of-the-art instrumentation.
Anthropocentrically the two most interesting M dwarfs are Proxima Cen and Barnard's star due to their proximity and history (van de Kamp 1963, 1969). Based on their earlier survey with the ESO 1.4 m CAT+CES (Kürster et al. 1999), these two stars were singled out by the UVES M Dwarf team (Kürster et al. 2003b; Endl & Kürster 2008). They were able to rule out planets larger than 2–3 MEarth in the habitable zone of these stars.
In 2004 the High Accuracy Radial velocity Planet Searcher (HARPS) precision velocity program began observing Proxima Cen. HARPS has been the state-of-the-art precision velocity instrument since its inception (Rupprecht et al. 2004), routinely approaching or exceeding a precision of 1 m s−1 (Pepe et al. 2011). The HARPS spectrometer is fed by the ESO 3.6 m telescope at the ESO La Silia Observatory in Chile. The HARPS spectrometer products, including the raw data, reduced spectra, and velocity measurements are available on the ESO archive after a typical embargo period of 1 yr.4
In 2012 Anglada-Escudé & Butler introduced the HARPS-TERRA (Template-Enhanced Radial velocity Re-analysis Application) technique to analyze HARPS precision velocity spectra. The velocities are constructed directly from the reduced HARPS spectra obtained from the ESO archive. Highlighting their importance, both Proxima Cen and Barnard's star were included among the eight stars examined in the initial HARPS-TERRA paper. The velocity rms of Proxima Cen from the traditional HARPS reduction technique was 2.38 m s−1, while the HARPS-TERRA method yielded an rms of 2.02 m s−1 (Anglada-Escudé & Butler 2012). Subsequent follow-up of the HARPS velocity measurements of Proxima Cen taken between 2004 and 2014 as analyzed by the HARPS-TERRA technique revealed possible periodicities in the region of 10–20 days, in the potentially habitable zone. This motivated the "Pale Red Dot" program to observe Proxima nearly every night from 2016 January 19 to March 31 (Anglada-Escudé et al. 2016). These high-cadence observations quickly revealed a strong periodicity at 11.2 days. A Keplerian fit to the velocities supported the existence of a 1.3 Earth-mass planet in the habitable zone. The Doppler semi-amplitude of this signal was 1.4 m s−1.
The UVES M Dwarf team had observed Proxima on 76 nights over 7 yr. The velocity rms of this data set from ZKE2009 was 3.6 m s−1. Starting with the reduced 1D spectra provided by the UVES team, we reanalyzed this data with an updated version of our velocity package described in Butler et al. (1996). This yielded an improved velocity rms of 2.30 m s−1. The dominant periodicity in the newly reanalyzed UVES data was at 11.2 days, and the velocities were in phase with the HARPS data (Anglada-Escudé et al. 2016).
This motivated the Pale Red Dot team to commence another high-cadence HARPS program, focusing on Barnard's star (Ribas et al. 2018), and the reanalysis of the entire data set from the UVES M dwarf program. We have subsequently harvested all the raw images from the UVES M dwarf program, and the associated calibration frames. We have reduced the raw images to 1D spectra with our custom raw reduction package, and generated velocities from our precision velocity package. In this latest iteration, the velocity rms of Proxima Cen has been reduced to 2.02 m s−1. Of the 33 stars in the UVES M dwarf survey with a velocity rms < 6 m s−1, the new reduction has decreased the velocity rms in every case, with a median improvement of 1.8 m s−1.
This paper presents the newly reanalyzed velocities from the UVES M dwarf program. The stars in the UVES M dwarf program are among the nearest and most interesting. This data set achieves a precision that is equal or better than any published result for these stars, demonstrating that UVES is among the finest precision velocity spectrometers in existence. Since we cannot go back in time, the first epoch observation of any star is critical. The earliest of these observations predate HARPS by about 4 yr.
Section 2 will describe the UVES spectrometer, the data reduction technique, and the updated velocities. Section 3 will examine the new detection thresholds on planet detectability from this data set and compare the results with ZKE2009. The conclusions will be presented in Section 4.
2. Radial Velocity Observations
UVES is a dual-arm cross dispersed echelle spectrometer. UVES is not thermally stabilized. At an elevation of 2635 m it is not subject to extreme temperature variations.5 For precision velocity measurements, an Iodine absorption cell is mounted directly in front of the spectrometer entrance (Marcy & Butler 1992), superimposing a dense forest of Iodine lines from 5000 to 6200 Å, which serve as a wavelength standard. In addition the shapes of the Iodine lines convey the point-spread-function (PSF) of the spectrometer (Valenti et al. 1995).
The blue arm of the UVES spectrometer covers the Iodine region. For precision velocity measurements either the 0 3 slit (Butler et al. 2004; Kjeldsen et al. 2005), or the fiber slicer (image slicer #3) yielding an effective 03 slit (ZKE2009), is used. The most important attribute of a precision velocity spectrometer is resolution. The resolution of UVES in either mode is 130 K, higher than most of the existing precision velocity spectrometers. Figure 1 shows the PSF of UVES compared to other Iodine-based instruments. Upon its inception, the Keck/High Resolution Echelle Spectrometer (HIRES) spectrometer was the state-of-the-art echelle (Vogt et al. 1994). UVES and Planet Finding Spectrometer (PFS), mounted on the 6.5 m Magellan II telescope at Las Campanas Observatory Chile (Crane et al. 2010), are evidence of the progress in the evolution of echelle spectrometer design over the past generation.

Figure 1. Point-spread-function (PSF) of echelle spectrometers with an Iodine cell, in the middle of the Iodine absorption region. In each case the PSF is from an observation of a star, taken through the Iodine absorption cell. The red line is the PSF from the UVES, taken through the fiber slicer, which yields an effective slit of 03. Blue and green lines are from the PFS spectrometer with slit widths of 03 and 05, respectively. HIRES is shown in black. The slit width and resolution of each spectrometer are listed in the figure.
Download figure:
Standard image High-resolution imageThe UVES M dwarf group used the AUSTRAL code to model the observed spectra and produce Doppler velocity measurements (Endl et al. 2000). The AUSTRAL code is based on the the modeling process outlined in Butler et al. (1996). The UVES M Dwarf survey collected data from 2000 through 2007 March. In 2009 the full UVES data set was published in ZKE2009. Of the 41 stars, two were determined to be double-line spectroscopic binaries (SB2) after two observations. These stars, GJ 190 and GJ 263, were subsequently dropped from the program. Table 1 lists the 39 remaining stars. The first column lists the star name and the second column lists the name assigned by ZKE2009. The spectral type is shown in the third column. The V magnitude is listed in the fourth column. The fifth column is the number of observations. The sixth column lists the velocity rms from ZKE2009. The seventh column lists the velocity rms from our analysis. The quadrature difference of the previous two columns is listed in the eighth column. The spectral type and V magnitude are from Table 2 of ZKE2009, and references therein. The number of observations and the UVES velocity rms is from Table 4 of ZKE2009.
Table 1. UVES M Dwarf Planet Search
| Star | ZKE2009 | Spectral | V (mag) | N_obs | U_RMS | V_RMS | Quadrature |
|---|---|---|---|---|---|---|---|
| Name | Type | Difference | |||||
| HIP56466 | GJ3671 | M0 | 11.20 | 12 | 5.6 | 3.65 | 4.25 |
| HIP82283 | GJ3973 | M1.5Vk: | 10.94 | 5 | 6.8 | 3.72 | 5.69 |
| HIP63550 | GJ3759 | M1V | 10.95 | 11 | 3.9 | 3.08 | 2.39 |
| GL433 | GJ433 | M1.5 | 9.79 | 54 | 4.4 | 3.55 | 2.60 |
| HIP55042 | GJ422 | M3.5 | 11.66 | 15 | 4.0 | 3.77 | 1.34 |
| HIP104059 | GJ817 | M1 | 11.48 | 25 | 4.9 | 2.71 | 4.08 |
| GL551 | Proxima | M5.5Ve | 11.05 | 76 | 3.6 | 2.02 | 2.98 |
| GL699 | Barnard | M4Ve | 9.54 | 75 | 3.3 | 2.58 | 2.06 |
| HIP86214 | GJ682 | M3.5 | 10.96 | 20 | 4.0 | 3.33 | 2.22 |
| HIP93206 | GJ739 | M2 | 11.14 | 19 | 4.4 | 3.59 | 2.54 |
| HIP110534 | GJ855 | M0.5 | 10.74 | 22 | 5.8 | 5.26 | 2.44 |
| HIP104432 | GJ821 | M1 | 10.87 | 35 | 5.0 | 1.63 | 4.73 |
| HIP22762 | GJ180 | M2 | 12.50 | 24 | 3.8 | 3.11 | 2.18 |
| HIP80268 | GJ620 | M0 | 10.25 | 5 | 7.3 | 4.19 | 5.98 |
| HD225213 | GJ1 | M1.5 | 8.57 | 24 | 2.5 | 2.05 | 1.43 |
| HD42581 | GJ229 | M1/M2V | 8.14 | 32 | 5.5 | 4.79 | 2.70 |
| HIP114411 | GJ891 | M2V | 12.20 | 25 | 7.5 | 3.77 | 6.48 |
| HIP47103 | GJ357 | M2.5V | 10.85 | 30 | 5.3 | 3.35 | 4.11 |
| HIP13389 | GJ118 | M2.5 | 10.70 | 26 | 6.5 | 5.70 | 3.12 |
| HIP19165 | GJ160.2 | M0V | 9.69 | 33 | 8.1 | 5.44 | 6.00 |
| HIP21556 | GJ173 | M1.5 | 10.35 | 12 | 5.3 | 3.02 | 4.36 |
| HIP27359 | GJ218 | M1.5 | 10.72 | 9 | 3.1 | 2.23 | 2.15 |
| HIP49091 | GJ377 | M3 | 11.44 | 14 | 6.7 | 2.91 | 6.04 |
| HIP65520 | GJ510 | M1 | 11.05 | 23 | 5.6 | 4.02 | 3.90 |
| HIP82256 | GJ637 | M0.5 | 11.36 | 17 | 6.4 | 3.56 | 5.32 |
| HIP108569 | GJ842 | M0.5 | 9.74 | 17 | 6.7 | 2.92 | 6.03 |
| HIP117886 | GJ911 | M0V | 10.88 | 17 | 14.9 | 3.24 | 14.5 |
| HIP7170 | GJ3098 | M1.5Vk: | 11.21 | 9 | 9.1 | 5.37 | 7.35 |
| HIP5812 | GJ3082 | M0 | 11.10 | 10 | 6.2 | 5.08 | 3.55 |
| HIP1734 | GJ1009 | M1.5 | 11.16 | 22 | 5.3 | 4.53 | 2.75 |
| HIP112452 | GJ4293 | M0.5 | 10.90 | 14 | 8.7 | 4.78 | 7.27 |
| HIP3143 | GJ27.1 | M0.5 | 11.42 | 30 | 6.1 | 4.27 | 4.36 |
| HIP37978 | GJ1100 | M0 | 11.48 | 12 | 9.3 | 3.78 | 8.50 |
| HIP17766 | HG7-15 | M1V | 10.85 | 11 | 8.7 | 8.91 | (1.9) |
| HIP1276 | GJ3020 | M2.5 | 11.54 | 13 | 298.8 | 330.0 | (140) |
| HIP94997 | GJ4106 | M2 | 10.82 | 5 | 20.7 | 28.6 | (20) |
| HIP61495 | GJ477 | M1 | 11.08 | 8 | 3486.0 | 3487.7 | (109) |
| HIP77349 | GJ3916 | M2.5V | 11.25 | 6 | 2107.7 | 2211.0 | (668) |
| HIP10812a | GJ1046 | M2.5 + v | 11.62 | 14 | 1248 | 1245 | (86) |
Note.
aKeplerian fit: p = 168.8 days, K = 1828, e = 0.28, M sin i = 32 Mjup, rms = 1.77 m s−1.Download table as: ASCIITypeset image
The first 33 stars in Table 1 have a velocity rms < 6 m s−1. The remaining six stars are truly variable. Kürster et al. (2008) have shown that HIP10812 (GJ1046) has a companion with a period of 168.8 days, a semi-amplitude of 1830 m s−1, and an eccentricity of 0.278, with an rms of 3.56 m s−1 to the Keplerian fit. We confirm this result, as shown in Figure 2. The minimum (m sin i) mass of the companion is 27 MJUP. As Kürster et al. (2008) note, this companion is interesting because of the paucity of brown dwarf companions to solar-type stars and M dwarfs. The rms of the Keplerian fit to the data in our analysis is 1.77 m s−1, consistent with the improvement in velocity rms seen in most of the program stars. This detection has been subsequently confirmed and the orbital parameters refined with the combined data sets of UVES, Fiber-fed Extended Range Optical Spectrograph (FEROS), and HARPS (Trifonov et al. 2018). The remaining variable stars (HIP 17766, HIP 1276, HIP 94997, HIP 61495, and HIP 77349) do not have sufficient observations or temporal coverage for orbital determination.
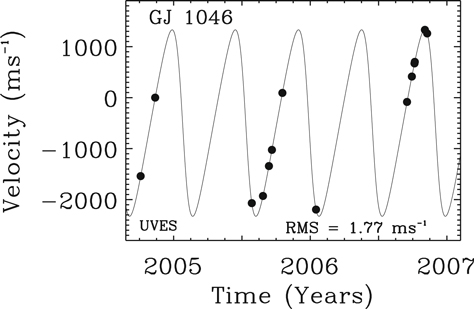
Figure 2. Keplerian fit to the velocities of HIP 10812 (GJ 1046).
Download figure:
Standard image High-resolution imageFor the 33 stars that have a velocity rms < 6 m s−1, our rms is significantly reduced compared to ZKE2009. If we assume that sources for velocity scatter add in quadrature, then the final velocity rms for any given star is given by  , where J is the contribution from stellar jitter, P is the contribution from orbiting planets, N is the contribution from photon noise, and R is the contribution from the velocity reduction package.
For each star in this program, the same data has now been analyzed by independent raw reduction and velocity reduction packages. For each star the velocity rms contributions from stellar jitter (J), orbiting planets (P), and photon noise (N) are identical, only the contribution from the reduction packages differ. The reduction in the velocity scatter due to the reduction package (R) can be estimated as the quadrature difference of the velocity rms of the original UVES data set with respect to the new reduction. This is shown in the final column of Table 1. The median reduction in R, the velocity scatter due to the Doppler velocity reduction code, is 4 m s−1.
For the six variable stars with a velocity rms > 6 m s−1, the contribution to the velocity scatter from stellar jitter (J) and planets (P) is large compared to the photon noise (N) and the reduction package (R). The quadrature differences for the velocity sets of these six stars are listed parenthetically. The ZKE2009 velocity rms for the variable stars is typically smaller than our results.
Velocities for the 35 stars with a velocity rms < 30 m s−1 are shown in Figure 1 of ZKE2009. We have reproduced this with our newly reduced data as shown in Figure 3. To allow direct comparison of the two velocity sets, we have used the same scaling, figure arrangement, and stellar names as shown in ZKE2009.
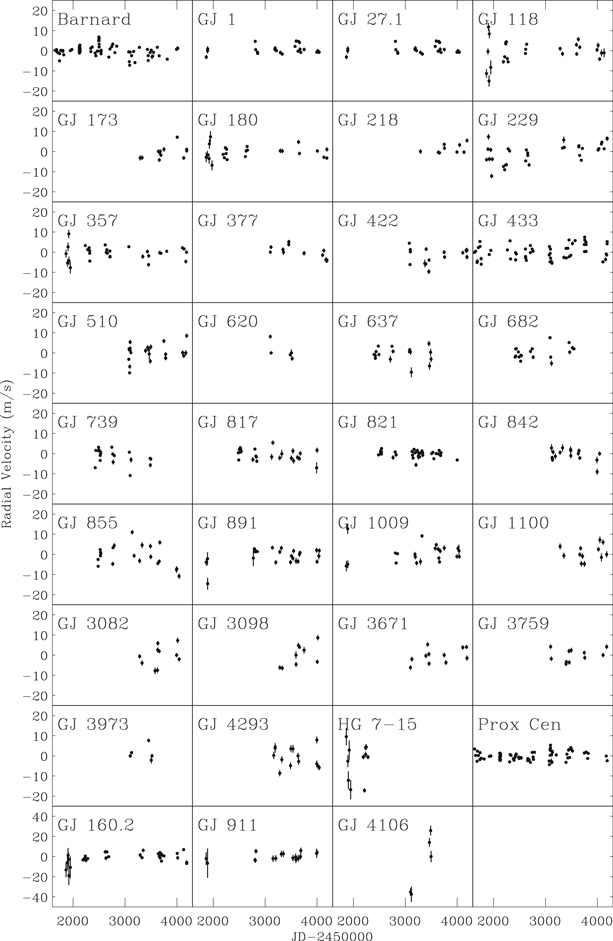
Figure 3. Radial Velocities for 35 M dwarfs from the UVES M dwarf planet survey.
Download figure:
Standard image High-resolution imageThe most obvious difference between Figure 1 of ZKE2009 and our Figure 3 are the stars with significant proper motion, notably Barnard's star (GL 699). The barycentric corrections computed in ZKE2009 do not include proper motion. Each star is assumed to have fixed coordinates. Table 3 of ZKE2009 provides a model of the secular acceleration due to proper motion for the program stars. This correction is shown as a linear fit to the velocities for the high proper motion stars in Figure 1 of ZKE2009. The rms of the ZKE2009 velocities includes their correction for secular acceleration.
Our barycentric correction code includes the stellar proper motion information. The stellar coordinates are advanced by the proper motion. Our final barycentric correction includes the effect of proper motion, so the resulting velocities do not show the effect of secular acceleration.
The two stars in Figure 3 with the largest velocity scatter (HIP94997/GJ4106 and HIP17766/HG7-15) also have the largest measurement uncertainty. For all of the remaining 33 stars, with a velocity rms < 6 m s−1, the velocity rms from our new reduction package is improved. The median velocity rms improvement is 1.8 m s−1. The median quadrature difference in the velocity rms is 4 m s−1.
The stars in this program were observed one to three times each night. ZKE2009 averaged all observations taken in a single night. We have followed this protocol in comparing the results of this study (Table 1 and Figure 3). For the stars with multiple observations per night, ZKE2009 estimated the internal uncertainty by averaging the uncertainties from the individual observations. We estimate the internal uncertainties for the binned observations by the more traditional method of inverse quadrature addition of the individual uncertainties. The electronic table of velocities in this paper provides the results for every observation. An example of this table is given in the Appendix.
3. Detection Limits
The UVES team estimates detection limits by injecting signals into their data, then attempting to recover them with periodograms, as shown in Figure 6 of ZKE2009. This approach can be sensitive to injected signals and avoids sampling the period range where significant periodogram powers are found.
We find and constrain signals using the adaptive Markov Chain Monte Carlo (MCMC) algorithm called "DRAM" introduced by Haario et al. (2006) and applied in Tuomi et al. (2014) and Feng et al. (2017). To explore the parameter space efficiently, we run multiple tempered (hot) chains to find local posteriori maxima and constrain these maxima using untempered (cold) chains. The algorithm is stopped when the inclusion of a new signal into the model does not increase the likelihood such that the Bayes factor is larger than 150 or the decrease of Bayesian information criterion (ΔBIC) is larger than 10 (Kass & Raftery 1995; Feng et al. 2016). We adopt the noise model comparison scheme introduced by Feng et al. (2017) to choose the optimal order of moving average (MA) models. We adopt a semi-Gaussian prior ( and e > 0; Feng et al. 2016) for eccentricity and uniform priors for the logarithmic period and other Keplerian parameters. Our use of a semi-Gaussian is based on the studies of the eccentricity distribution of confirmed Kepler planets (e.g., Van Eylen et al. 2019). The readers are refereed to Feng et al. (2019) for a detailed discussion of eccentricity priors. A uniform prior distribution over the logarithm period is frequently used in exoplanet detections (e.g., Ford & Gregory 2007; Foreman-Mackey et al. 2016).
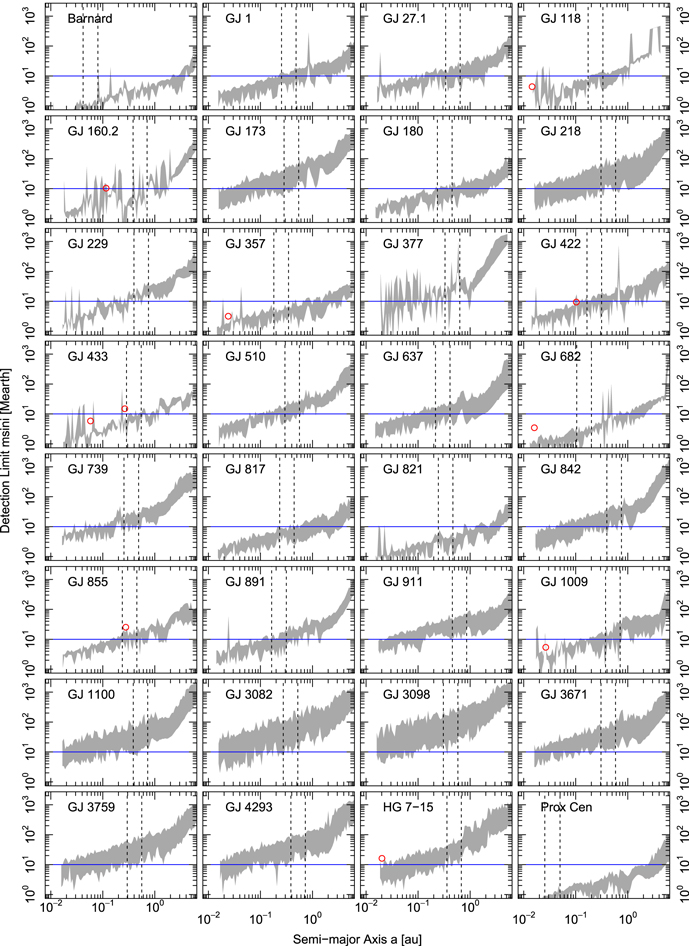
Following Tuomi et al. (2014), we determine the detection limit using the posterior samples drawn by multiple MCMC chains. For a data set with N signals detected, the MCMC chains for the N + 1-signal model would only explore the parameter space where additional signals could exist. Thus the boundary of unexplored parameter space for the N + 1 signal defines the detection limit for a given data set. Since the posterior distribution is probabilistic, the detection limit should also be probabilistic. Thus we show probabilistic detection limits in Figure 4 to compare with the detection limits shown in Figure 6 of ZKE2009.
Figure 4. Probabilistic detection limits for the new UVES data of 34 M dwarfs. The N statistically significant signals found in a given data set are denoted by the red circles. The gray region in each panel shows the probabilistic detection limit, which is defined by the 50% quantile of the posterior distribution of semi-amplitude (K50%) and the maximum of semi-amplitude Kmax in the posterior samples for the N + 1 signal. The habitable zone denoted by dashed lines is calculated using the method introduced by Kopparapu et al. (2014). The blue horizontal line represents the 10 M⊕ limit.
Download figure:
Standard image High-resolution image
Given the improved velocity precision of our data set, it is not surprising that the detection limit is about 2 or 3 times lower than in ZKE2009 for the habitable zone of Barnard's star. This also applies to other stars and does not depend on whether signals are identified or not. The upper limits of planetary mass for the habitable zones of Barnard's star, GJ 180, GJ 357, GJ 433, GJ 682, GJ 817, GJ 821, GJ 891, and Proxima Centauri, are less than 10 M⊕. Hence our new reduction of UVES data has significantly improved detection limits compared with those of ZKE2009 and demonstrates that these data sets are capable of detecting temperate Earth-like planets around M dwarfs.
A number of the identified signals maybe consistent with small planets or stellar activity. The period of the signal for GJ 118 is 1.06 days (ΔBIC = 10.6), for GJ 160.2 17.34 days (ΔBIC = 12.4), for GJ 357 3.93 days (corresponding to GJ 357 b6 ), GJ 422 20.26 days (ΔBIC = 20.8), for GJ 433 7.37 days (ΔBIC = 13.5) 71.99 days (ΔBIC = 22.9), for GJ 682 1.42 days (ΔBIC = 28.5), for GJ 855 68.63 days (ΔBIC = 13.2), for GJ 1009 2.11 days (ΔBIC = 12.6), and for HG 7–15 1.19 days (ΔBIC = 29.9). Some of these signals are reported in the literature such as GJ 433 b with a period of 7.37 days (Tuomi et al. 2014). Some of these signals differ from the signals reported in the literature due to a lack of combined analysis with other radial velocity data sets. For example, GJ 422 b has an orbital period of about 26.16 ± 0.04 days (Tuomi et al. 2014) while a signal around 20.26 days is found in the new UVES data. A combined analyses of these UVES data with other data extending the baseline and increasing the number of epochs will be necessary to quantify these signals.
4. Conclusion
When the UVES M Dwarf Planet search began in 2000, the least massive known exoplanet was 30% more massive than Saturn. There were only a handful of teams that had developed precision velocity capabilities. State-of-the-art precision ranged from 3 to 10 m s−1. The decision by the UVES M Dwarf Planet team to chase potentially habitable planets with an untested instrument was courageous. They would need to push velocity precision to the 1 m s−1 level.
Data reduction packages are not usually considered as a source of measurement uncertainty. A Doppler velocity shift of 1 m s−1 on an extraordinary spectrometer like UVES is slightly less than one-thousandth of a pixel on the CCD, or about seven Silicon atoms on the CCD substrate. Achieving and maintaining this level of precision is difficult. On UVES this is further complicated because it is a general purpose echelle spectrograph, used by programs with widely different wavelength coverage and resolution requirements. Major elements including the gratings and slit move. An optional fiber slicer can be used in place of the slit.
UVES differs from purpose-built precision velocity echelles, such as HARPS and PFS, where stability is valued above everything. The first rule of a purpose-built precision velocity echelle is that nothing moves, with the possible exception of the focus. This makes the results from UVES all the more remarkable. Beginning in 2000 March UVES spectra were recorded with sufficient information content to approach 1 m s−1 precision. This data set has now been reduced to 1D spectra with independently written raw reduction packages, and analyzed with independently written Doppler velocity packages. All of the sources of velocity rms (photon noise, stellar jitter, unknown planets) are identical, the only sources of difference are the data analysis packages themselves.
It is beyond the scope of this paper to account for the differences in the AUSTRAL code and our precision velocity package. Iodine precision velocity packages are complex. They must simultaneously solve for the wavelength, variable spectrometer PSF, and Doppler shift. Each star on the program requires a template (no Iodine) observation. The template must be deconvolved. Deconvolution remains more art than science. Our observing platform, the Earth, is moving relative to the barycenter of the solar system by ±30,000 m s−1. Achieving 1 m s−1 precision requires determining the barycentric correction to better than 0.1 m s−1. Imperfections in the raw reduction package can render all the work in developing a barycentric correction code and Iodine precision velocity package moot. Our Doppler velocity package is a direct descendant of Butler et al. (1996). This package is also producing 1 m s−1 precision with PFS data. We are preparing a manuscript titled "Attaining Doppler Precision of 1 m s−1 with an Iodine Absorption Cell."
The most important observation in a precision velocity data set is the first observation because observers cannot go back in time. For most of the stars in the UVES M Dwarf program, these are the first observations taken with state-of-the-art precision. This data set is all the more remarkable for focusing on some the nearest stars, and the stars most likely to harbor detectable potentially habitable planets. These observations will continue to be important in finding and constraining planets around these stars for decades to come. We do not expect this to be the final word on this remarkable data set. We look forward to future researchers reanalyzing this data set with a superior Doppler reduction package, and producing the surprises that emerge from better measurement precision.
This paper is dedicated to Sandy Keiser. Sandy passed away suddenly during the analysis of this data set. Sandy was a DTM (Carnegie Institution for Science, Department of Terrestrial Magnetism) astronomer and system manager who collaborated with many of the DTM astronomers. Her work was critical to this paper, and many of the precision velocity papers we have produced. We are grateful to the UVES M Dwarf team for having the courage and foresight to take on this extraordinary program. Starting back in the infancy of precision velocity measurements, they boldly went straight to the heart of the most interesting and challenging problem, finding potentially habitable planets around the nearest stars. This research has made use of the services of the ESO Science Archive Facility, the NASA Astrophysics Data System Bibliographic Service, and the SIMBAD database, operated at CDS, Strasbourg, France. We express our gratitude to the referee, Martin Kürster, for the careful reading of this paper, and the many helpful comments and suggestions.
Appendix: Appendix Information
The four columns are star name, date, velocity, and measurement uncertainty.
Table 2. New reduction of UVES data for 35 M dwarfs
| Star | MJD | RV | RV error |
|---|---|---|---|
| (day) | (m/s) | (m/s) | |
| GL699 | 2451655.72529 | 1.79 | 1.13 |
| GL699 | 2451655.72921 | 0.05 | 1.22 |
| GL699 | 2451655.73309 | −1.26 | 1.17 |
| GL699 | 2451681.80795 | 0.89 | 1.06 |
| GL699 | 2451681.81196 | −0.73 | 0.98 |
| GL699 | 2451681.81573 | 2.28 | 1.29 |
| GL699 | 2451688.66317 | −1.28 | 0.91 |
| GL699 | 2451688.66714 | −0.42 | 0.9 |
| GL699 | 2451688.67106 | 0.14 | 0.88 |
| GL699 | 2451707.67233 | −1.03 | 0.88 |
Only a portion of this table is shown here to demonstrate its form and content. A machine-readable version of the full table is available.
Download table as: DataTypeset image
Footnotes
- *
Based on observations collected at the European Southern Observatory, Paranal Chile, ESO programs 65.L-0428, 66.C-0446, 267.C-5700, 68.C-0415, 69.C-0722, 70.C-0044,71.C-0498, 072.C-0495, 173.C-0606, 078.C-0829.
- 4
- 5
- 6
Although this signal is not significant, it is confirmed as a transit planet (Luque et al. 2019) and thus should be subtracted from the radial velocity data.