Abstract
The filiform corrosion of Mg–3Zn Mg alloy in various corrosion environments was investigated by scanning electron microscopy (SEM) observations, scanning vibrating electrode technique (SVET) and electrochemical measurements. The results indicate that corrosion filaments can cross grain boundaries and fine precipitation phases to develop continually. The propagation of filiform corrosion is greatly associated with the existence of Cl− in the solutions. A small amount addition of F− or SO42− to the NaCl solution can delay the initiation of filiform corrosion, while abundant F− or SO42− addition can change the corrosion forms. The micro–anodes and micro–cathodes transfer dynamically with the growth of corrosion filaments. Mg–3Zn alloy exhibits a filiform corrosion mode at the applied anodic potentials but keeps intact at the applied cathodic potentials.
Export citation and abstract BibTeX RIS

This is an open access article distributed under the terms of the Creative Commons Attribution 4.0 License (CC BY, http://creativecommons.org/licenses/by/4.0/), which permits unrestricted reuse of the work in any medium, provided the original work is properly cited.
Mg and its alloys show high strength/mass ratio and low density, which attract great interest in the aeronautical and automotive fields.1,2 However, their poor corrosion resistance limits the widespread applications.3
Mg alloys are susceptible to localized corrosion. Among the different localized corrosion forms, filiform corrosion as one of common localized corrosion can damage the surface oxide films of Mg alloys, leading to an exposed surface in active state.4 If the filiform corrosion of Mg alloys is restrained, their life time will be prolonged dramatically. Thus, it is very necessary to clarify the filiform corrosion mechanism of Mg alloys.
However, the classical filiform corrosion mechanism of traditional metallic materials cannot well explain the filiform corrosion of Mg alloys. The classical filiform corrosion mechanism believes that corrosion filaments consist of acidic filament heads and alkaline filament tails, and the different oxygen concentrations at the filament heads and tails are the driving force for the growth of corrosion filaments. That is to say, the classical filiform mechanism defines the oxygen reduction reaction at the cathodic regions as the most significant factor in the growth of corrosion filaments.5 However, the classical filiform corrosion mechanism is not available for Mg alloys because hydrogen evolution reaction instead of oxygen reduction reaction occurs at the cathodic regions as proved by Baril et al.6 and Ambat et al.7 Also, a great number of experimental results indicate that the propagation of corrosion filaments on the surface of Mg alloys is insensitive to the existence of oxygen.8
In view of the ambiguous knowledge about the filiform corrosion mechanism of Mg alloys, a lot of investigations have been carried out to clarity this case, and some regular results have already been obtained. All these studies mainly focus on the effects of microstructures9–11 and corrosive environments11–14 on the filiform corrosion of Mg alloys. Lindstrom12 et al. disclosed the effects of CO2 and the roles of the noble inclusions in the filiform corrosion of pure Mg in the relative humidity air. Schmutz15 confirmed that the propagation of corrosion filaments was greatly associated with the surface oxide films and the orientations of Mg alloys. Williams et al.16 monitored the filiform corrosion of Mg alloys by SVET and found the inhibition effect of phosphate. However, these current results cannot still explain the growth driving force of corrosion filaments on Mg alloys because two key factors are not confirmed. The first key factor is the control step of corrosion reaction. Williams et al.17 reported that the propagation of corrosion filaments was driven by the cathodic reactions in view of the stronger hydrogen evolution reaction accompanying the severer corrosion. Lunder et al.18 proved that the growth of corrosion filaments was driven by anodic reactions due to the accelerated damage under the anodic applied potentials. The second key factor is related to the influence of corrosive mediums. NaCl solution is widely used in research,19,20 but little attention is paid to other environments.
Thus, this paper aims to clarify the growth process of corrosion filaments and the effect of various corrosion enviroments on the filiform corrosion of Mg alloys.
Experimental
The experimental materials used for this investigation were extruded Mg–3Zn alloy plates, which were provided by Korea Institute of Materials Science (KIMS). The chemical composition and preparation method of the Mg–3Zn alloy were given previously.21 Specimens for immersion tests and microstructure observations were wet–ground with water through successive grades of SiC abrasive papers from P180 to P5000, followed by polishing with 2.5 um diamond paste, and then degreased with ethanol, dried in cold air. Samples for microstructure observations were etched by the solution consisting of 4 ml nitric and 96 ml ethanol.
The solutions used for immersion tests were 0.01 M NaCl + x M Na2SO4 (x = 0, 0.01, 0.1) and 0.01 M NaCl + x M NaF (x = 0, 0.01, 0.1). The corrosion products after immersion measurements in NaCl solution were removed by a chromic acid solution containing 180 g L−1 CrO3. The microstructures and corrosion morphologies were observed using a Phillips XL30 scanning electron microscopy (SEM) with an acceleration voltage of 14 KV.
Scanning Vibrating Electrode measurements (SVET) were carried out to observe in situ the propagation of corrosion filaments and current density distributions. A commercial system from Applicable Electronics was used for the SVET measurements which were controlled by the Science Wares ASET 2.0 software. Before the tests, a pre–installed optical microscope was used to examine whether there was crevice corrosion on the surface of Mg–3Zn alloy. The Pt–Ir probe, a ball of platinum black at the tip, was platinized to form a small 20 μm diameter. The frequency of probe vibration in the perpendicular direction to the sample surface was 330 Hz. The measurements were carried out at the open–circuit potential (OCP). The time of acquisition for each SVET data point was 0.9 s. The local ionic current densities were mapped on a 40 × 40 grid in 0.0025 M NaCl solution. The mapping was carried out from the top to bottom of the sample with an approximately time of 24 min. The current densities were detected 100 μm above the sample surface within an area of approximately 9 mm2.
Electrochemical measurements were performed using a PARSTAT4000 electrochemistry test system (Princeton Applied Research, USA). A classical three–electrode cell was used with Saturated Calomel Electrode (SCE) (+0.242 V vs. Standard Hydrogen Electrode) as reference electrode, a large platinum plate as counter electrode, and the samples sealed in epoxy resin with an exposed area of 1 cm2 as working electrode. The anodic polarization curve measurement in 0.01 M NaCl solution started from OCP and terminated at a final current density of approximately 1 mA cm−2. The cathodic polarization curve measurement started from OCP and terminated at a potential of −400 mV vs. OCP. The scan rate was 0.5 mV s−1. Current–time curves in 0.01 M NaCl were measured for 2000 s under the anodic applied potentials of −1.5 V/SCE (Ecorr+0.15 V), below the film breakdown, and −1.3 V/SCE (Ecorr+0.35 V), above the film breakdown. The corresponding cathodic potentials were applied for comparison. Electrochemical Impedance Spectroscopy (EIS) tests were performed from 100 kHz to 10 mHz with a perturbation amplitude of 10 mV rms. The EIS spectra were fitted using the ZSimpWin 3.20 software. The solutions of 0.01 M NaF, 0.01 M NaCl, 0.01 M NaCl+0.01 M NaF and 0.01 M NaCl+0.1 M NaF were used for the EIS tests.
All of these tests were repeated at least three times to confirm the accuracy of the experiments. In the case of electrochemical measurements, three curves were first done under the same conditions. If the three curves showed good reproducibility, one of the curves was chosen as the measurement result. If the reproducibility of the three curves was poor, more measurements were carried out again until there were three curves with good reproducibility. As for the SVET experiments, three samples were used for the measurements. However, there were some differences for the initiation time and propagation rate of the three measurements, and the measurement with intermediate value was chosen as the reported results.
Results and Discussion
Microstructure and corrosion morphologies
The backscattered microstructure of Mg–3Zn alloy is shown in Fig. 1a. The fine white particles with discrete distribution in the grain boundaries are mainly composed of Zn and Mg by EDX detection. These particles are named as the MgZn second phases according to our previous work.21,22 Besides the MgZn second phases, there are some white particles locating in the interior of the crystal grains. Their chemical composition contains Mg and Si, named as other precipitation phases.22 The grain size of this alloy is non–uniform, from several micrometers to dozens of micrometers.
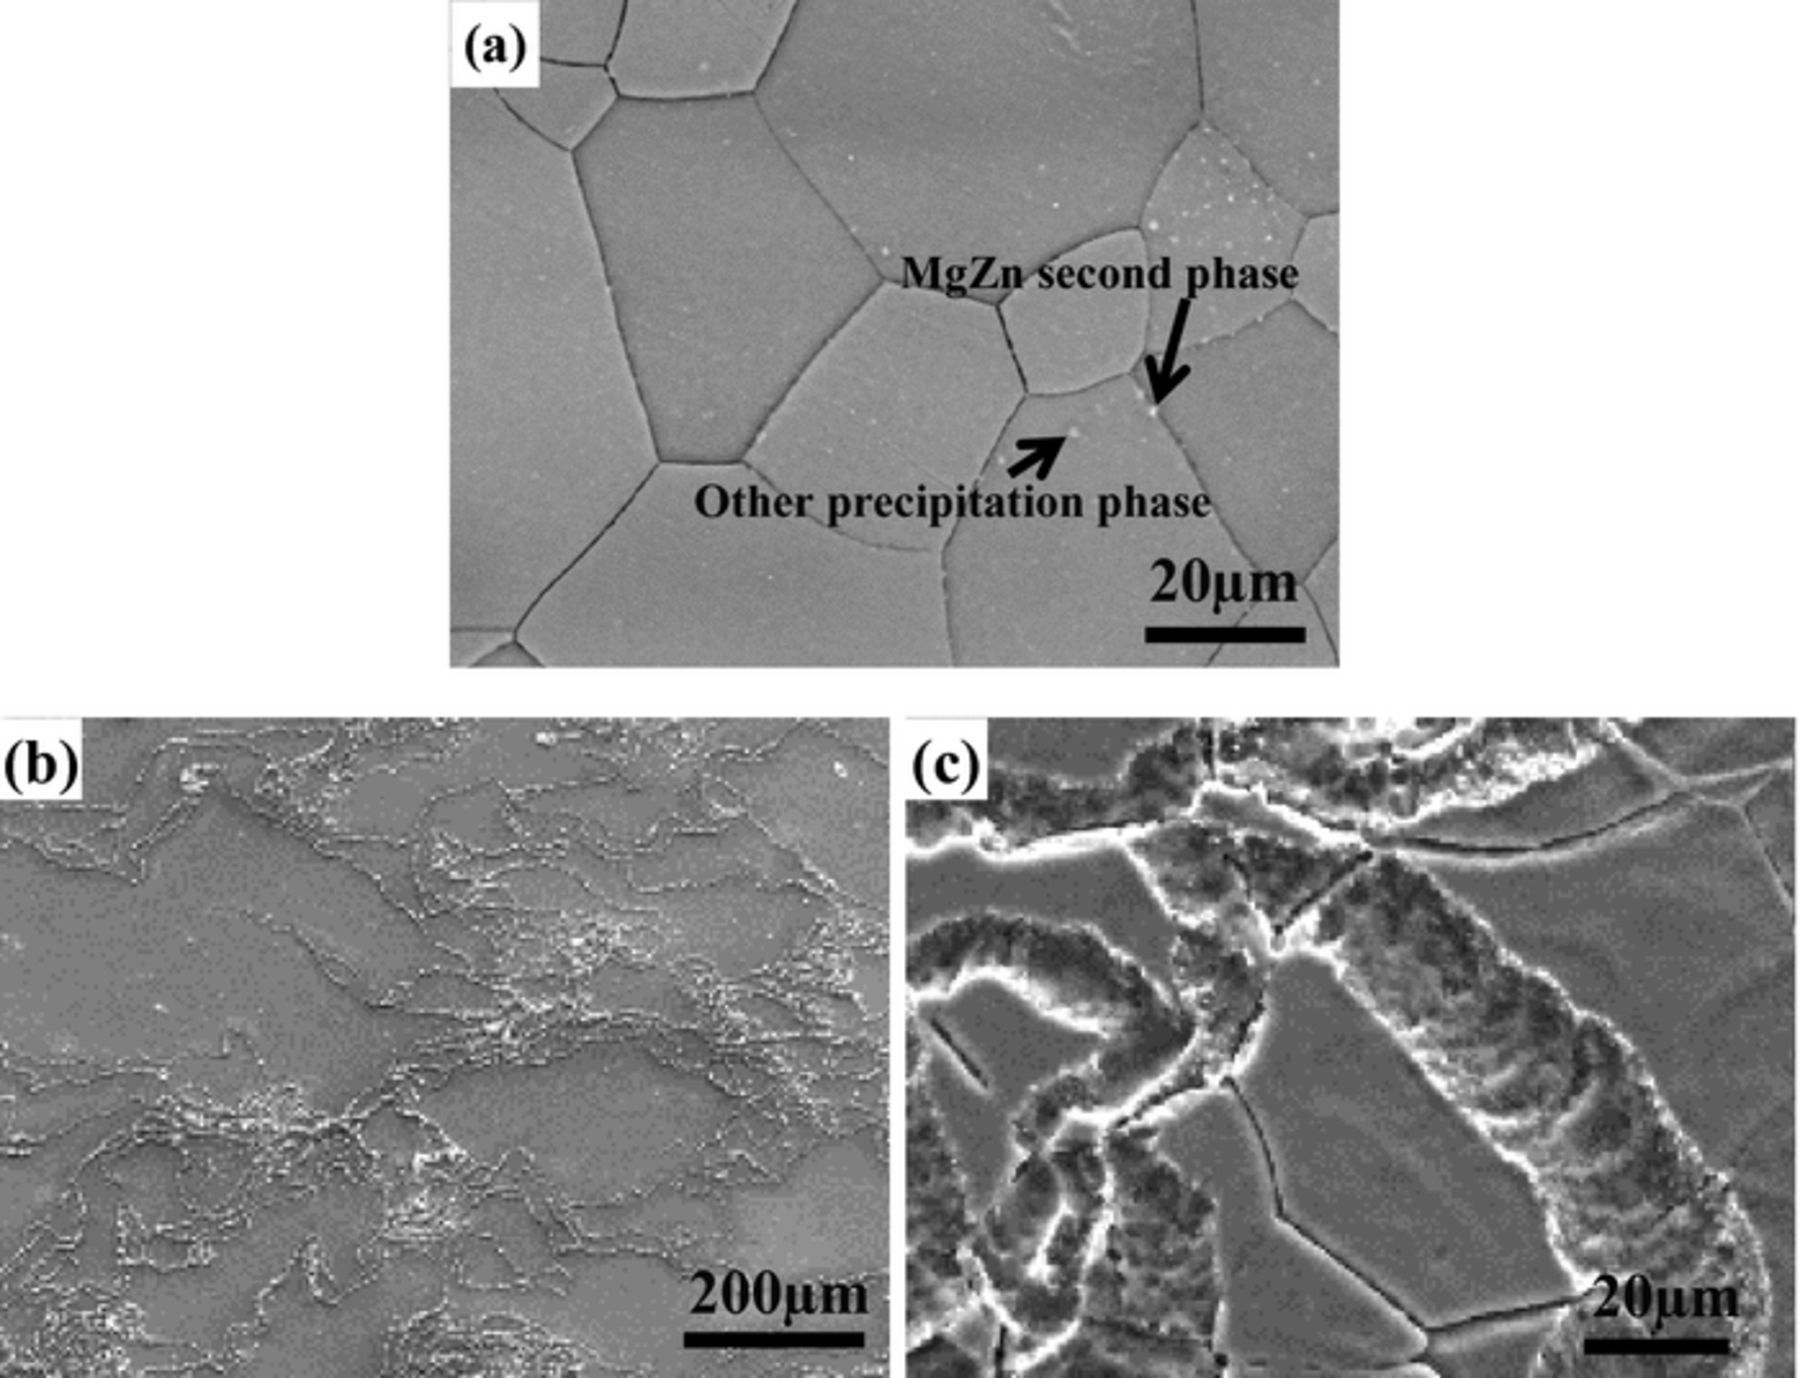
Figure 1. Microstructure (a) and corrosion morphologies (b, c) of Mg–3Zn alloy immersed in 0.01 M NaCl for 6 h.
The corrosion morphologies of Mg–3Zn alloy immersed in 0.01 M NaCl for 6 h are shown in Figs. 1b and 1c. Filament characteristics are observed, namely, the attack is filiform corrosion.5 The filaments have an arborescent structure and grow directionally. Filaments are quite thin and shallow. It is difficult to identify the head and tail of corrosion filaments. Most of filaments are not straight. The filiform corrosion morphology of Mg–3Zn alloy is the same as the classical filiform corrosion.23 Once initiated, the filaments diverge in different directions. If a filament encounters other filaments, it will reverse toward other directions or stop growing. The high magnification morphology in Fig. 1c shows that many shallow grooves with a width of approximately 10–30 micrometers are exposed. The corrosion filaments go through different grains. It seems that the grain boundaries and fine precipitation phases have not effect on the propagation of corrosion filaments.
The characteristics of corrosion filaments on Mg–3Zn alloy are similar to that on Mg–Li alloy.4 The filiform corrosion initiates from a central site, then the filaments grow toward various directions. However, the filiform corrosion morphology seen previously on Mg–Zn–Y–Zr Mg alloy24 is different from the Mg–3Zn alloy. The corrosion filaments on Mg–Zn–Y–Zr Mg alloy only extend a short distance, which begins from one corrosion site and terminates at the second phases. Finally, the Mg–Zn–Y–Zr presents pitting corrosion at longer immersion time. The different corrosion morphologies of Mg–3Zn and Mg–Zn–Y–Zr alloys are mainly attributed to the size of the precipitation phases. As for the Mg–3Zn alloy, the fine precipitation phases are mainly distributed on the grain boundaries. The micro–galvanic corrosion acceleration effect of the precipitation phases is weak. Also, the obstruction of the propagation of corrosion filaments by the precipitation phases is weak. Thus, the corrosion filaments can go through the grain boundaries and precipitation phases easily. In contrast, the dimension of precipitation phases in the Mg–Zn–Y–Zr Mg alloy is approximately dozens of micrometers, which is beyond the width of corrosion filaments. As a result, the propagation of corrosion filaments will stop once reaching the large precipitation phases.
It can be seen that the microstructure of Mg–3Zn alloy has not effect on the development directions of corrosion filaments. Thus, it is necessary to clarify the influence of corrosive environments.
Influence of corrosive mediums on the filiform corrosion of Mg–3Zn alloy
Mg–3Zn alloy in NaCl solution presents filiform corrosion. The role of other corrosive mediums in the filiform corrosion of Mg–3Zn alloy is not clear. Therefore, the effects of Na2SO4 and NaF were compared. Fig. 2 shows the corrosion morphologies of Mg–3Zn alloy immersed in the mixture solutions of NaCl and Na2SO4. When Mg–3Zn alloy is immersed in 0.01 M NaCl + 0.01 M Na2SO4 solution for 6 h (Fig. 2a), a typical filiform corrosion feature is observed. The width of corrosion filaments is approximately 30 μm, and slight cracks are visible on the corrosion products. The Mg–3Zn alloy still presents filiform corrosion morphologies with enhancing the concentrations of Na2SO4 five times (Fig. 2b). However, it needs a longer immersion time of 12 h for the formation of filiform corrosion. Thick corrosion products are accumulated on the corrosion filaments and wide cracks can be observed clearly. This means that Cl− ions play a key role in the formation of filiform corrosion and Na2SO4 can delay the initiation time. When the concentration of Na2SO4 is ten times more than NaCl (0.01 M NaCl + 0.1 M Na2SO4), a typical pitting corrosion instead of filiform corrosion is observed after 16 h immersion (Fig. 2c). This indicates that SO42− controls the corrosion process while the effect of NaCl is shielded. It is well known that chlorides are very aggressive to Mg alloys. Also, sulfates exhibit attack property to Mg alloys based on the results by Chen et al.25 and Song et al.26 who showed that Mg alloys suffer localized corrosion in Na2SO4 solution. However, SO42− is believed to have less influence than Cl−. As a result, when the concentration of SO42− is five times more than Cl−, Cl− determines the corrosion mode. With increasing the concentration ratio (SO42−: Cl−) to 10:1, SO42− determines the corrosion mode. These results reveal that Cl− play a more important role than SO42− in the filiform corrosion of Mg–3Zn alloy.
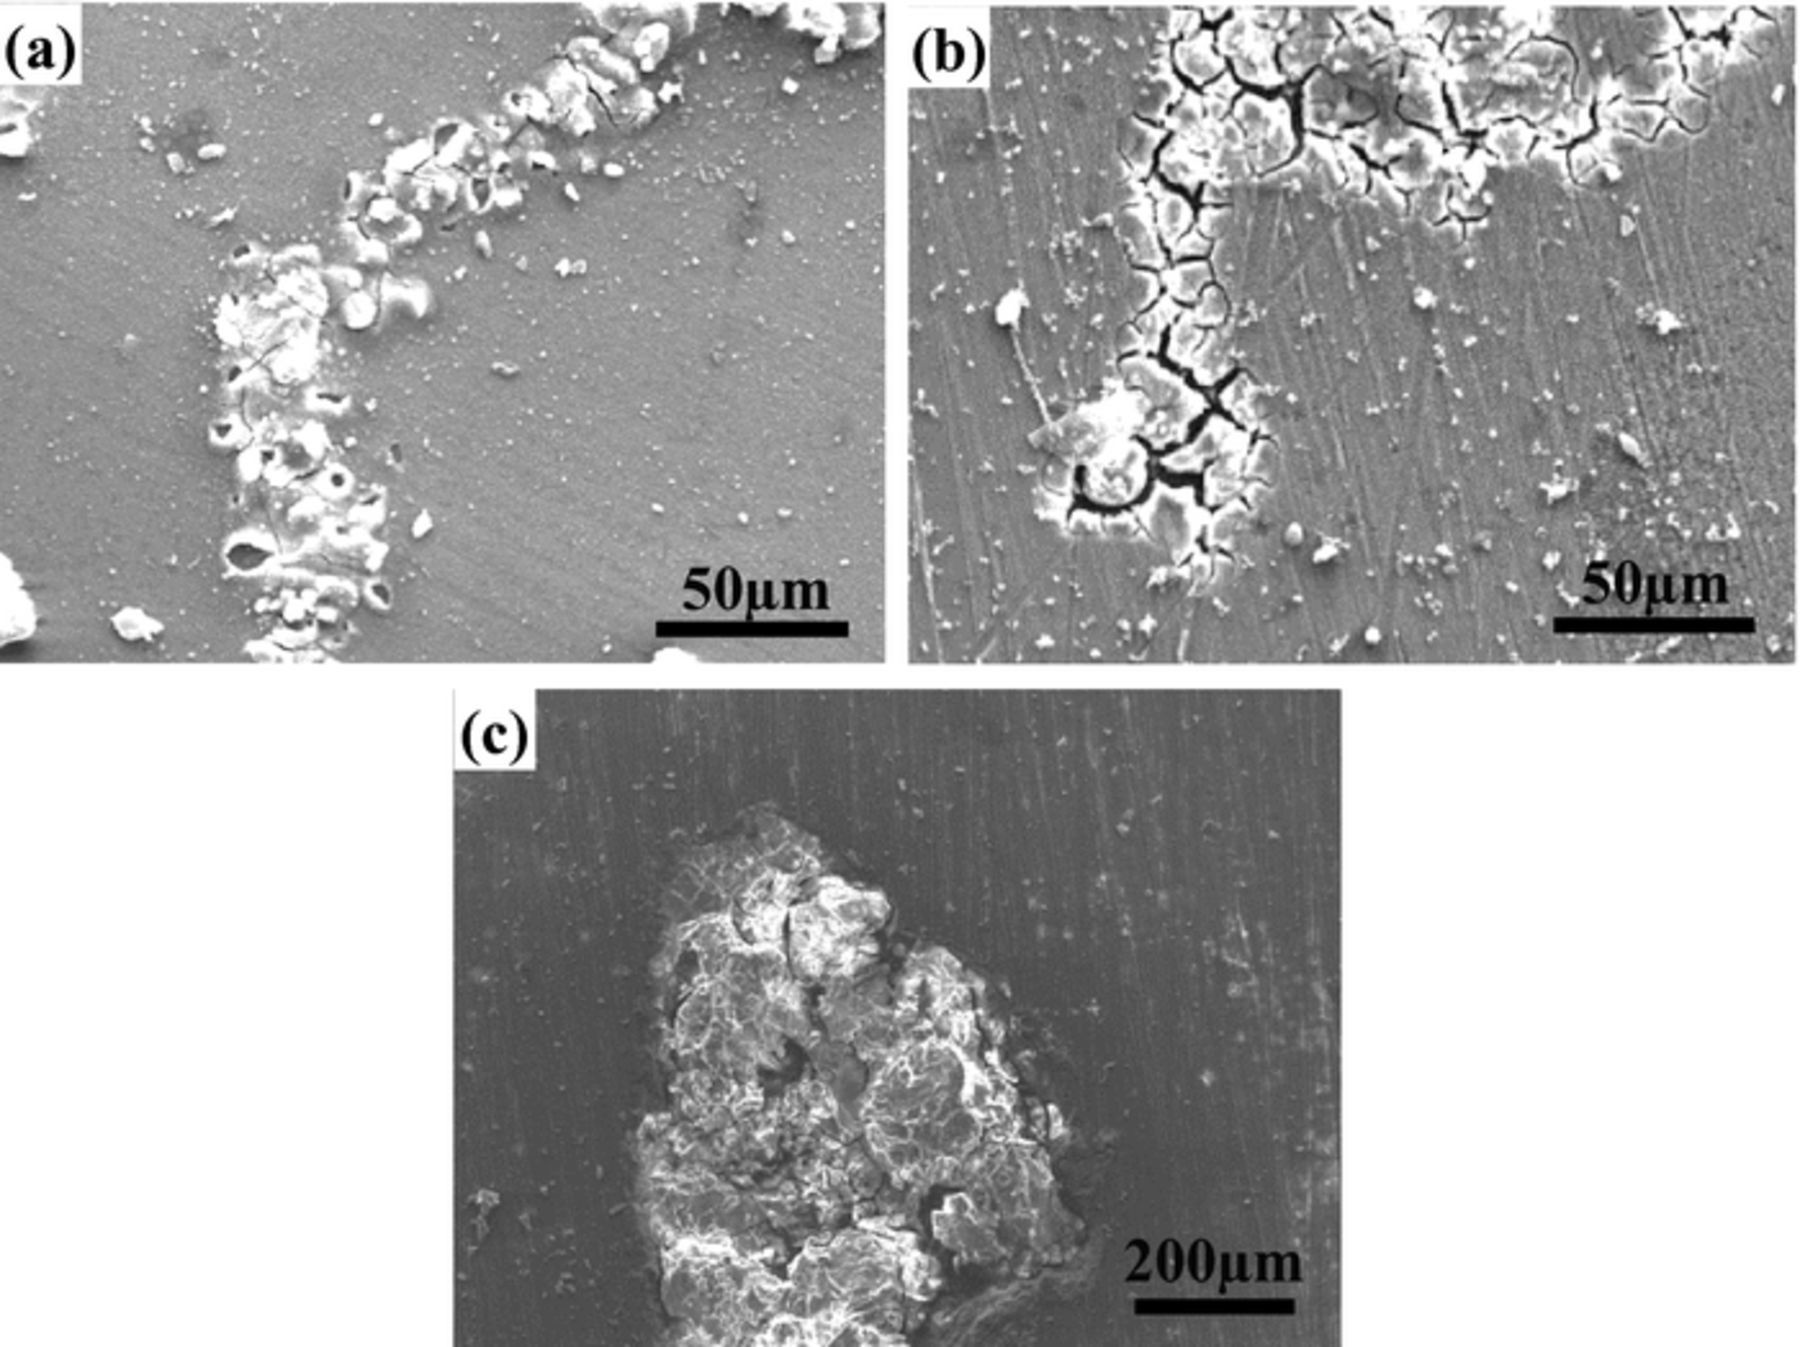
Figure 2. Corrosion morphologies of Mg–3Zn alloy immersed in 0.01 M NaCl + 0.01 M Na2SO4 solution for 6 h (a); 0.01 M NaCl + 0.05 M Na2SO4 solution for 12 h (b); and 0.01 M NaCl + 0.1 M Na2SO4 solution for 16 h (c).
F− is an inert ion for Mg alloys. Corrosion is not observed after a long time immersion of Mg–3Zn in 0.01 M NaF solution. The corrosion morphologies of Mg–3Zn alloy in the F–containing NaCl solution are shown in Fig. 3. The Mg–3Zn alloy still exhibits filiform corrosion form when the concentration ratios of Cl−: F− are 1:1 and 1:5, respectively. It is known that fluoride film can be formed on the surface of Mg alloys in F–containing solution. Actually, surface film with cracks can be seen clearly around the corrosion filaments in Fig. 3b. The Mg substrate is covered with thick surface film after immersion in 0.01 M NaCl +0.1 M NaF for 40 days, and filiform corrosion is not found again. This indicates that F− is helpful to passivate the Mg surface and delay the initiation of filiform corrosion. If the surface film is dense enough, it can inhibit the occurrence of filiform corrosion.
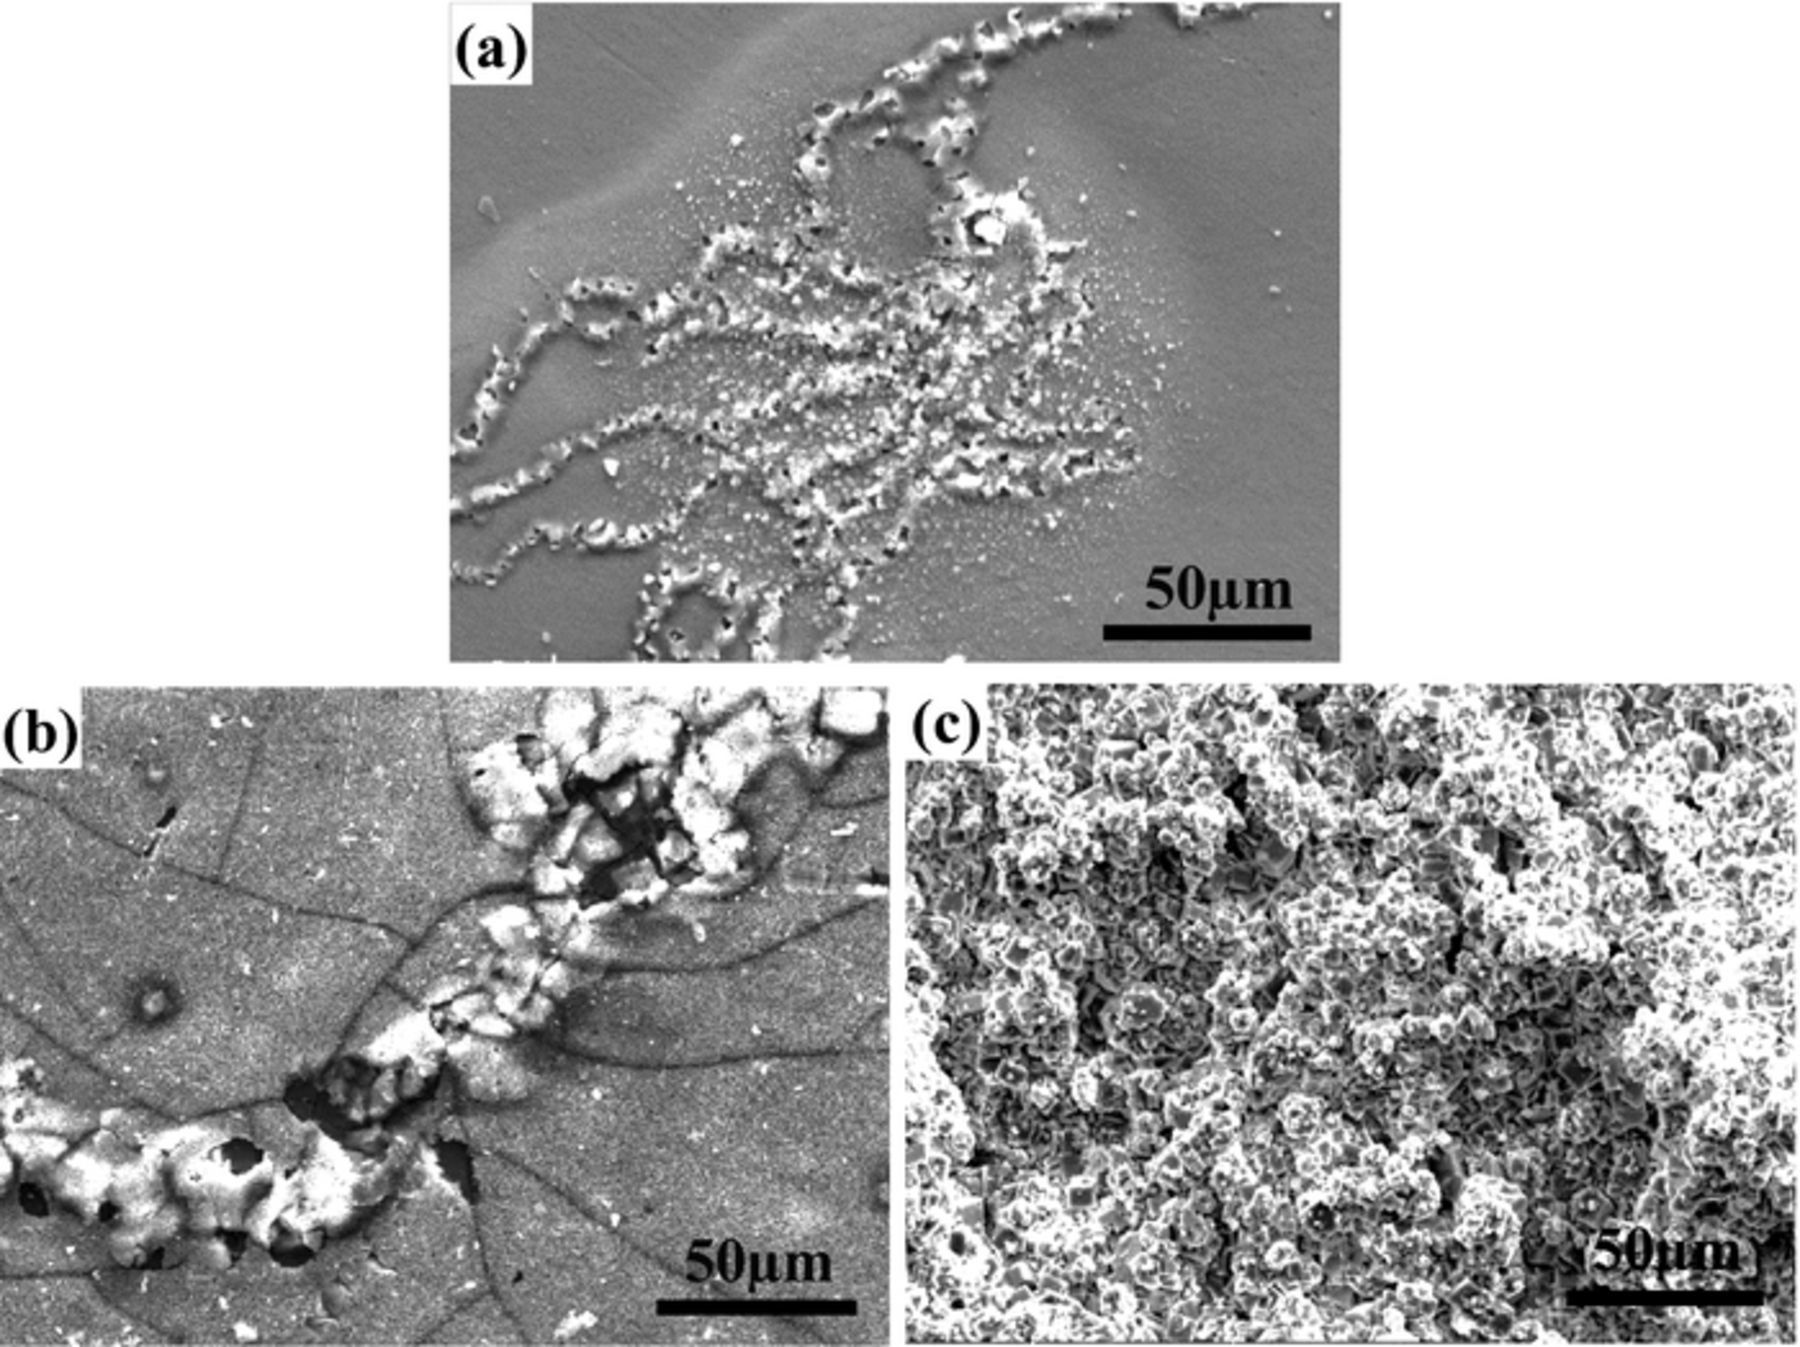
Figure 3. Corrosion morphologies of Mg–3Zn alloy immersed in 0.01 M NaCl+0.01 M NaF solution for16 h (a); 0.01 M NaCl+0.05 M NaF solution for 24 h (b); and 0.01 M NaCl +0.1 M NaCl solution for 40 days.
To further disclose the effect of F ions on the filiform corrosion–resistant of Mg–3Zn alloy, EIS measurements were carried out in the F–containing NaCl solutions and only the NaF solution. The EIS spectra are shown in Fig. 4. The Nyquist plots in various corrosion mediums consist of two loops. The first capacitance loops in high frequency correspond to the electric double layer formed at the interface of Mg substrate and solution.27,28 Baril et al.29 suggested that the second capacitance loop was attributed to relaxation of mass transport in the solid phase due to the growth of the corrosion product layer. Thus, the second capacitance loops in this investigation should be associated with the product films formed on the surface of Mg alloy. The dimensions of the high frequency capacitance loops and low frequency capacitance loops both gradually enlarge with increasing NaF concentrations. The plot obtained in the solution containing only 0.01 M NaF shows a higher impedance value than that in 0.01 M NaCl, indicating the higher aggressiveness of Cl−. The higher impedance value means better corrosion resistance. The EIS results prove that the stronger filiform corrosion–resistant property is exhibited with the higher F− concentration in NaCl solution.
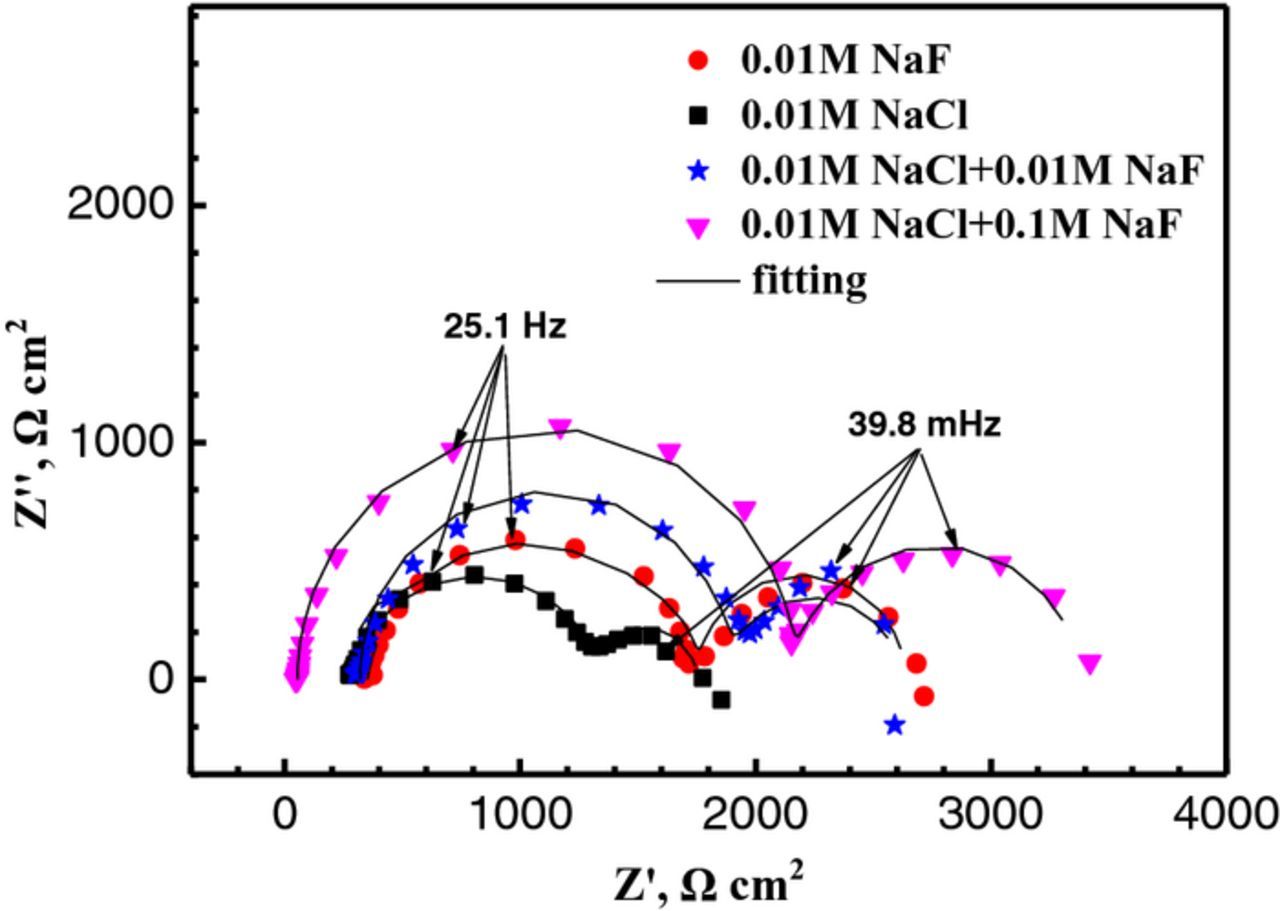
Figure 4. Nyquist spectra of Mg–3Zn alloy in 0.01 M NaF, 0.01 M NaCl, 0.01 M NaCl+0.01 M NaF and 0.01 M NaCl+0.1 M NaF solutions, respectively.
The EIS spectra are fitted by the equivalent circuit shown in Fig. 5. Rs describes the solution resistance. Rt and Qct represent the charge transfer resistance and electric double layer capacity at high frequency, respectively. Rf and Qf represent the film resistance and film capacity at low frequency, respectively. The EIS fitting results are listed in Table I. Rt and Rf increase with increasing F− concentrations, which indicates a lower metallic dissolution rate and a more protective film at the higher F− concentrations. The EIS results are in agreement with the corrosion morphologies in Fig. 3.
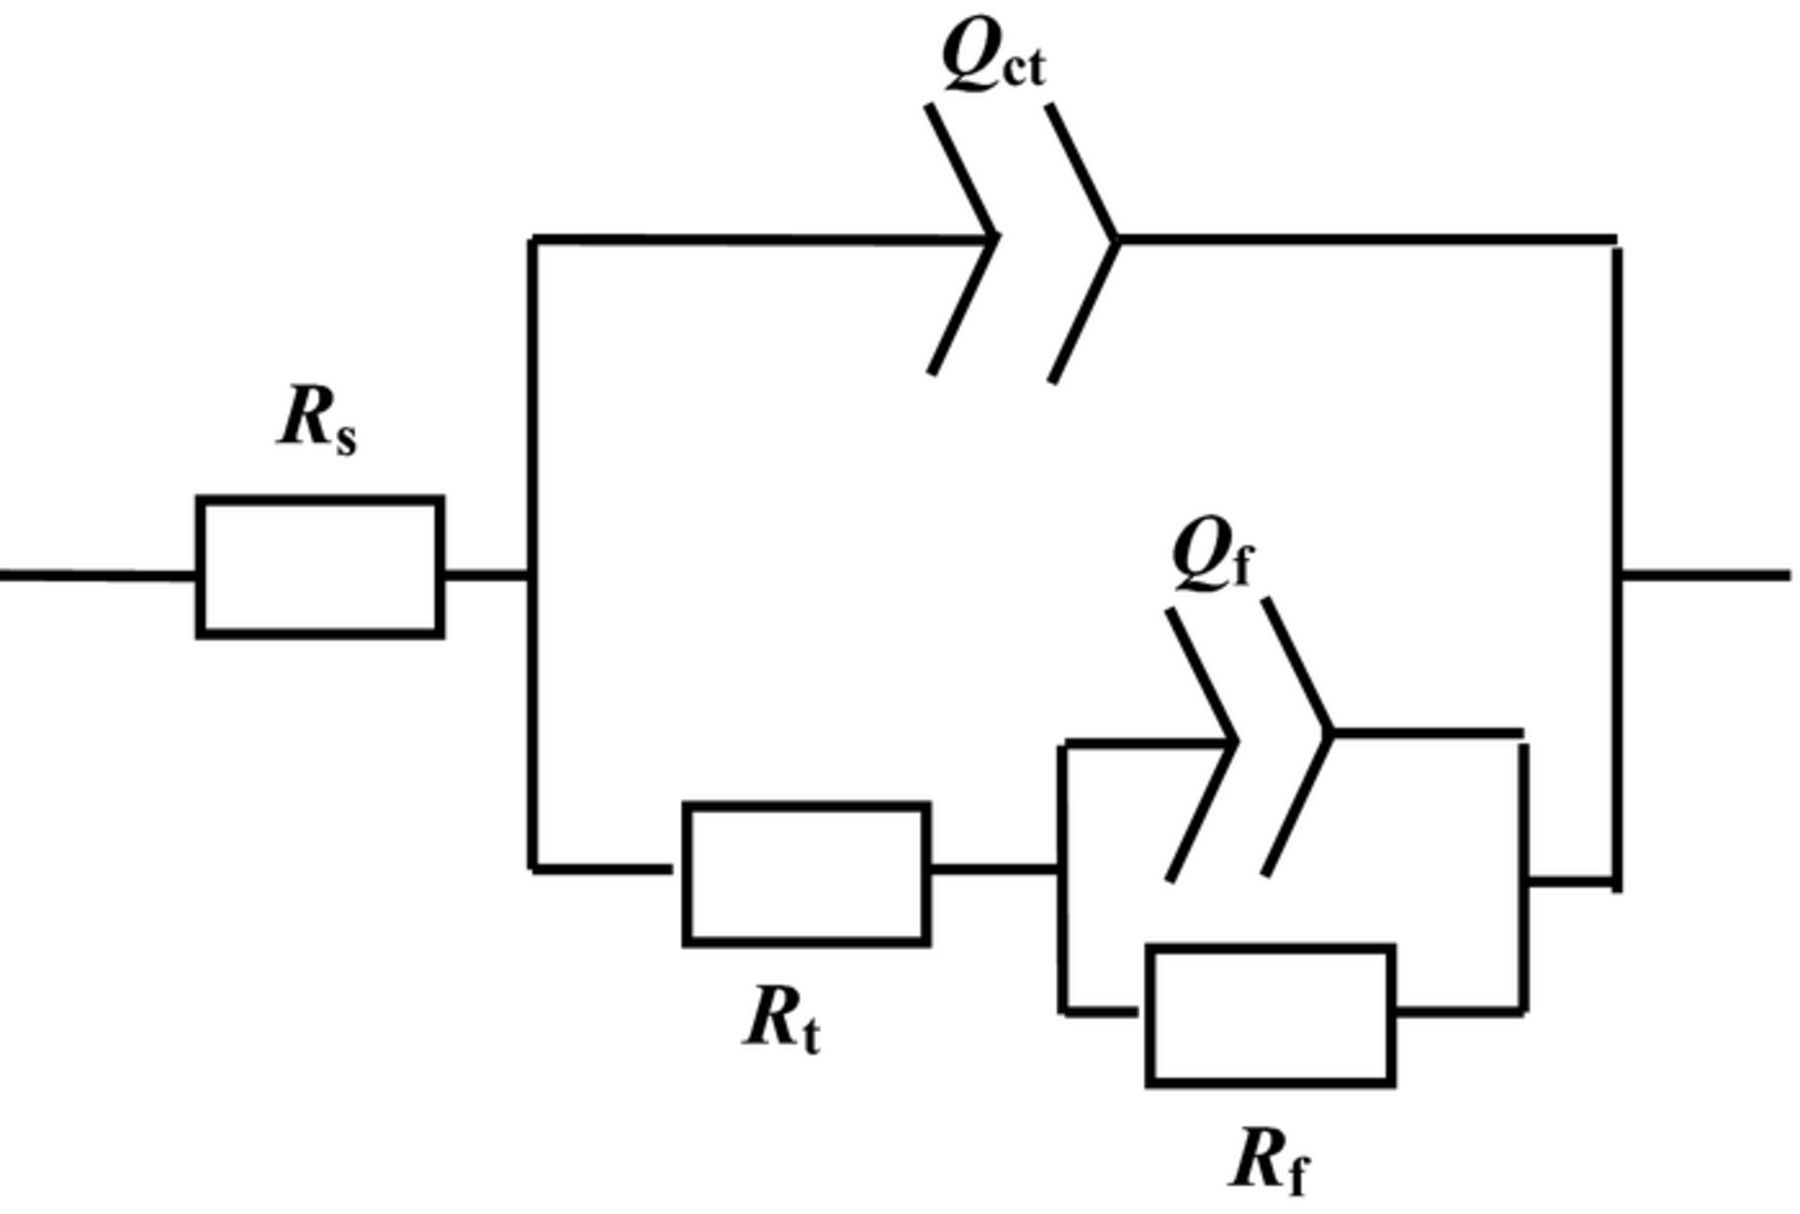
Figure 5. Equivalent circuit of EIS spectra.
Table I. Fitting results of the EIS spectra.
| Solutions | Rs /Ω cm2 | Rct /Ω cm2 | Qct /Ω−1 cm−2 s−n | nct | Rf /Ω cm2 | Qf /Ω−1 cm−2 s−n | nf |
|---|---|---|---|---|---|---|---|
| 0.01 M NaF | 351.4 | 1422 | 7.9 × 10⁻⁶ | 0.91 | 881.6 | 2.8 × 10⁻³ | 0.96 |
| 0.01 M NaCl | 277.9 | 1051 | 6.4 × 10⁻⁶ | 0.80 | 417.1 | 3.0 × 10⁻³ | 0.83 |
| 0.01 M NaCl +0.01 M NaF | 319.3 | 1586 | 6.7 × 10⁻⁶ | 0.94 | 718.3 | 2.0 × 10⁻³ | 0.91 |
| 0.01 M NaCl +0.1 M NaF | 53.51 | 2118 | 4.2 × 10⁻⁶ | 0.93 | 1211 | 2.5 × 10⁻³ | 0.91 |
The corrosion morphologies of Mg–3Zn alloy in various kinds of corrosive solutions prove that Cl− is a key corrosive ion to the formation of filiform corrosion. When the concentrations of corrosive SO42− and inhibiting F− are five times more than Cl−, Cl− still controls the corrosion process to form filiform corrosion. When the concentrations of SO42− and F− are ten times more than Cl−, the effect of Cl− is shielded to form pitting corrosion and no corrosion, respectively. This result may be attributed to the different features of Cl−, SO42− and F−. Cl− shows the strongest damage ability to the surface films than SO42− and F−. It can easily penetrate the surface oxide films and reach the metallic interface, leading to the initiation of corrosion. Thus, the effects of SO42− and F− at low concentration are slight. Although it still shows filiform corrosion, the initiation time is prolonged. However, more compact surface films can be formed on the solutions containing SO42− and F− than that formed in the solution containing only Cl−. The compact surface films can delay the initiation of corrosion. When the concentration of F− is much higher than the Cl−, a very compact fluoride film is formed. It is very difficult for Cl− to damage the fluoride film to form filiform corrosion. When the concentration of SO42− is much higher than Cl−, the damage ability of Cl− can be ignored and the attack property of SO42− will control the corrosion process. In addition, SO42– enriches at the bottom of corrosion pits, resulting in the propagation of corrosion deeply to form pitting corrosion. However, the surface film formed in NaCl is porous, and Cl− enriches in filament heads, resulting in the propagation of corrosion horizontally to form filiform corrosion. These results will be introduced in a subsequent paper in detail.
In situ investigation of the filiform corrosion of Mg–3Zn alloy by SVET
The previous results show that Cl− is a vital factor for the development of corrosion filaments. However, the detailed process for the initiation and development of filiform corrosion in the Cl–containing solution is not clear. The corrosion morphology observations by SEM can only show the overall corrosion information at some stages. SVET analysis is available to monitor the dynamic growth process of corrosion filaments continually. The filiform corrosion process of Mg–3Zn alloy in 0.0025 M NaCl solution is monitored using SVET. A sequence of photographic images and current density (j) distributions are shown in Fig. 6. At the initial stage of immersion (t = 185 min) as shown in Fig. 6a, a big hydrogen gas bubble can be observed at the top left corner of the optical photo as marked by the black arrow. This bubble should be formed together with the anodic dissolution reaction due to the Negative Difference Effect (NDE) of Mg alloys.30 The bubble site is the anodic area as well as the initiation site of filiform corrosion. The mapping of the current density image was carried out from the top to the bottom of the sample with an approximately time of 24 min, while the optical photos were taken at the end of the mapping. Thus, there is slightly delay for the optical photos in comparison with the current density image. The current density distribution in Fig. 6b exhibits an uneven color. The large blue areas with negative current density are cathodes. The small red areas on the left top corner show anodic current density but the values are very low. The red anodic regions in Fig. 6b are not in good agreement with the bubble site in the optical photo of Fig. 6a. This is due to that SVET only measures the net current flowing to remote sites of opposite polarity. It does not measure the current that is consumed at closely located sites.
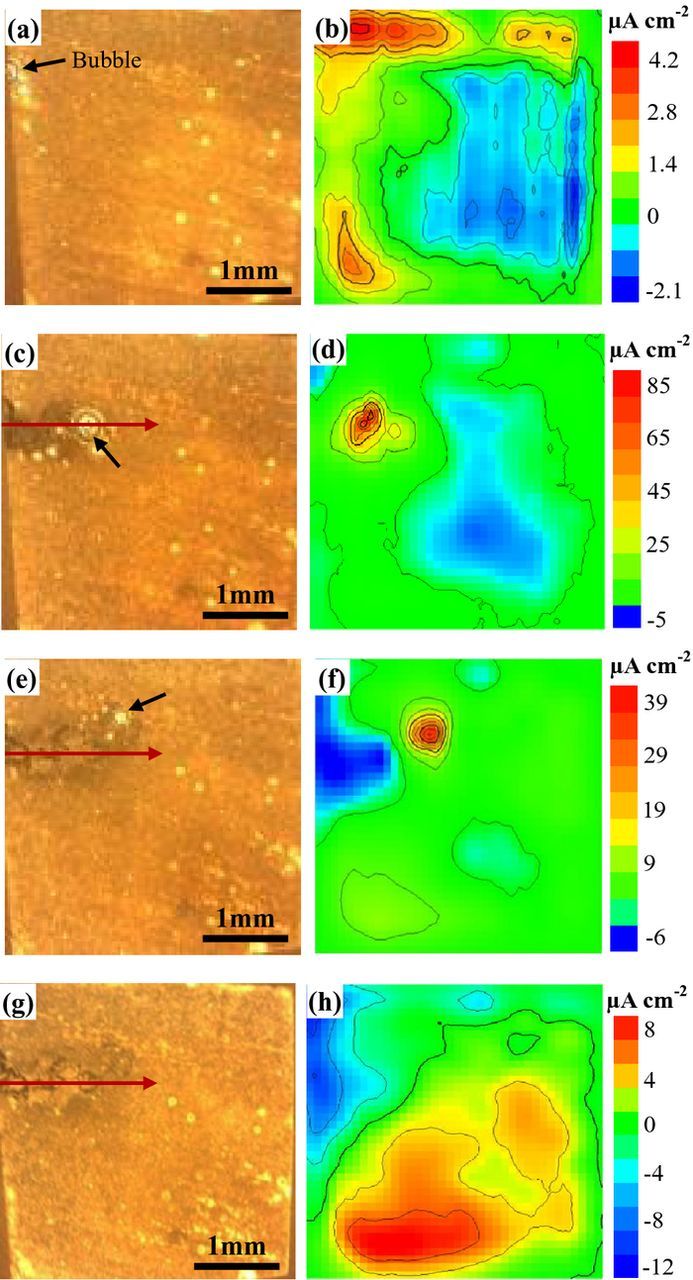
Figure 6. Corrosion micrographs (a, c, e, g) and current density distributions (b, d, f, h) of Mg–3Zn under in situ SVET measurements in 0.0025 M NaCl solution: (a, b) 185 min; (c, d) 225 min; (e, f) 265 min; (g, h) 305 min.
The corrosion spreads from the initiation point to form a dark track after 225 min immersion as seen in Fig. 6c. Filiform corrosion has been stabilized by this time. A big gas bubble close to the leading edge of the filament head is still seen. An intense net anodic current density (Fig. 6d) as shown in red color corresponds to the corrosion areas, while the areas in blue color act as net cathodes. At the immersion time of 265 min (Fig. 6e), the corrosion filaments continually propagate forward and a small gas bubble localizes in the leading end of corrosion filament. The corrosion filaments do not propagate along a straight line, and the filament head grows upward in comparison with Fig. 6c. The front corrosion areas correspond to a very intense net anodic corrosion current density in red (Fig. 6f), and the back corrosion areas present net cathodic current density in blue. However, the highest anodic current density at this immersion time is lower than that shown in Fig. 6d. The results in Figs. 6c–6f exhibit the growth process of corrosion filament.
When the immersion time reaches 305 min (Fig. 6g), there are no visible hydrogen bubbles observed at the filament head from the observation of optical photo. Also, the intense anodic corrosion current density in red color near the corrosion filaments disappears (Fig. 6h). The cathodic areas in blue color cover the whole corrosion filament. This indicates that the propagation of corrosion filament is terminated. The red regions at the bottom of current density image can be associated with the initiation of new corrosion sites.
The corrosion current density jz versus the propagation distance of corrosion filament is shown in Fig. 7. The data for the Fig. 7 are chosen along the red arrows in Fig. 6. Because the strongest anodic current density is observed in Fig. 6d, the current density profile is determined along the red arrow crossing the bubble in Fig. 6d first. The red arrows in Figs. 6e and 6g are at the same location as Fig. 6c. At immersion time of 225 min, an intense net anodic current density peak value reaches approximately 58 μA cm−2, and then the current density decreases, tending to a stable value of around zero. At the immersion time of 265 min, the current densities at the same location (the peak current density regions at the immersion time of 225 min) become negative, indicating that the previous filament head become a filament tail. The filament tail regions are more negative than the regions without corrosion. Because the red arrow in Fig. 6e does not cross the bubble, the peak value of anodic current density (approximately 8 μA cm−2) should originate from the vicinity of filament head. At the immersion time of 305 min, the anodic current density peak value cannot be found again. The corroded areas still show a cathodic current density. Based on the analysis of anodic current density peak values, the corrosion filament exhibits the highest propagation rate at the immersion time of 225 min, then the propagation rate reduces at 265 min, finally the propagation of corrosion filament terminates at 305 min. The average propagation rate of corrosion filament for Mg–3Zn alloy in 0.0025 M NaCl solution is 0.35 μm s−1 calculated from Figs. 6 and 7.
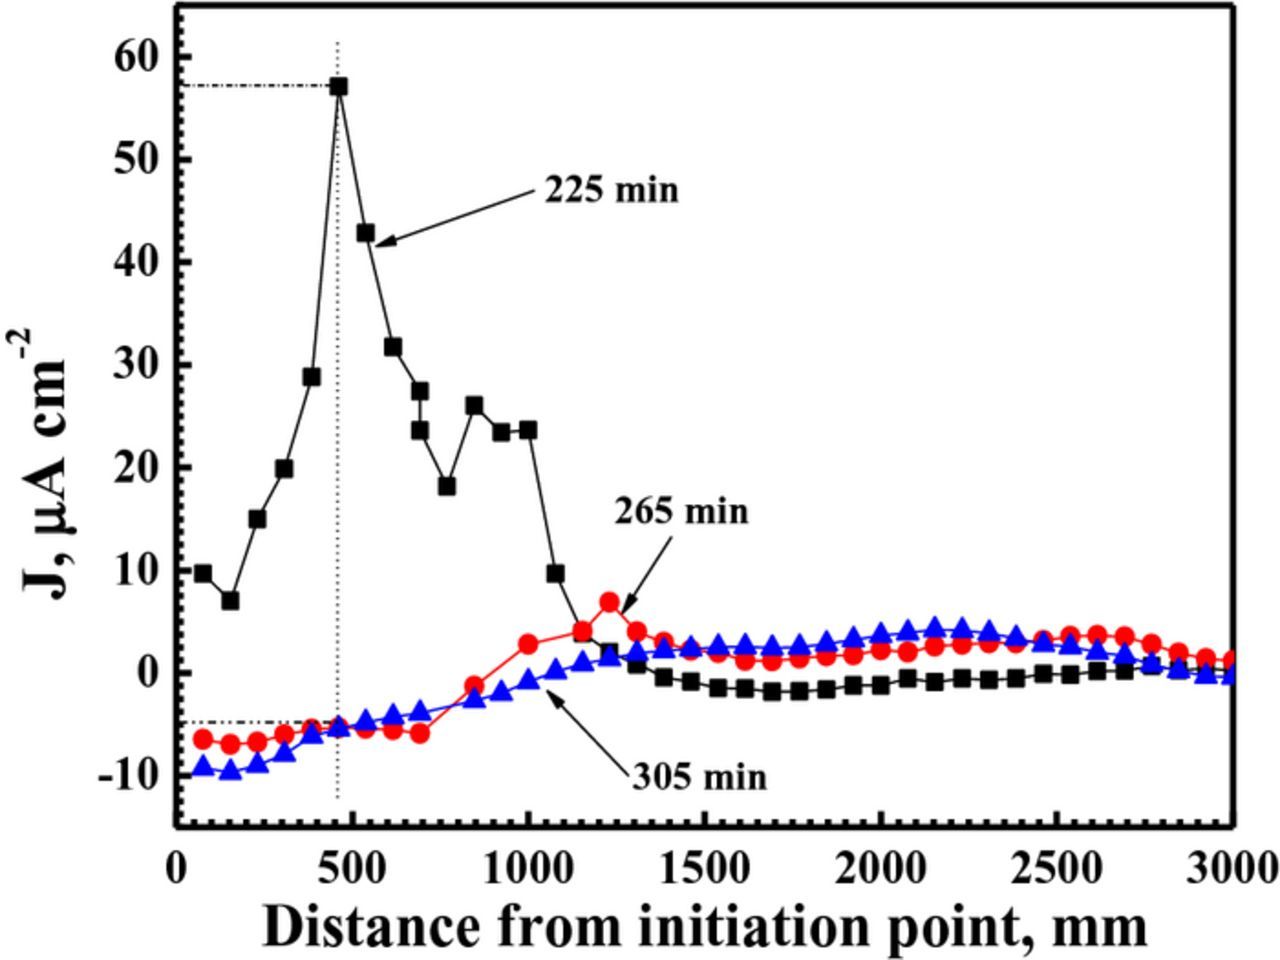
Figure 7. SVET–derived current density (j) profiles taken along a propagating cluster of filiform tracks marked by red arrows in Fig. 6 on a freely corroding Mg–3Zn surface immersed in 0.0025 M NaCl solution for 225 min, 265 min and 305 min, respectively.
It is well known that Mg and its alloys exhibit a unique NDE and hydrogen evolution reaction can occur at the anodic areas. The gas bubble observed at the leading end of corrosion filament named as filament head should be the anodic areas, corresponding to a strong anodic current density in red color. The anodic regions move away from the initiation point, and leave behind the region to form the cathodic passivity in blue color, named as filament tail. Successive scans in Fig. 6 also show that the anodic areas become strong localized cathodes when the anodic sites move to the intact Mg surface. The image of corroded surface at the end of the tests in Fig. 6g confirms that the absence of hydrogen evolution at filiform head means the termination of filiform corrosion. The in situ observation by SVET confirms that the corrosion microcells change dynamically with the growth of corrosion filaments. All the mapping images as local micro–anodes and micro–cathodes are consistent with the SVET results presented elsewhere for pure Mg and AZ31 Mg alloy.15–17 Only the propagation rates of corrosion filaments are different due to the different Mg substrate and corrosive solutions.
There is a long induction period for the formation of filiform corrosion. Before the end of the induction period, corrosion pits cannot be observed from the optical image of Mg–3Zn alloy. The induction period may be associated with the surface oxide films. Corrosion should initiate from a thin or incomplete oxide film. If NaF or Na2SO4 are added to the NaCl solution, it can improve the compactness of surface films, further delay the initiation of corrosion.
Influence of the applied anodic and cathodic potentials on the filiform corrosion of Mg–3Zn alloy
In order to further confirm the effect of anodic and cathodic reactions on the filiform corrosion of Mg–3Zn alloy, current–time curves were measured under various applied potentials. Before the potentiostatic tests, the polarization curve of Mg–3Zn was measured for choosing the suitable applied potential values. According to the previous report,31 the cathodic reaction on Mg alloys is the hydrogen evolution reaction. Fig. 8 shows that the hydrogen evolution rate is diminishing with moving potential toward Ecorr. A slight passivation trend is shown in the anodic sides of the curve, which be associated with surface oxide films.3 The film breakdown potential is approximately −1.45 V vs. SCE. The applied anodic potentials of below film breakdown, −1.3 V/SCE (Ecorr + 0.15 V), and above film breakdown, −1.5 V/SCE (Ecorr + 0.35 V), were chosen according to the anodic side of the polarization curves in Fig. 8. The applied cathodic potentials were chosen according to be the same differences as the corresponding anodic applied potentials, −1.8 V/SCE (Ecorr − 0.15 V) and −2.0 V/SCE (Ecorr − 0.35 V). The four curves show a similar trend in Figs. 9a and 9b. The current densities increase rapidly at the initial stage, and then they decrease gradually. The curves with the applied anodic potentials show positive current density. A more positive applied potential gives rise to a higher anodic current density. The curves with the applied cathodic potentials show negative current densities. A more negative applied potential gives rise to a higher cathodic current density. The corrosion morphologies at various applied potentials are shown in Fig. 10. Obvious filiform corrosion can be observed at the applied anodic potentials of −1.5 V/SCE (Ecorr + 0.15 V). With increasing the applied anodic potential to −1.3 V/SCE (Ecorr + 0.35 V), filiform corrosion becomes more severe, and most of the surface is covered with corrosion filaments. However, the sample keeps intact at the applied cathodic potential of −2.0 V/SCE (Ecorr − 0.35 V). Because the surface morphology at the applied cathodic potential of −1.8 V/SCE (Ecorr − 0.15 V) is nearly the same as that at the applied cathodic potential of −2.0 V/SCE (Ecorr − 0.35 V), it is not shown again. Lunder et al.18 reported the positive current densities for AZ91–T4 at the applied anodic potential and filiform corrosion is observed on the surface, which is in agreement with our work. This result indicates that enhancement of anodic reaction can accelerate the filiform corrosion of Mg alloys.
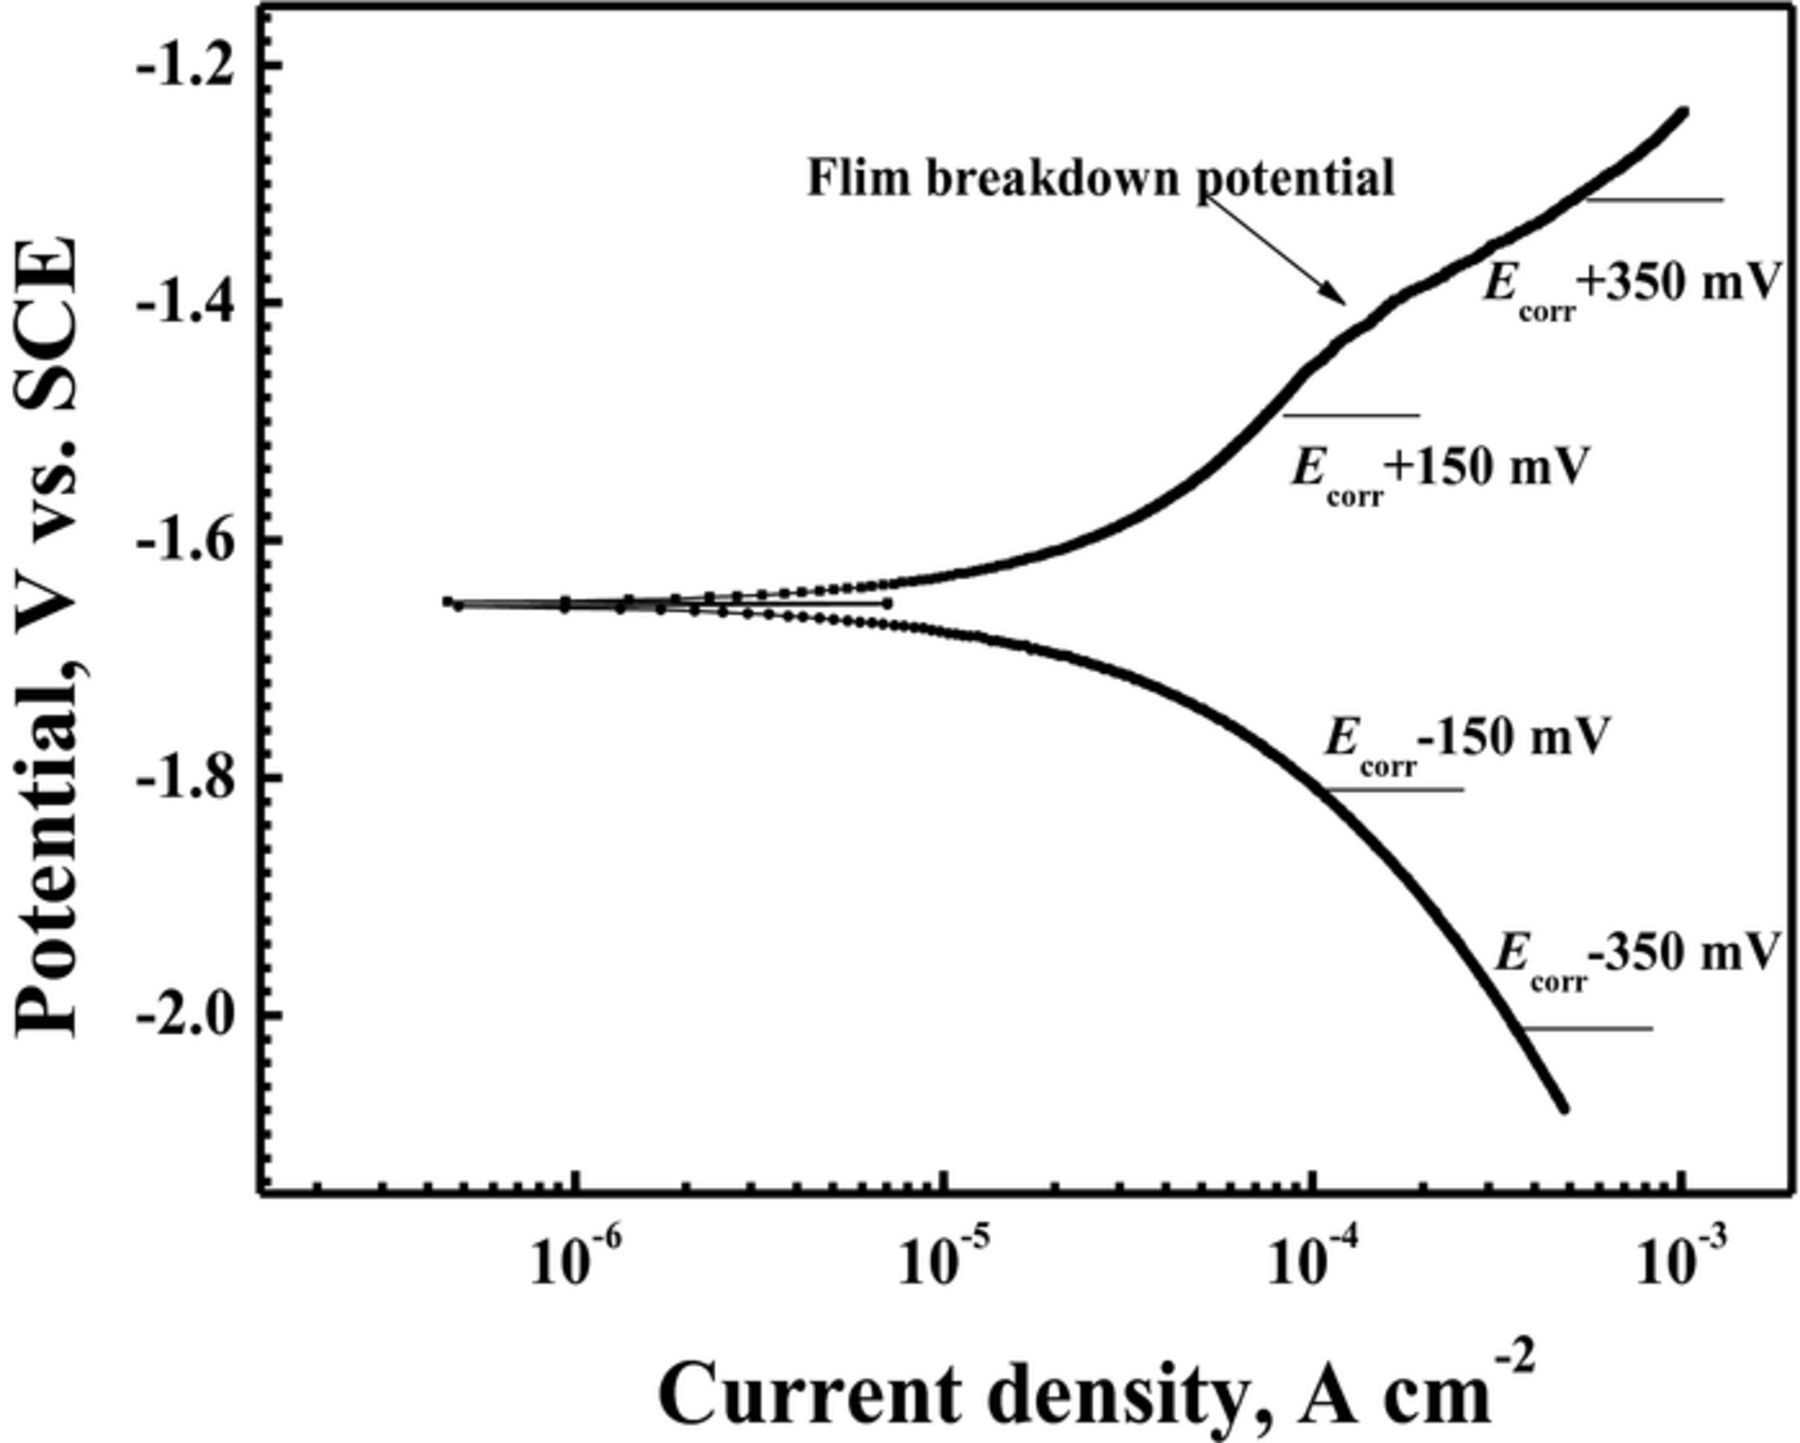
Figure 8. Polarization curve of Mg–3Zn alloy in 0.01 M NaCl solution.
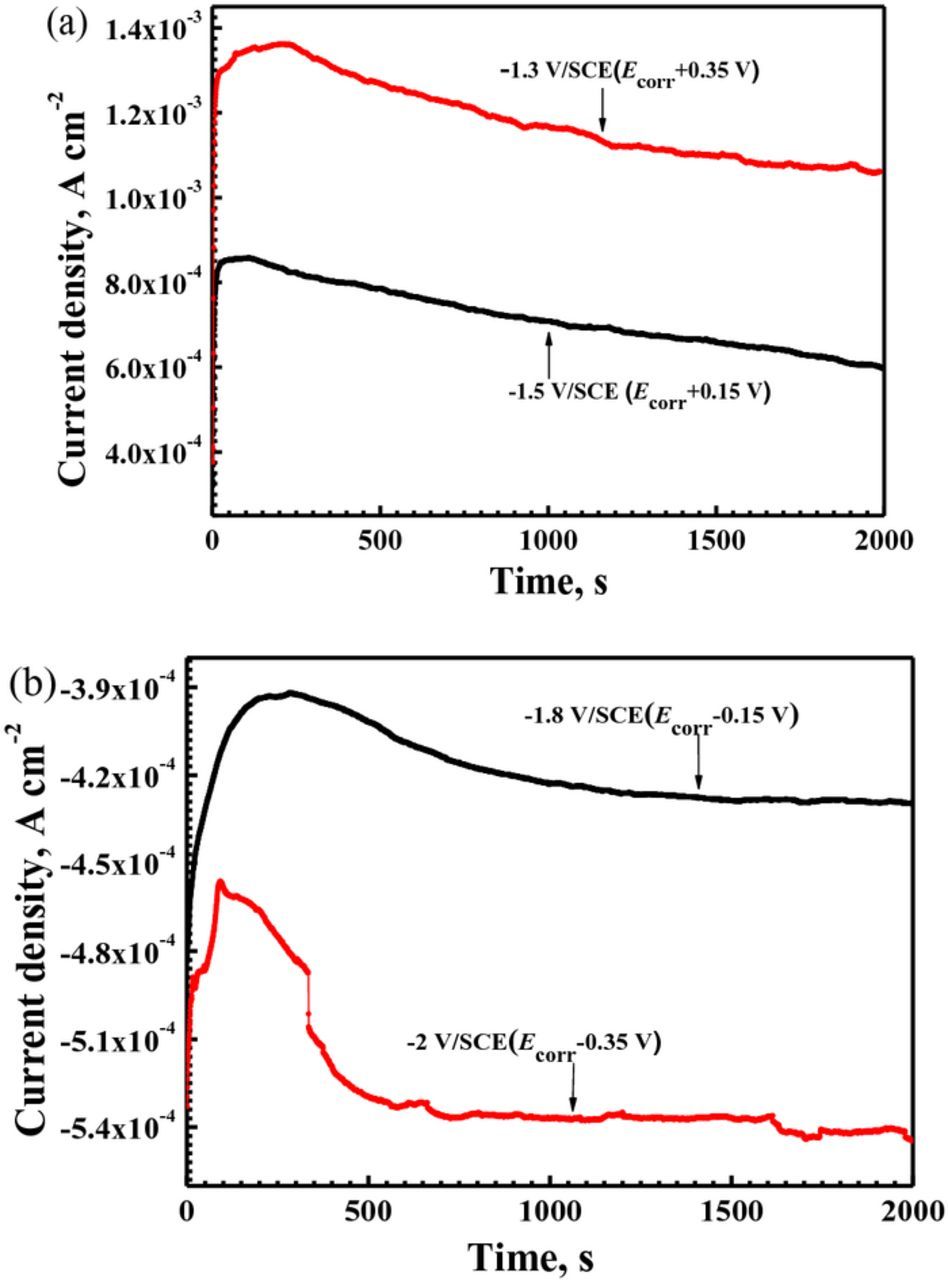
Figure 9. I–T curves of Mg–3Zn alloy immersed in 0.01 M NaCl solution with various applied potentials: (a) anodic applied potentials; and (b) cathodic applied potentials.
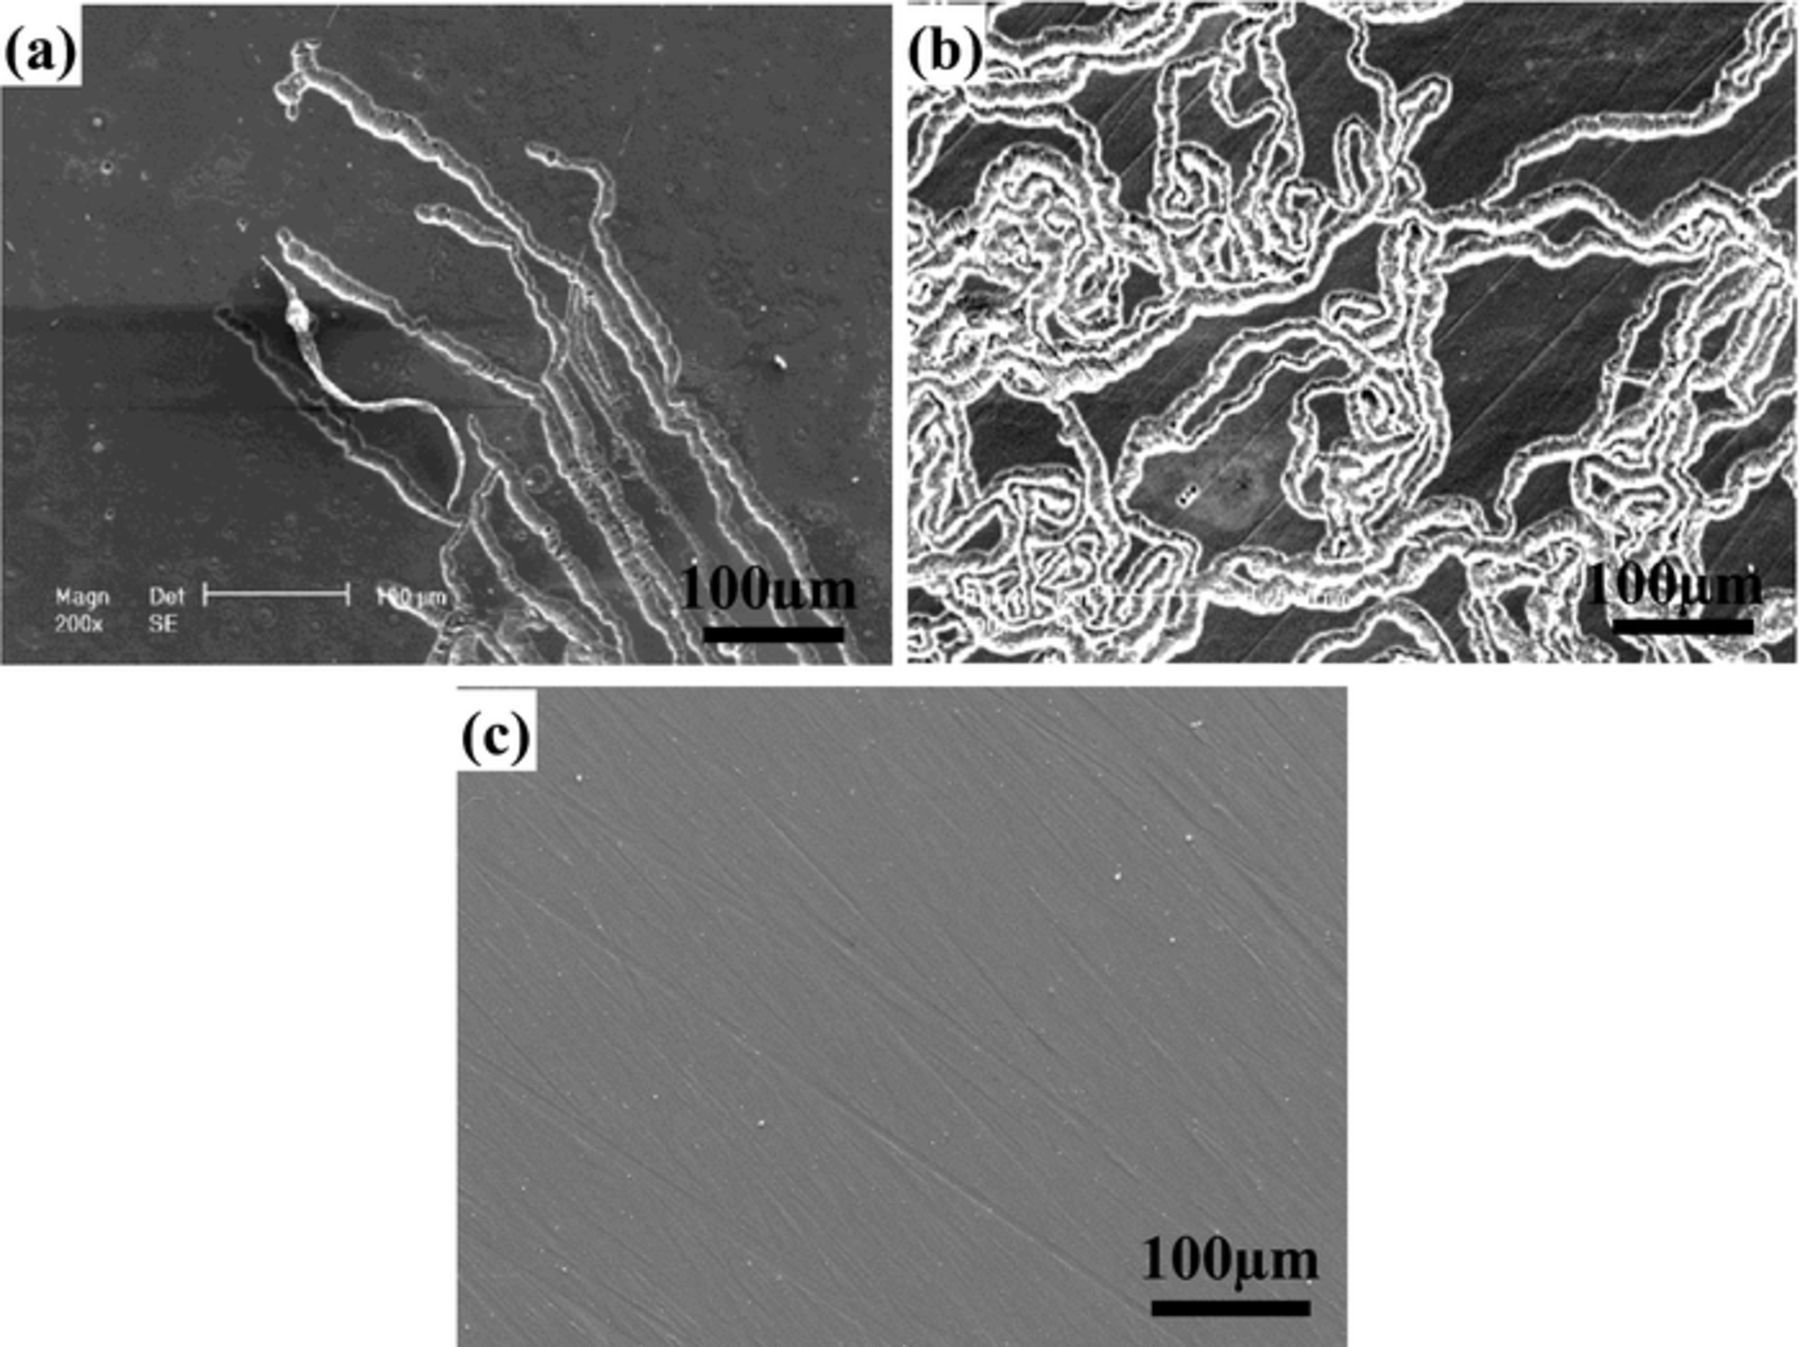
Figure 10. Corrosion morphologies of Mg–3Zn alloy with various applied potentials in 0.01 M NaCl solution: (a) −1.5 V/SCE (Ecorr + 0.15 V); (b) −1.3 V/SCE (Ecorr + 0.35 V); and (c) −2 V/SCE (Ecorr − 0.35 V).
Overall, filiform corrosion is prone to occur on Mg alloys containing fine precipitation phases. The obstruction by grain boundaries and fine precipitation phases is weaker than the driving force of corrosion filament propagation. The microstructure of Mg–3Zn alloy has not effect on the development direction of corrosion filaments. The corrosive mediums play key roles in the filiform corrosion of Mg alloys. A small amount of Na2SO4 and NaF addition to the NaCl solution can prolong the initiation time and lower the propagation rate of corrosion filaments. This can be attributed to the improvement of surface films. When the concentration of NaF is much beyond the NaCl, the passive effect of F− controls the corrosion process, namely, formation of passivation film instead of damage. When the concentration of Na2SO4 is much beyond the NaCl, the weak attack effect of SO42− controls the corrosion process, namely, formation of pitting corrosion instead of filiform corrosion. The different corrosion forms of Mg–3Zn alloy in NaCl and Na2SO4 are greatly associated with the compactness of corrosion product films and the enrichment sites of Cl− and SO42−.
According to the SVET in situ minoring of filiform corrosion in NaCl solution, the propagation of corrosion filament is driven by the dynamic expansion of corrosion microcells. The front end of corrosion filament (named as filament head) presents strong net anodic current density, which is in agreement with the current measured on Mg–3Zn alloy with the applied anodic potentials. It indicates that the growth of filiform corrosion can be accelerated by anodic reaction. The corrosion products behind the filament head exhibit net cathodic current density, and they are even inert than the regions in the absence of corrosion. The enhancement of cathodic reactions by the applied cathodic potentials cannot accelerate the filiform corrosion of Mg alloys based on surface morphology in Fig. 10c. Thus, the depression of anodic reactions is a beneficial method for improving the filiform corrosion–resistant ability of Mg alloys.
Conclusions
- (1)Corrosion filaments can cross grain boundaries to develop continually instead of terminating at the precipitation phases. The development of filiform corrosion is greatly associated with the existence of Cl− in the corrosive solutions. Addition of NaF and Na2SO4 into the NaCl solution can delay the initiation of corrosion, even change the corrosion forms.
- (2)The in situ observation by SVET confirms that the corrosion microcells change dynamically with the growth of corrosion filaments. Serious filiform corrosion is observed at the applied anodic potentials while corrosion is not observed at the applied cathodic potentials. The propagation of corrosion filaments is accelerated by anodic reaction. The depression of anodic reactions is beneficial method for improving the filiform corrosion–resistant ability of Mg alloys
Acknowledgments
This work was supported by the National Natural Science Foundation of China. (No. 51471174); and the National Key Research and Development Program of China (No. 2016 YFB0301105); the National Key Basic Research Program of China (No. 2013CB632205).