
Abstract
Herein, we demonstrate the fabrication of Ti3C2Tx MXene films using electrophoretic deposition (EPD). A systematic study under constant voltage conditions from aqueous and propylene carbonate-based suspensions was performed to investigate the effects of the EPD process parameters on film morphology, flake orientation, and functional properties. From measured suspension properties, the kinetics of deposition from both suspension media were successfully described by the well-established Sarkar model of EPD. Remarkably, EPD-processed films have electrical conductivities of 7400 S/cm, on par with the highest values reported in the literature for Ti3C2Tx MXene. When employed as electrochemical capacitor electrodes in 1 M H2SO4, the capacitances were comparable to literature values. Given the process scalability and the morphological control that is possible, these results bode well for EPD as a fast, high-throughput method for making MXene films.

This is an open access article distributed under the terms of the Creative Commons Attribution Non-Commercial No Derivatives 4.0 License (CC BY-NC-ND, http://creativecommons.org/licenses/by-nc-nd/4.0/), which permits non-commercial reuse, distribution, and reproduction in any medium, provided the original work is not changed in any way and is properly cited. For permission for commercial reuse, please email: oa@electrochem.org.
Electrophoretic deposition (EPD) is a process wherein an electric field is applied to a stable colloidal suspension in between two electrodes.1 As a consequence, two distinct processes occur, as shown in Figure 1a: (1) charged particles in the colloid move toward the electrode of opposite polarity to that of the particles’ surface charge (electrophoresis) and, (2) a solid deposit is formed by coagulation at the suspension-electrode interface (deposition). This technique is well-studied and successfully implemented for high-throughput production of dense, void-free ceramic structures ranging from thin coatings to bulk layers several centimeters thick.2 Because of the flexibility and scalability of the deposition apparatus (e.g. power sources and size/shape of deposition electrodes and cell), fast deposition rates, and excellent microstructural control compared to other processing methods, EPD has been used for commercial-scale production of various engineering and traditional ceramics.2–4 In recent years, EPD has also become a versatile technique for making monolithic films and nanocomposites of two-dimensional (2D) materials – such as graphene, transition metal dichalcogenides, and layered transition metal oxides5–10 – due to advances in colloidal processing.
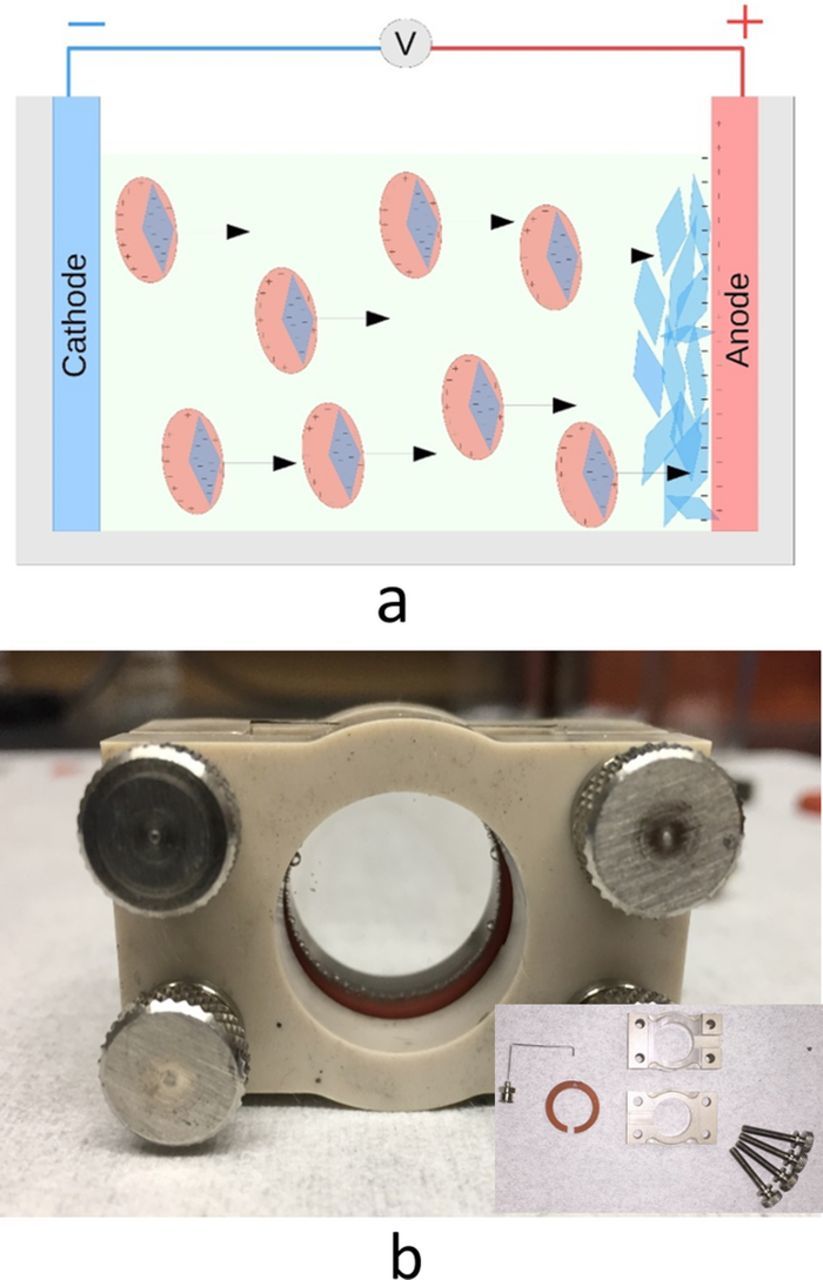
Figure 1. (a) Schematic of electrophoretic deposition process, and (b) photograph of cell used for electrophoretic deposition; inset the same cell disassembled.
Recently, we discovered a new family of two-dimensional (2D) early transition metal carbides and nitrides, that we labeled MXene, because they are derived from the MAX phases and share properties similar to graphene.11,12 The MAX phase composition is Mn+1AXn, where M is an early transition metal, A is an A-group element (mostly group 13 and 14 elements), X is carbon and/or nitrogen, and n = 1 to 3. The exfoliation process is carried out by selectively etching away the ‘A’ layers by hydrofluoric acid (HF) alone or by hydrochloric acid (HCl) combined with pre-dissolved fluoride salts.13–16 The resulting material consists of loosely bonded layers of Mn+1XnTx, where T represents surface functionalization by -OH, -F and/or -O groups,17–19 that can subsequently be delaminated via sonication into 3, 5, or 7-atom thick 2D flakes, depending on the value of n.14,20,21 MXenes - of which more than 20 varying compositions have been synthesized to date,11,12,22–26 - possess a unique combination of high electrical conductivities and hydrophilicity. They are thus being explored for a host of applications, such as electrodes for energy storage,14,27–29 transparent conductive coatings,13,30,31 water purification,32–34 and electromagnetic interference shielding,35,36 among others.37
MXenes form stable colloids in a range of polar solvents due to their high, negative zeta potential,14,38–40 which is most likely due to deprotonated hydroxyl surface terminating groups. These colloidal dispersions have been shown to consist of individual and few-layer MXene sheets.14 To date, it has been demonstrated that MXene solids can be assembled from colloids by vacuum filtration,38 spin-coating,30,41 spray coating,31 spray drying,40 and electrospraying.42 Herein we explored EPD as a high-throughput synthesis route for MXene films. During preparation of this manuscript, a report of non-aqueous EPD of Ti3C2Tx was published.43 In this work, we successfully fabricate freestanding Ti3C2Tx films by EPD from water-based and propylene carbonate, PC, based colloidal Ti3C2Tx suspensions. A systematic constant-voltage deposition study is conducted and compared to simple models, and the dependence of film morphology, flake orientation, and electrical/electrochemical properties on EPD processing parameters is explored.
Materials and Methods
Synthesis of Ti3AlC2
Titanium aluminum carbide 312 MAX phase powders (Ti3AlC2) were synthesized according to previous reports.14 Briefly, commercial MAXTHAL powders (Kanthal, Sweden), consisting primarily of Ti2AlC as the majority phase with ca. 30 wt% Ti3AlC2 impurities, were mixed with titanium carbide, TiC (99%, Alfa Aesar), in a 1:1 molar ratio, based on the Ti2AlC content in MAXTHAL powders. The reactants were mixed for 24 h in a high-density polyethylene jar with zirconia milling balls, loosely packed into an alumina boat, and sintered under continuous Ar gas flow in an alumina tube. The powders were heated at a rate of 5°C/min to a temperature of 1350°C, held at this temperature for 2 h, and then furnace cooled to room temperature. The resulting loosely sintered Ti3AlC2 brick was ground into a fine powder with a titanium nitride milling bit and sieved to obtain powders with a particle size <38 μm to be used for Ti3C2Tx MXene synthesis.
Synthesis and optimization of Ti3C2Tx MXene and colloidal Ti3C2Tx suspensions
Two grams of Ti3AlC2 powders were then slowly added over the course of 2 minutes into a pre-mixed solution 20 mL of stock (∼11.7 M) HCl (Fisher, Technical Grade), and 1.32 g of lithium fluoride, LiF, (Alfa Aesar, 98.5% purity) in order to obtain a molar ratio 5:1 of salt to MAX phase. The powders were stirred with a magnetic stir bar for 24, 72, or 144 h at 35°C. The temperature was maintained using an oil bath. The highest efficiency, judged by Al removal, as measured by EDS, was found after the powder was etched for 72 h. Etching for 144 h did not seem to result in appreciably greater yields of dispersed MXene in subsequent steps. As a rule of thumb, at least one day of etching was required to produce sufficient amounts of MXene needed for delamination. Figure 2a shows diffractograms for MXene powders etched for 24, 72, and 144 h and that of the parent Ti3AlC2. After 24 h of etching, the MAX phase peaks (in light blue) are largely diminished. With longer times, not only do those peaks progressively disappear, but those belonging to MXene increase in intensity. Note that the peak near 61° corresponds to the MXene (110) non-basal plane. Its presence indicates the presence of multilayers.
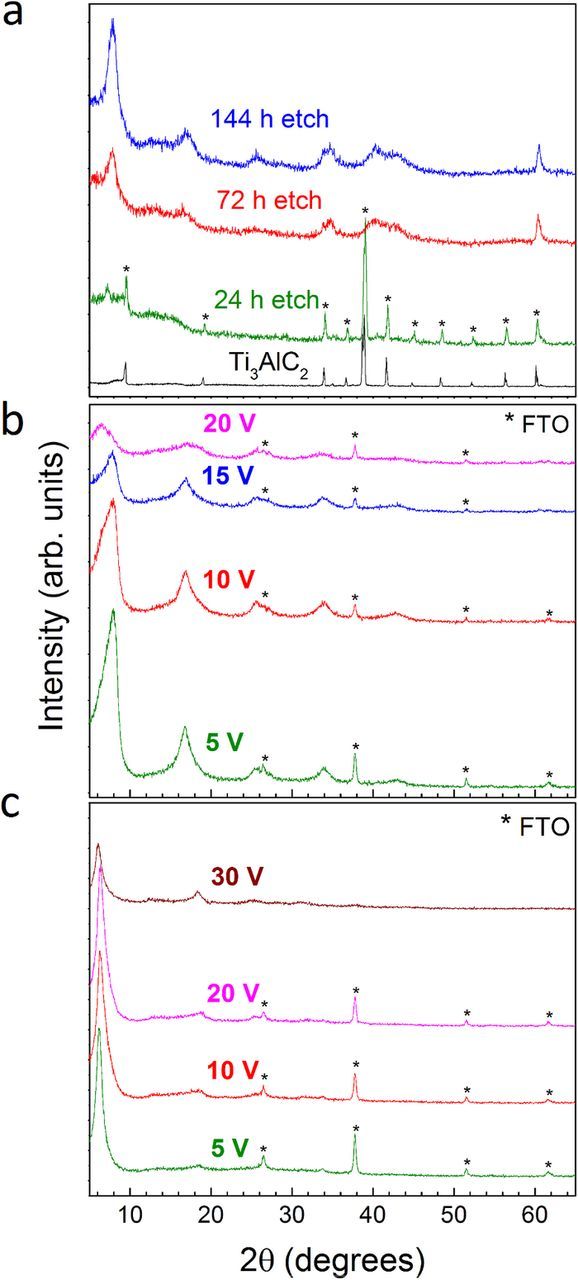
Figure 2. XRD of (a) as-synthesized Ti3AlC2 and Ti3C2Tx multi-layered powders after 24 h, 72 h, and 144 h of etching, (b) Ti3C2Tx films on FTO substrate after EPD from aqueous suspensions for 120 s at 5, 10, 15, and 20 V and drying in air, and (c) Ti3C2Tx films on FTO substrate after EPD from PC suspensions for 120 s at 5, 10, 20, and 30 V and vacuum annealing.
Next, the resulting black sediments were washed identically via several cycles of distilled water, consisting of 2 min centrifugation at 3500 rpm (2300 rcf) and decantation of the supernatant. The washing cycles were stopped once the supernatant after centrifugation remained dark, which typically occurred after the supernatant achieved a pH > 5. Afterwards, the sediment was separated from excess water via vacuum filtration and allowed to air dry for several hours more at ≈30% relative humidity, until the weight of the partially wet powder was in the range 2.3–2.5 g. Herein two different solvents, water and propylene carbonate (PC, Alfa Aesar, 99%) were used to prepare colloidal suspensions.
For the aqueous solution, the still-damp sediment was re-dispersed in 50 mL of distilled water and sonicated for 1 h in a glass jar under continuous Ar gas bubbling. Overheating of the bath sonicator water was prevented by cooling it with ice. The sonicated suspension was then centrifuged for 1 h at 3500 rpm (2300 rcf) to allow larger particles to sediment. The resulting supernatant was used for EPD without further preparation. This process produced concentrations in the 5–13 mg/mL range.
For preparing colloidal suspensions of Ti3C2Tx in PC, the still-damp MXene powder was poured in a glass container along with the solvent, according to a ratio of 1 g of MXene per 30 mL of PC. In general, an improvement of the delaminated flakes dispersion in PC resulted when a semi-dry sediment was ground gently with a mortar and pestle before being added to the solvent. After several trials the correct weight % of water retained in the sediment needed to maximize the suspension concentration in the PC appeared to be around 25% of the MXene powder, (assuming, roughly a mass conversion of 1:1 between Ti3AlC2 and Ti3C2Tx). The slurry was magnetically stirred for 5 d and vigorously shaken by hand once a day. On occasions where the samples were over or under dried prior to the addition of PC, they were not adequately dispersed, requiring additional sonication for 1 h under Ar atmosphere. In all cases, the resulting dispersion was finally centrifuged for 10 minutes at 3500 rpm (2300 rcf) and the supernatant was pipetted into a new container, constituting the working solution for subsequent EPD experiments. Concentrations, up to 13 mg/mL were achieved.
Electrophoretic deposition (EPD)
The EPD was conducted using a custom cell consisting of parallel fluorinated tin oxide (FTO) conductive glass electrodes, a silicone gasket (3 mm thick when uncompressed, and 2.7 mm when compressed into the equipment), and clamps, as shown in Figure 1b. The gasket used contained a space on top of the fully constructed cell to fill the cell with colloidal Ti3C2Tx and a syringe to evacuate the residual solvent after deposition. Electric fields were applied using an Agilent E3616A DC Power Supply. The DC current was measured at 1 s intervals, with a Hewlett-Packard 34401A Multimeter.
First, square FTO glass substrates (Hartford Glass Co.), 1.6 mm thick and lateral dimensions of 25 × 25 mm, were cleaned by washing in an upright sample holder with 10% Hellmanex III (Hellma) solution. The substrates were then washed in de-ionized water three times and ethanol (200 Proof, Decon Laboratories, King of Prussia, PA) three times (all steps performed in an ultrasonic bath). The substrates were then removed with clean tweezers and blasted dry with a nitrogen gas gun before placing them in the EPD apparatus. The fully constructed cell was filled with 0.7 mL of the colloidal Ti3C2Tx suspension. For the water-based suspensions, constant voltages of 1 to 25 V were applied for up to 10 min. For the PC-based suspensions, 1 to 30 V were applied for times up to 10 min. In another set of experiments, deposition of aqueous suspensions was conducted at a constant current density of 2.3 mA/cm2. After deposition, the voltage was held constant for a few seconds while the excess solution was evacuated from the bottom of the cell with a syringe fitted with a stainless steel needle. The glass substrates were carefully removed taking care not to disturb the deposited mass and were either air dried or dried in a vacuum oven. Free-standing MXene films were easily detached from the electrode after drying.
Because of PC's high boiling point (242°C), the as-deposited films had excess solvent that could not be removed by passive drying at room temperature and needed to be heated under mechanical vacuum (<20 Pa) to obtain freestanding films. Several annealing temperatures were tried, and ultimately 35°C under vacuum sufficiently dried the sample to allow easy film detachment from the substrates. Nonetheless, mass measurements showed that 160°C for at least 12 h was required to reach a final stable mass where presumably all the PC was either expelled or reacted with the sample.
Characterization
X-ray diffraction (XRD) was conducted on a powder diffractometer (Rigaku SmartLab) in the 3–65° 2θ range using a step size of 0.02 or 0.04° and dwell time of 0.7 s per step. Scanning electron microscopy (Zeiss Supra50VP) was also used. Energy dispersive X-ray spectroscopy (EDS), using 20 s scans at 15 kV SEM accelerating voltage, were conducted on dried, freestanding MXene films on a Zeiss Supra 50VP microscope equipped with an Oxford EDS system. Optical profilometry was conducted with a Zygo Newview 6000 using the 10X objective at a working distance of 7.4 mm. Film weights were collected with a calibrated balance, accurate to +/− 0.1 mg.
Electrical resistivity measurements were performed on freestanding MXene films in a nitrogen-filled glove-box (<60 ppm O2) using a Keithley 2634B SYSTEM Sourcemeter in a linear 4-point probe configuration. The reported resistivity values represent the average from three measurements per film using the method reported by Smits.44 The errors reported are associated with the standard deviation in the three measurements and variations in film thickness.
Phase Analysis Light Scattering was used to measure electrophoretic mobility of MXene flakes, which in turn provided the zeta potential. Based on the solvent used, colloidal suspensions were diluted either in DI water or PC and measured using a Brookhaven NanoBrook Omni employing a bias of 4 V, alternating at 2 Hz.
Electrochemical testing in supercapacitors
Free-standing Ti3C2Tx films produced by EPD and vacuum filtration (thickness ≈2–3 μm, mass loadings 0.8–1.2 mg/cm2) were assembled into three-electrode Swagelok cells as working electrodes with YP-50 activated carbon (Kuraray, Japan) electrodes as overcapacitive counter electrodes, prepared according to the procedures outlined in the work by Ghidiu et al.:14 The reference electrode used was Hg/Hg2SO4 (CH Instruments). Electrochemical tests were conducted using a potentiostat/galvanostat (Bio-logic VMP3). CVs were obtained at scan rates in the 2 to 200 mV/s range after an initial pre-cycling of the cell 1000 times at 10 mV/s. The pre-cycling step was necessary to stabilize the CVs to a constant shape. The gravimetric capacitance values, Cm, were calculated according to:
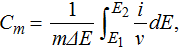
where m is the working electrode's mass, ΔE is the potential window, E1 and E2 are the potential limits, i is the measured current, and ν is the scan rate. Volumetric capacitance values were calculated by multiplying the gravimetric capacitance by the electrode's density, which was calculated based on the electrodes’ areal density and thickness (measured by SEM).
Galvanostatic cycling was conducted at a constant current corresponding to current densities of 10 A/g based on the mass of the MXene films for 10,000 cycles each. Capacitance retention values are reported as percentages of the initial 1st cycle capacitance after the aforementioned pre-cycling step.
Results and Discussion
Effect of synthesis conditions on colloidal suspension properties
Two dispersing solvents were explored: water, because it is the most well studied solvent for MXene and is a low-cost, environmentally benign option, and PC, because of it its larger electrochemical stability window. With the optimizations described above, concentrations of up to 13 mg/mL were obtainable for both water and PC.
To compare the characteristics of our EPD films with more traditionally fabricated films, aliquots of both the aqueous and PC suspensions of delaminated MXenes were vacuum filtered to obtain free standing films. The latter were then dried, and characterized with EDS (discussed below). The colloidal suspensions were furthermore characterized through dynamic light scattering to obtain information about both the electrophoretic mobility and concomitant zeta potential. The electrophoretic mobility, μ, of MXene in water was −3.0·10−8 m2/(V·s), whereas in PC it was −0.96·10−8 m2/(V·s). The differences between these values can be almost entirely accounted for by the relative viscosity of the two solvents, assuming a similar surface potential in both cases. Under a very simplistic model, applying the Smoluchowski equation and assuming spherical particles, approximate zeta potentials can be estimated of −58 ± 3 mV and −61 ± 3 mV, for water and PC respectively, in agreement with previously reported measurements on colloidal Ti3C2Tx suspensions.45,46
General film characteristics
At first, EPD from aqueous suspensions was performed under constant-voltage conditions at 5, 10, 15, 20 and 25 V for 600 s each. Initially, the deposition current decreased exponentially for all voltages. However, with continued deposition beyond 20–40 s at 10 V or above, the currents increased briefly before decreasing again, as shown in Figure 3a. Not surprisingly, vigorous bubbling occurred in the EPD cell above 5 V due to the high overpotential for hydrolysis, though light bubbling was also observed even at 5 V. Below 3 V, little to no deposition occurs. Given the high zeta potential of MXene flakes, it is likely that electrophoresis is occurring at these low voltages, yet the electric field is insufficient to overcome interparticle repulsion in order to form a solid deposit.8
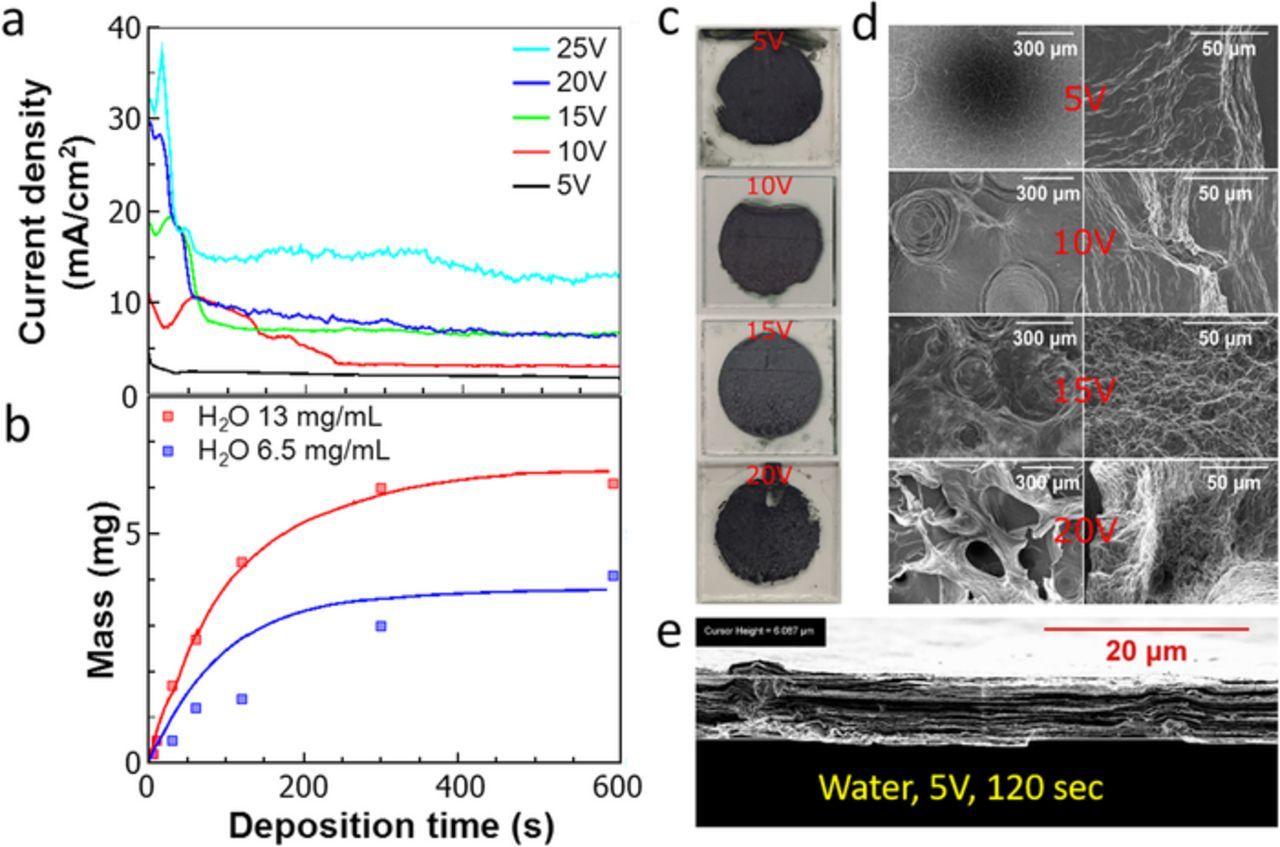
Figure 3. Constant-voltage EPD from aqueous suspensions: (a) time dependence of deposition current density at different voltages, (b) deposited mass as function of deposition time, (c) photographs of films after drying in air, (d) surface morphology after each voltage at low (left) and high (right) magnifications, (e) representative film cross-section.
Photographs of the films after air-drying are shown in Figure 3c. Surface micrographs in Figure 3d show increasing surface roughness, film inhomogeneity, and occurrence of macropores with increasing voltage, but very tightly stacked flakes are still observed in the cross-sectional micrograph for samples fabricated at 5 V (Figure 3e). The presence of macropores with diameters on the order of several hundred micrometers coincides with vigorous hydrolysis at voltages > 5 V. XRD of air-dried films (Figure 2b) also shows that the intensity of the basal (00l) peaks, which serves as an indicator of the degree of alignment of the basal plane with the substrate, is quite high at low voltage, but reduces monotonically as the voltage is increased beyond 5 V. The interpretation of this observation is that the increasing gas evolution above 5 V likely disrupts the oriented deposition of the flakes, which otherwise occurs parallel to the electrode at lower voltages. At most voltages, aqueous EPD films had c lattice parameters (c-LP) of 22–23 Å, whereas values ranging from 25–30 Å have been reported in literature for Ti3C2Tx films made by other methods from aqueous suspensions.30,34,46 The reasons for the lower c-LP of these EPD-processed films and asymmetry in the shape of the (002) basal peaks are not clear at this time but could be the result of water being forced out from between the flakes as they come together to form a deposit.
Stable deposition at higher voltages required using colloidal Ti3C2Tx suspensions in PC because PC is resistant to electrolysis over a wider voltage range than water.47 A constant-voltage EPD study was performed on colloidal suspensions in PC at different voltages up to 30 V. Figure 4a shows the time evolution of the deposition current density as a function of voltage. As with the aqueous suspensions, the deposition current density initially decreased. However, at 10 V or higher, a broad, transient increase in current was observed starting around 100–200 s, suggesting a small contribution from electrochemical side reactions. As expected, no bubbling was observed in the suspension at any of the voltages used, in contrast to the aqueous suspensions.
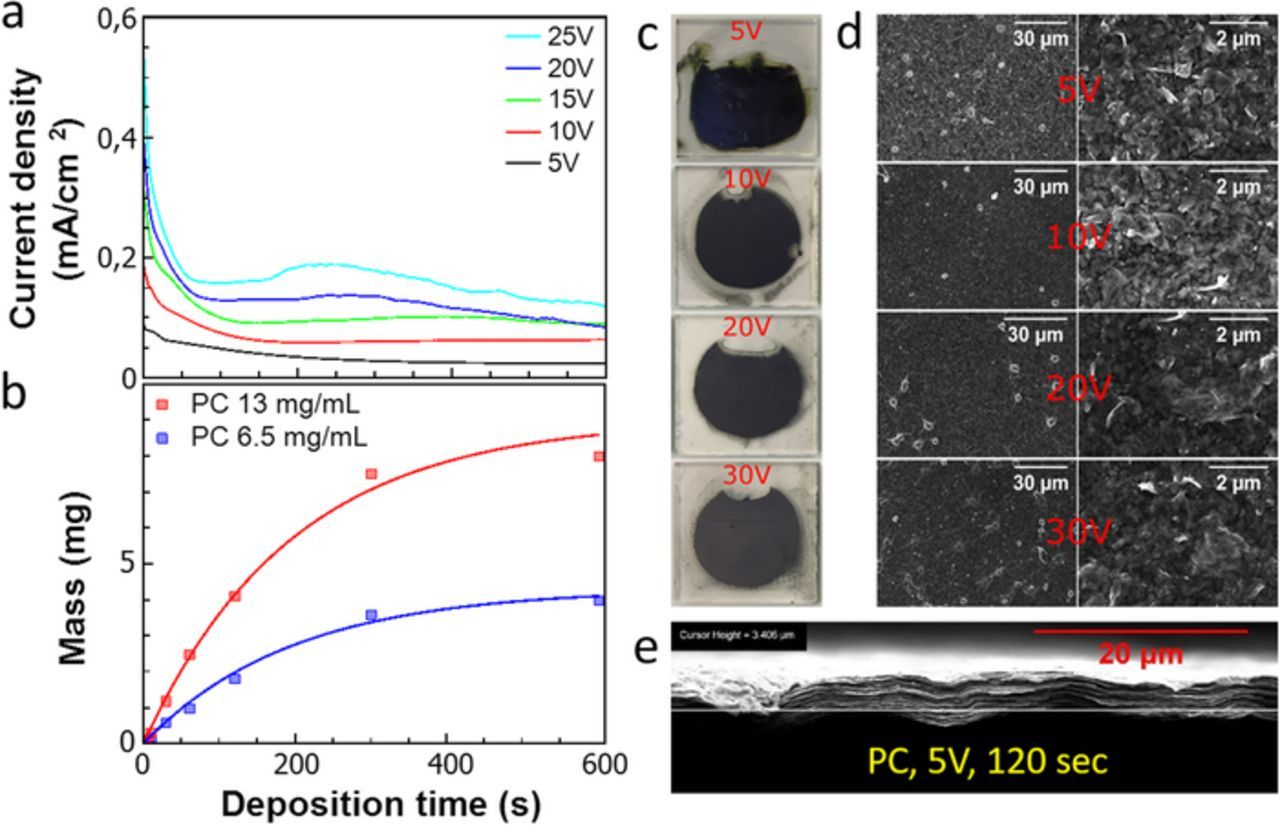
Figure 4. Constant-voltage EPD from PC suspensions: (a) time dependence of deposition current density at different voltages, (b) deposited mass as function of deposition time, (c) photographs of films after vacuum annealing at 160°C, (d) surface morphology after each voltage at low (left) and high (right) magnifications, (e) representative film cross-section.
Photographs of films after deposition from PC and vacuum annealing are shown Figure 4c. In contrast to aqueous deposition, micrographs of film surfaces deposited from PC showed the absence of macroscopic defects even at high voltage and little difference in morphology as a function of voltage (compare Figures 3d and 4d). The films' cross-sections showed tightly stacked flakes (Figure 4e) similar to vacuum-filtered films reported in the literature.20 The insensitivity of the films' morphologies and flake orientations to the applied voltages is confirmed by XRD, which shows strong basal peak reflections at all voltages with only a slight decrease in the (002) intensity at 30 V (Figure 2c). For all voltages used, the c-LPs of the dried PC-deposited films ranged from 28.5 to 29.2 Å. These values were significantly greater than those of the water-deposited EPD films. Moreover, these values match well with the 29.6 Å value of vacuum-filtered (VF) and annealed films from the same PC suspension. Given that much larger values of c-LP are measured on as-synthesized Ti3C2Tx powders (Figure S3), PC does not seem to be intercalated in the interlayer space after vacuum annealing of PC-deposited films.
To shed more light on the kinetics of film deposition, a series of depositions were carried out at a constant current density of 2.3 mA/cm2. Photos of the films after various deposition times and a representative XRD of a film after 300 s of deposition and drying are shown in Figure S1a and Figure S1b, respectively. The XRD shows strong basal (00l) reflections similar to other aqueous deposited films with a c-LP of 27.0 Å. The mass yield as a function of deposition time is also shown in Figure S2, the kinetics of which are discussed in a later section.
The chemical compositions of the films made by different methods, were determined by EDS on air-dried Ti3C2 films made by EPD and vacuum filtration from both PC and water. As shown in Table I, both water-based films show a 3.0:2.2 molar ratio of Ti:C, which is close to the ideal ratio of 3:2, and very similar values of O, F, and Cl. These results suggest that the EPD process largely did not influence the chemical composition of the water-EPD films. On the other hand, the relative C content in the PC-based films after vacuum annealing at 160°C is well above that of the water-processed films. This could be due to residual PC in the films, despite the vacuum annealing. It should be noted that Cl is probably present as one of the possible surface terminations that can result when LiF-HCl etching is used to make MXenes.48
Table I. EDS results of relative elemental compositions, normalized per 3 Ti, of air-dried water-deposited films and PC-deposited films vacuum annealed at 160°C.
| Ti | C | O | F | Cl | |
|---|---|---|---|---|---|
| VF (water) | 3.0 | 2.2 | 0.7 | 1.2 | 0.4 |
| EPD (5 V water) | 3.0 | 2.2 | 0.7 | 1.0 | 0.2 |
| VF (PC) | 3.0 | 3.3 | 0.8 | 1.4 | 0.4 |
| EPD (5 V, PC) | 3.0 | 3.1 | 0.8 | 1.0 | 0.4 |
| EPD (10 V, PC) | 3.0 | 2.9 | 0.8 | 1.4 | 0.4 |
| EPD (15 V, PC) | 3.0 | 2.8 | 0.7 | 0.8 | 0.4 |
| EPD (20 V, PC) | 3.0 | 3.4 | 1.0 | 1.3 | 0.4 |
| EPD (25 V, PC) | 3.0 | 3.7 | 1.4 | 1.3 | 0.4 |
Kinetics of deposition
Considering the diverse benefits shown by EPD of MXene, understanding the deposition kinetics in terms of deposition rate (and subsequently thickness) is fundamentally and technologically crucial. In this work, the kinetics of constant-voltage deposition at 5 V were studied for both aqueous and PC suspensions by measuring the mass of dried films as a function of deposition time and suspension concentration. For aqueous depositions, the total deposited mass trends asymptotically toward a maximum value that is approximately proportional to the initial concentration of MXene in the suspension (Figure 3b). The same figure also demonstrates deposition yield for concentrated suspensions compared to half-diluted suspensions under nominally identical deposition conditions. Interestingly, even after the longest deposition times, the suspension was not fully depleted of Ti3C2Tx, by visual inspection.
An identical study was performed on PC suspensions at approximately equivalent concentrations as the aqueous case and with identical deposition process parameters. The mass yield with time showed a similar behavior to that observed for the aqueous system (Figure 4b), however, with the key difference that the MXene was visibly depleted by the end of 600 s, and even earlier, resulting in a nearly clear PC suspension. Photographs of EPD films from both solvents as a function of time are shown in Figure S2a-d, and the corresponding film thicknesses are plotted in Figure S2e. For PC suspensions, the deposited mass and film thickness were also measured as a function of voltage for a fixed deposition time, as shown in Figures 5a–5b. In this case, the deposited mass shows a linear dependence on voltage, similar to what was reported for EPD of the dichalcogenide, MoS2, from non-aqueous suspensions.5
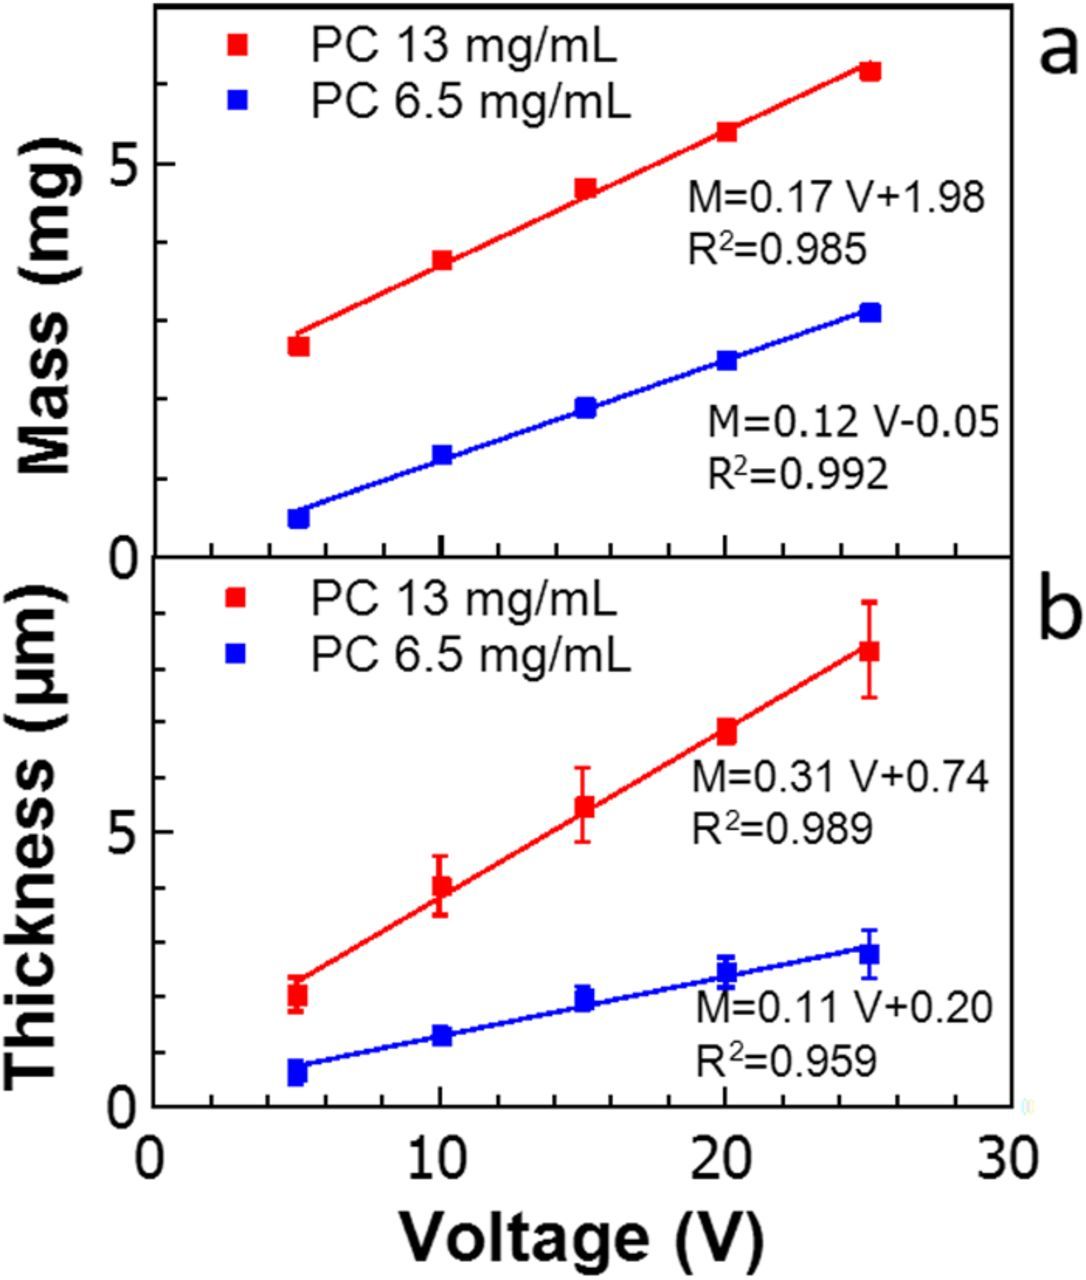
Figure 5. EPD as a function of voltage for fixed 30 s depositions from PC suspensions showing (a) deposited mass and (b) film thickness after vacuum annealing at 160°C.
Deposition kinetics are often modeled using Hamaker's equation, viz.:1

where w is the mass (in mg), f is the efficiency of the process (f ≤ 1), μ is the electrophoretic mobility (m2/(V·s)), E is the electric field (V/m), A is the electrode surface area (m2), C is the particle mass concentration (mg/m3), and t is the deposition time (s).2,49 For short deposition times, C and E can be assumed to be constant, which leads to a linear dependence of w on t. For longer deposition times, under constant-current conditions, systems (including ours) deviate from this linearity due to the rapid decay in suspended particle concentration. Thus, the following equation was suggested by Sarkar et al. to describe the kinetics:2


where w0 is the total available dispersed mass in suspension (mg), u is the average velocity of the particles (m/s) and V is the volume of the suspension used (m3).
However, in a constant-voltage deposition process it is necessary to find a value of k that accounts for the current decrease due to the resistance of the forming deposit when the solution resistance is remarkably less than that of the deposit, as usually happens if non-conductive ceramic nanoparticles are used. According to previous studies,2 we adjusted Eq. 2 by multiplying the exponential argument by a factor IN which is a normalized value of the current – defined as I(t)/Imax and determined from Figures 3a and 4a – measured throughout the process. With this correction and assuming f = 1, it was possible to fit, with good approximation, the two sets of experimental film masses collected from diluted and concentrated aqueous suspensions, as shown by the solid curves in Figure 3b.
To check the robustness of this model, we used it to fit a constant current experiment, as shown in Figure S1c. For a solid content of 6.5 mg/mL, the constant current experimental data points (Figure S1) were well fit by the model (solid line in Figure S1c) given by Eq. 2. Therefore, for an aqueous suspension, the simple theory was consistent with the experimental observations: an exponential trend for deposited mass was predicted under constant current conditions, while constant voltage conditions were well described by taking into account the electric field shielding caused by the growing deposit by simply incorporating the measured current.
However, this approach was not appropriate for modeling the deposition kinetics of the films made starting with the PC suspensions under constant voltage conditions. In fact, the model obtained by introducing the IN factor to account for the growing film resistance produced curves which extremely underestimated the deposit mass for all times. We refined the model by neglecting the electric field decrease across the film thickness and assumed constant-current conditions, i.e. employing Eq. 2 without further changes. The physical foundation for neglecting this factor in the case of PC solutions is developed below, however we first note that, with this choice, the agreement between predicted behavior and real measurements was quite good (compare solid lines and data points in Figure 4b). A possible explanation to this surprisingly simple model was proposed by Van der Biest et al.,50 who described various resistances encountered during EPD in terms of an equivalent electric circuit generated by different contributions. When a deposit is growing from particles suspended in a colloidal suspension, the overall resistance can be depicted dividing the system in two regions, suspension and deposit, ideally connected in series. The resistance in each of these regions is then the result of parallel contributions of solvent and solid particles: mostly solvent with a small volume-fraction of particles in the suspension, and mostly solid with a small amount of entrained solvent in the deposit. For the suspension, they supposed the current is due to both the flow of individual ions present in the liquid and of powder particles surrounded by their electrical double layer, so that the resistance characterizing these two phenomena can be described as follows:
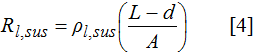
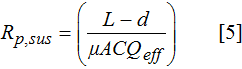
Where Rl,sus and Rp,sus are the resistance of the liquid phase in the suspension and of the charged particles in the suspension, respectively; L and A are the electrode distance and surface area; d is the deposit thickness; ρl,sus is the resistivity of the liquid phase in the suspension; μ is the electrophoretic mobility of charged particles; C is the concentration of particles; and Qeff is the effective charge on the particle surface.
Similarly, the same study explored the growing film resistance behavior, pinpointing that a deposit is constituted by a powder matrix, with a packing fraction p, completely soaked in an interconnected li-quid phase, where the individual resistance behavior can be calculated assuming:
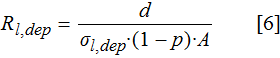
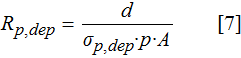
where Rl,dep and Rp,dep are the resistance of the interparticle liquid and of the powder bed, respectively; σl,dep is the specific conductivity of the liquid phase; σp,dep is the specific conductivity of the powder forming the deposit.
The terms in Eqs. 4–7 when combined into an equivalent resistance provide a tool to inspect what happens when water and PC suspensions are compared in terms of EPD kinetics. As stated above, Eq. 2 is only valid if the suspension and deposit resistances are comparable, while a correction is needed when the former is significantly more conductive than the latter. Assuming that the resistance in the portion of the equivalent circuit associated with the deposit is essentially due to the powder characteristics and that of the liquid phase is negligible given its relatively small fraction and higher resistance, it is reasonable to speculate that here the total resistance of the deposit is comparable, whether from water or PC. However, things are different in the suspension portion of the equivalent circuit, where water is not only more conductive than PC, thanks to the relative ease with which electrolytes dissociate in an aqueous environment, but also for the particle contribution, as mobility in water is approximately three times higher than what was observed for PC. Combining these two observations, it is evident that aqueous suspensions should have a lower resistance compared to PC suspensions.
Considering the total resistance due to both the suspension and the growing deposit, the low resistance aqueous system will be more influenced by the accumulation of a more resistive deposit than the PC system, where the latter's suspension resistance is so high as to render the electric field drop in the deposit completely negligible. In light of that, the modeling the kinetics of deposition from PC suspensions using Eq. 2 directly even under constant voltage conditions is explained, as well as the need to introduce the IN factor for aqueous depositions, due to the heavier contribution of the deposit resistance on the overall system electrical characteristics for the latter.
To shed even more light on what was described so far, it is meaningful to take into account the electrolysis effects occurring during aqueous depositions. Bubbling observed during the deposition demonstrated that a portion of the current was diverted from EPD by a parasitic process. The continuous out-gassing (increasing with the amount of material deposited) can be hypothesized to contribute to local erosion of the film, forcing a portion of the deposit back into the suspension. Therefore, some current would be consumed in the re-deposition of this material. Under constant voltage conditions the back flow of material might have worked as an apparent time-dependent resistance, continuously decreasing the deposition rate. In contrast, the absence of turbulence for PC suspensions would result in no increase in resistance due to such a phenomenon. The erosion/re-deposition dynamics would also explain why Ti3C2Tx was never completely depleted from aqueous suspensions, as noted above.
Electrical and electrochemical properties
The four-point DC electrical resistivity of the Ti3C2Tx films made by EPD were measured and compared to values reported for vacuum-filtered films. Films made by EPD at 5 V from aqueous suspensions had an electrical resistivity of 135 ± 10 μΩ-cm (or a conductivity of 7400 S/cm), whereas those made by EPD from PC suspensions at 5 V and 25 V had resistivities of 128 ± 23 μΩ-cm and 176 ± 19 μΩ-cm, respectively. These resistivities are among the lowest reported for Ti3C2Tx and slightly lower than those reported for highly-oriented spin-coated films,30 epitaxial thin films,13 single-flake,51 and other types of Ti3C2Tx films,52 as summarized in Table II. This proves that EPD is a high-throughput and efficient method to make highly conductive Ti3C2Tx films.
Table II. Summary of electrical resistivities obtained for Ti3C2Tx films in this work compared to the best values reported in the literature for this material.
| Ti3C2Tx Sample Type | Electrical Resistivity (μΩ-cm) | Reference |
|---|---|---|
| EPD film (5 V, water) | 135 ± 10 | This work |
| EPD (5 V, PC) | 128 ± 23 | This work |
| EPD (25 V, PC) | 176 ± 19 | This work |
| Spin-coated film | 154 ± 7 | 30 |
| 323 | 41 | |
| Epitaxial thin film | 176 ± 2 | 13 |
| Single Ti3C2Tx flake | 204 ± 44 | 51 |
| Electrosprayed film | 340 | 42 |
| Vacuum Filtered | 220 ± 10 | 52 |
Among the most promising features of Ti3C2Tx MXene is its high capacitance (up to 246 F/g, or 910 F/cm3) in sulfuric acid electrolyte.14,53 Thus, the electrochemical properties of the fabricated Ti3C2Tx films were investigated by using the films directly as electrodes for electrochemical capacitors tested in 1 M H2SO4. Figures 6a–6c show the electrode mass-normalized cyclic voltammograms of 2–3 μm-thick (0.8 – 1.2 mg/cm2) electrodes produced by vacuum filtration from aqueous suspension, EPD from aqueous suspension, and EPD from a PC suspension. Notable features in all sets of CVs are the strong dependence of the anodic peak potentials on scan rate. The peak anodic potential increases from −0.80 to −0.61 V vs. Hg/Hg2SO4 for both water-based films, but shifts to more positive range of −0.80 to −0.52 V vs. Hg/Hg2SO4 for the PC EPD film.
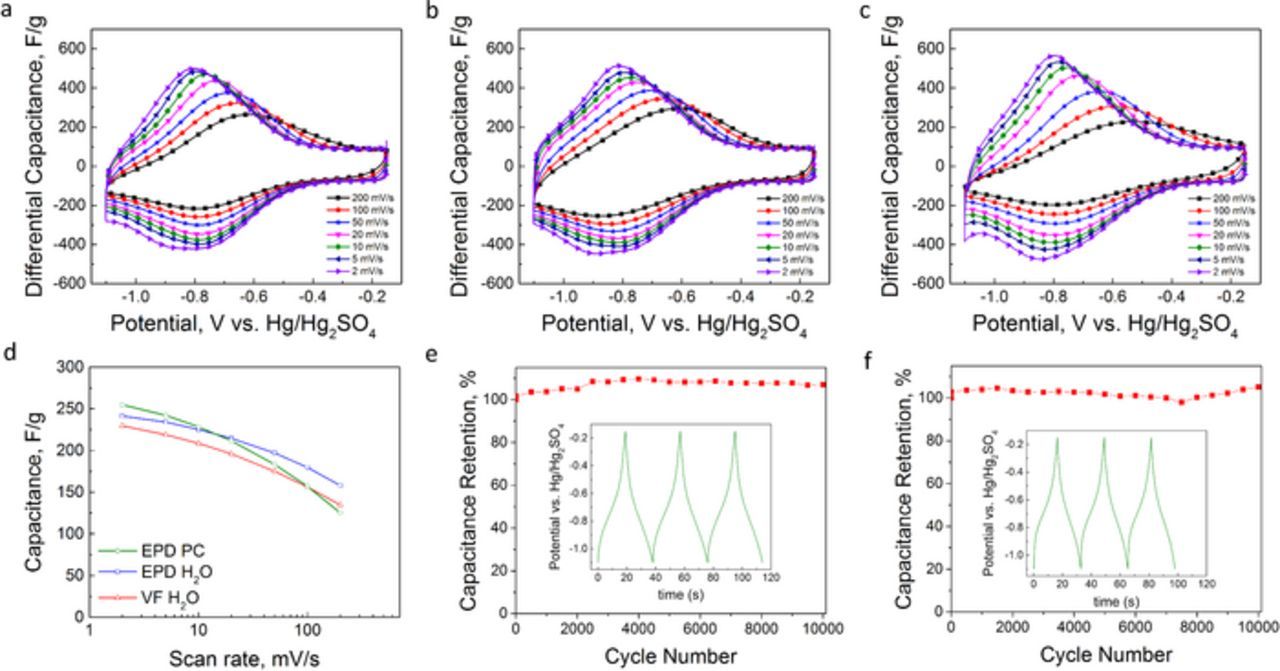
Figure 6. Electrochemical performance of 2–3 μm thick Ti3C2Tx electrodes tested in three-electrode cells in 1 M H2SO4 (a-c) Cyclic voltammograms of vacuum filtered H2O, EPD H2O, and EPD PC, respectively, (d) scan rate dependence of specific capacitance, (e-f) galvanostatic charge-discharge tests conducted at 10 A/g for EPD H2O and EPD PC films, respectively.
Kinetic analysis of the aqueous EPD film's CV data was performed to determine if the charge storage mechanisms were due to surface-controlled (capacitive) or limited by solid-state diffusion processes. Following the method of Lindström,54 the current, i, at a fixed potential was measured as function of scan rate, ν, and fit to the equation |i| = aνb, where a and b are fitting parameters. b-values greater than 0.7 were observed throughout the range of potentials in the CV (see Fig. S4). This confirmed that charge storage is not diffusion-limited as in battery-like electrodes, and most likely pseudocapacitive in nature, as shown previously by other methods in Ti3C2Tx and other MXenes.55,56
Figure 6d shows that the gravimetric capacitance values of all films are quite similar at all scan rates. Interestingly, the EPD PC film has the highest capacitance at 2 mV/s but declines the most quickly with increasing scan rates, whereas the two water-based films show nearly identical trends with scan rate. At 241 and 254 F/g, respectively, the capacitance values of water EPD and PC EPD films at 2 mV/s is nearly identical to that of a 5 μm-thick roll-cast Ti3C2Tx electrode (i.e. 246 F/g).14 Table S1 summarizes the volumetric capacitances of all three films tested herein.
Galvanostatic charge-discharge testing at a current density of 10 A/g was also conducted on the two types of EPD films. The non-triangular shapes of the voltage vs. time profiles, shown in the insets of Figures 6e–6f, are consistent with the pseudocapacitive nature of the charge storage mechanism suggested by the corresponding CVs and previous work on Ti3C2Tx. Approximately 100% capacitance retention is observed after 10,000 charge-discharge cycles for both EPD films (Figures 6e–6f). We speculate that the PC EPD films’ larger c-LPs, surface structure differences, and chemical composition differences compared to aqueous films could each introduce alterations in the charge storage of the two EPD films, and future studies are needed to clarify their relative roles.
Conclusions
In conclusion, EPD was successfully used to deposit 3 to 10 μm thick Ti3C2Tx MXene films from aqueous and PC colloidal suspensions. After establishing the procedures for producing high concentration Ti3C2Tx suspensions, the influence of deposition voltage and deposition time under constant-voltage conditions on morphology, orientation of flakes, and chemical compositions of the films were studied by SEM, EDS, and XRD. Increasing deposition voltage lead to the formation of pores and less-oriented structures in films made from aqueous suspensions, which could be of use in applications where high macroscopic surface area is required. On the other hand, the overall film morphology was quite insensitive in the case of the PC depositions. At the optimal voltage of 5 V, the kinetics of deposition can be modeled according to the equations outlined by Sarkar and Nicholson.2 At 7400 S/cm, the EPD-fabricated freestanding films from aqueous suspensions had electrical conductivities on par with the highest reported values for highly oriented Ti3C2Tx made by spin coating. When freestanding Ti3C2Tx films were tested in 1 M H2SO4 as electrodes in electrochemical capacitors, gravimetric capacitance values were comparable to values in the literature for the same material.
Acknowledgments
The authors thank Dr. Guobing Ying of Drexel University for assistance with electrical resistivity and optical profilometry measurements. We thank Shawn Mengel (Drexel University) for providing the custom EPD cell. We also are appreciative of Michael Ghidiu (Drexel University) for valuable feedback on the project and Prof. Y. Gogotsi for use of his potentiostat. This work was supported by the Division of Materials Research (DMR-1310245) and the Civil, Mechanical and Manufacturing Innovation Division (CMMI-1463412) of the National Science Foundation (NSF).
