
Abstract
A colloidal silica-based slurry (3–10 wt%) containing H2O2 (1 wt%) and citric acid (50 mM) was found to polish chemical vapor-deposited (CVD) cobalt (Co) films with removal rates (RRs) of ∼180–500 nm/min and a dissolution rate (DR) of ∼0 nm/min at pH 8 along with an RMS roughness of ∼0.5 nm and a corrosion current of ∼50 μA/cm2. Our results suggest that, in the presence of H2O2, the Co film surface was covered with a passive film of CoO in acidic conditions and Co3O4 in alkaline conditions. However, in the presence of H2O2 and citric acid in acidic conditions, formation of the soluble complex [Co(C6H5O7)2]3− from abraded Co enhanced the RRs significantly. The roles of H2O2, citric acid, and silica abrasives as well as the pH on the Co material removal process are discussed and a removal mechanism is proposed. Two inhibitors namely, 1, 2, 4- Triazole (TAZ) and Benzotriazole (BTA), were tested in the presence of 50 mM citric acid at pH 8 but were found to be ineffective even at concentrations of 100 mM in reducing the ΔEcorr of Co-Ti couple to minimize galvanic corrosion that is essential when the Co/Ti structure is polished after the removal of bulk of Co and requires further study.
Export citation and abstract BibTeX RIS

This is an open access article distributed under the terms of the Creative Commons Attribution 4.0 License (CC BY, http://creativecommons.org/licenses/by/4.0/), which permits unrestricted reuse of the work in any medium, provided the original work is properly cited.
Sub-10 nm devices face several challenges with copper as an interconnect material for back-end-of-the-line (BEOL) processes during the manufacture of integrated circuits. These include increasing resistivity with decreasing thickness,1 non-conformal deposition at narrow trench widths ∼20 nm or less,2 and scaling limitations of the diffusion barrier/liner.3 This led to the investigation of new trench filling materials. Cobalt is a promising alternative to meet the challenges of interconnect lines at these lower nodes for the first two metal layers M1 and M2, due to its lower resistivity at smaller dimensions (∼10 nm) compared to copper.4–6
Kamineni et al.7 proposed the use of chemical vapor deposited (CVD) cobalt to replace the widely used tungsten for local interconnects for 10 nm and smaller nodes. They emphasized two main advantages of CVD Co metallization which are a) CVD Co precursors do not damage the Ti liner enabling barrier scaling and b) it achieves void free fill in high aspect ratio features without defects, something that is difficult to achieve with a conventional physical vapor deposited (PVD) Co process.8,9 Hence, CVD-based Co metallization is an attractive option for the technology nodes below 10 nm.
CVD-based cobalt has also gained prominence in the advanced copper interconnects below 22 nm as liner10–17 to improve adhesion between the barrier (TaN, TiN) and Cu seed layer where the Co film thickness is only ∼2 nm. Several authors18–26 have investigated cobalt polishing for such applications where RR requirements are typically <20 nm/min and Co loss due to corrosion has to be as close to zero as possible, since even a minute loss of Co material can degrade the device reliability significantly. Hence, since the potential gap between Co and Cu is a large ∼0.61 V, it is very important to lower this to ∼10–20 mV. Furthermore, during the polish step, the RRs for Co:Cu should be ∼1:1 to minimize Cu dishing. Therefore, the barrier slurries27 were typically formulated in near neutral to highly alkaline28 regions where the formation of compact and passive oxides19,22,25 on the cobalt surface lowers the RRs and helps in minimizing corrosion.
In contrast, slurries preferred for interconnect applications of Co should also have very low DRs (≤1 nm/min) but with RRs that exceed 100 nm/min or so29 while also minimizing individual corrosion as well as galvanic corrosion between Co and the underlying liner (Ti/Ta). Furthermore, it is critical to understand if the intermediate Ti/TiN or Ta/TaN layers between the Co film and Si substrate influence polishing performance as was seen with the Ru films.30
However, all of the previous studies on cobalt polishing have used PVD films and disks but not CVD cobalt films for interconnect applications. This difference is important since it was shown that the removal and static etch rate behavior of PVD and CVD Co films differ significantly from each other.29
Recent patent literature suggests several slurry compositions with the required higher removal rates along with the necessary removal rate selectivity toward other liner/barrier layers (Ta/TaN, Ti/TiN) and dielectrics (TEOS, SiN, low-k, and ultra-low-k films).29,31–33 For example, Wang et al.31 have developed a polishing composition comprising 3 wt% abrasives, a weak acid acting as a complexing agent, at least one-azole containing corrosion inhibitor, water, and a pH adjustor as needed in the pH range of 7–12. They claimed very high removal rates (500 nm/min) at 1.5 psi down pressure along with a relatively low dissolution rate (≤1 nm/min) at pH 7 and 8. The reaction mechanism provided by them to describe the Co film dissolution and passivation behavior across pH range 2–12 is incomplete due to the absence of a discussion of the effect of the oxidizer, complexing agent, and inhibitor present in the slurry. Also, they did not specify the type of cobalt films (CVD, PVD or electroplating (EP)) used in their experiments.
Sikma et al.32 provided a composition comprising of 1 wt% picolinic acid, 0.2 wt% ammonium phosphate, 0.5 wt% colloidal silica and 0.5 wt% H2O2 at pH 5 to achieve very high PVD Co removal rates (∼700 nm/min) at 1.5 psi using 0.5–1.5 wt% colloidal silica and used cocoyl sarcosine to suppress the dissolution rates (∼2 nm/min). Kraft et al.33 developed a slurry composition consisting of 1 wt% H2O2 and iminiodiacetic acid (∼45 mM) at pH 7 to obtain PVD Co RRs of ∼350 nm/min using 2 wt% colloidal silica at 1.5 psi. In another patent, Kraft et al.34 further improved the above polishing composition by adding additional dishing control agents consisting of N-laurylsarcosine and N-oleoylsarcosine. However, dishing of 50 × 50 μm cobalt pattern features is about ∼34 nm which is quite high for interconnects in the technology nodes of interest.10,35
Shi et al.29 used β-alanine and glycine as dual chelating agents along with H2O2 at pH 7 to achieve PVD Co RRs of about ∼500 nm/min using 0.5 wt% silica at 1 psi. They investigated the effect of the concentration of H2O2, silica abrasives, dual chelators and pH on RRs. Optimized polishing compositions were provided which satisfy the removal rate and dissolution rate requirements along with the selectivity data for barrier films and dielectrics. However, the underlying mechanism involved with the removal of cobalt in the presence of their additives has not been discussed. Also, while it was claimed that the potential gap between Co/Cu couple was low (no data provided) and minimized the galvanic corrosion, the more important galvanic corrosion between Co and the underlying barrier layers (Ti/TiN or Ta/TaN), crucial for interconnect applications, was not addressed.
Carboxylic acids are commonly used in slurries to facilitate the formation of complexes with the oxidized metal layer and to enhance the RRs significantly.36–41 Citric acid is a tricarboxylic acid widely used in Cu-CMP slurries37,42 since it can form water soluble complexes with metal oxides and hydroxides. It has also been recently used as a complexant in a post-CMP cleaning solution for Co substrates. It can form different complexes with Co(II) ions in aqueous solutions depending on the pH and counter ions present.43–45 Previous studies on polishing cobalt substrates have suggested that the synergistic effect of an oxidizer and that of a complexing agent is essential in enhancing the RRs.19,22 Hence, we investigated citric acid as a complexing agent in silica slurries using H2O2 as an oxidizer to polish CVD Co films and show that it is possible to achieve relatively high removal rates (≥100 nm/min) at 2 psi down pressure, low dissolution rates (≤1 nm/min) and low corrosion currents (<50 μA/cm2) as well as excellent post-polish surface quality. We also discuss the underlying reactions and propose a mechanism for its removal based on spectroscopic and electrochemical measurements as well as the challenges with minimizing the galvanic corrosion of the Co-Ti couple that need further work.
Materials
Cobalt (∼200 nm) films were deposited at IBM, Albany, NY, by CVD on an intervening ∼3 nm Ti/TiN layer on 300 mm Si wafers. PVD Ti (∼300 nm) films deposited on an intervening ∼20 nm TEOS oxide layer on 200 mm Si wafers were purchased from Montco silicon technologies, PA. These wafers were diced into 2 × 2 cm square coupons for polishing experiments and 1 cm × 2 cm rectangular coupons for use as working electrodes in electrochemical experiments. 3 wt% aqueous colloidal silica dispersions (Nexsil 35 A) with the abrasive of average diameter ∼35 nm, obtained from Nyacol Nano Technologies, were used for all the polishing experiments along with reagent grade chemicals obtained from Sigma-Aldrich. The pH of the aqueous dispersions containing the additives was adjusted using HNO3 or KOH as necessary. Co powder, spherical, ∼0.75 mm in diameter on average, was obtained from Alfa Aeasar and used for preparing samples for spectroscopic measurements.
Experimental
Electrochemical
A Gamry-PCI4 potentiostat and a three-electrode glass cell (200 mL volume, with a Pt counter electrode and a saturated calomel reference electrode were used to acquire the potentiodynamic polarization data. A voltage scan rate of 5 mVs−1 was used to obtain the potentiodynamic data in the voltage ranges of the Eoc ± 0.5 V. In some cases, when linear polarization data were being obtained, the scan range was limited to Eoc ± 0.2 V. Rectangular Co coupons (1 cm × 2 cm) were used as the working electrodes. Only about a 1 cm2 area of the coupon was exposed to the electrolytes. Any native oxide present on the surface was removed by polishing for 5 s with an aqueous dispersion containing 3 wt% silica at its natural pH ∼4–5. All the electrochemical data were obtained while the solution was continuously stirred with the help of a stir bar at 200 rpm.
Polishing
All the polishing experiments were performed on a CETR (Center for Tribology Research, now Bruker) CP-4 bench-top polisher using the 200 nm thick film CVD Co coupons (2 cm × 2 cm) using a carrier designed to hold these coupons. At least three coupons were polished at each condition. Fujibo pads were used for all the polishing experiments and were cleaned using a soft brush and a DI water jet for 1 min prior to each polish. All the polishing experiments were performed at a polishing pressure of 2 psi with a slurry flow rate of 120 mL/min and platen/carrier speeds of 93/87 rpm for 1 minute (or less in cases where complete film removal was observed during this time). The thickness of the Co films was determined, before and after polish, by measuring the resistance of these films using a four-point probe at five different locations from one corner to another along a diagonal and averaged. Each experiment was repeated twice and these data were used to compute the average removal rates (RRs) and the standard deviations.
Dissolution
Co coupons (2 × 2 cm) were dipped for 3 minutes in 200 ml of the desired solutions stirred at ∼300 rpm maintained at 45°C, a temperature that is expected to be close to the polishing temperature29,31–33 using a digital hotplate with a temperature probe. The dissolution rates were determined from the change in the thickness, before and after dipping the coupons, obtained by measuring the resistance of these films using a four-point probe. The resistance of the Co coupons was measured at five different locations from one corner to another along a diagonal, and averaged. Each experiment was repeated twice and these data were used to compute the average dissolution rates (DRs) and the standard deviations.
UV-Vis spectroscopy
100 ml of the aqueous solutions of interest were sonicated along with ∼2 μm cobalt powder (0.1 wt%) for about 60 min at 25°C. Then, the resulting dispersion was centrifuged for 30 min at 4500 rpm. The supernatant was separated and analyzed with background correction in quartz cuvettes with an optical length of 10 mm using a Perkin-Elmer Lambda 35 UV-Vis spectrophotometer.
Surface roughness measurements
Post-polish film surface roughness was measured using a Zygo non-contact optical profilometer. Roughness as well as surface profiles were measured in a sample area of 350 × 260 μm at three different locations on the post-polished coupons.
Results and Discussion
Effect of H2O2 concentration and pH on Co DRs and RRs
The effect of H2O2 concentration on DRs and RRs of cobalt films was investigated across the pH range of 4–12. 3 wt% of silica loading was used in the slurries so that the RRs of CVD cobalt films used in this study could be compared to those obtained with PVD cobalt films in a previous study.19 Three different H2O2 concentrations (0.1, 1, and 5 wt%), selected based on the amount used in commercial cobalt slurries reported recently in the patent literature,29,31–34 were investigated and the results are shown in Figures 1 and 2.
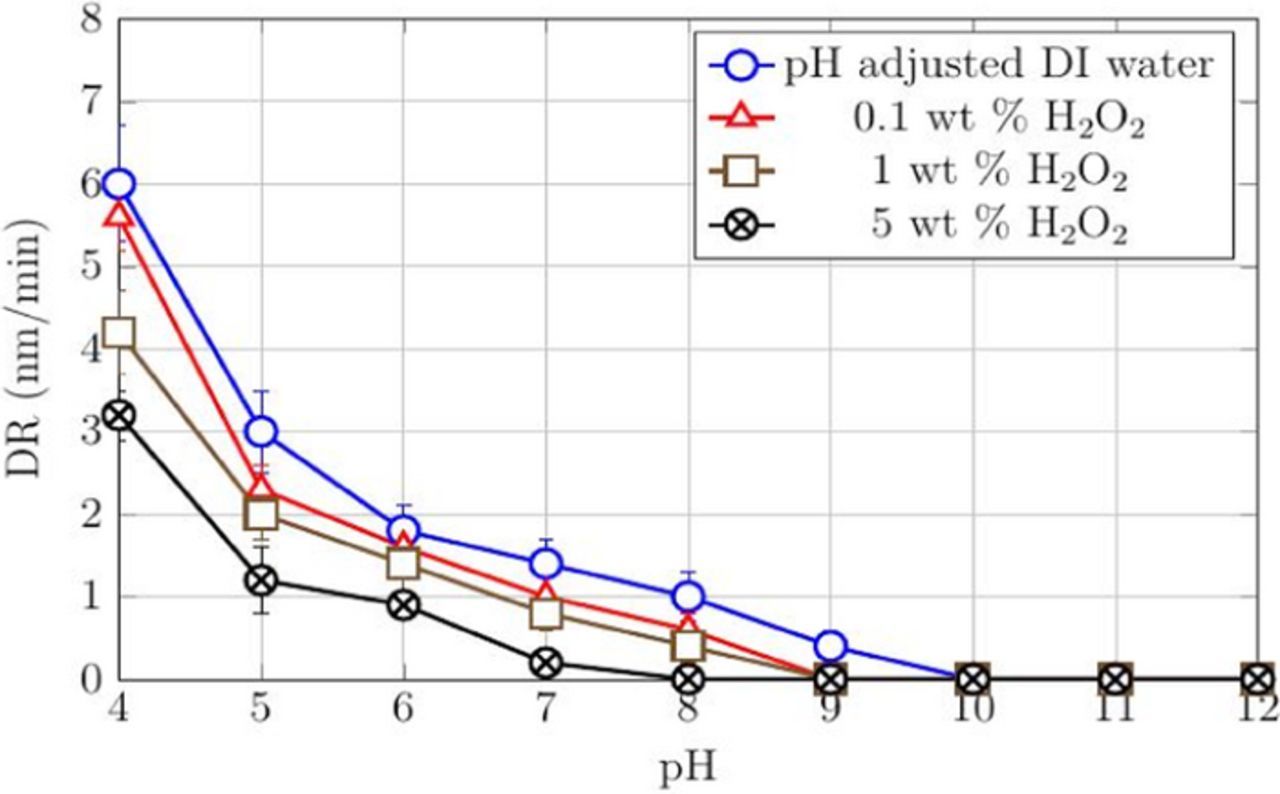
Figure 1. DRs of CVD Co films with pH-adjusted DI water and different concentrations of H2O2 as a function of pH at 45°C.
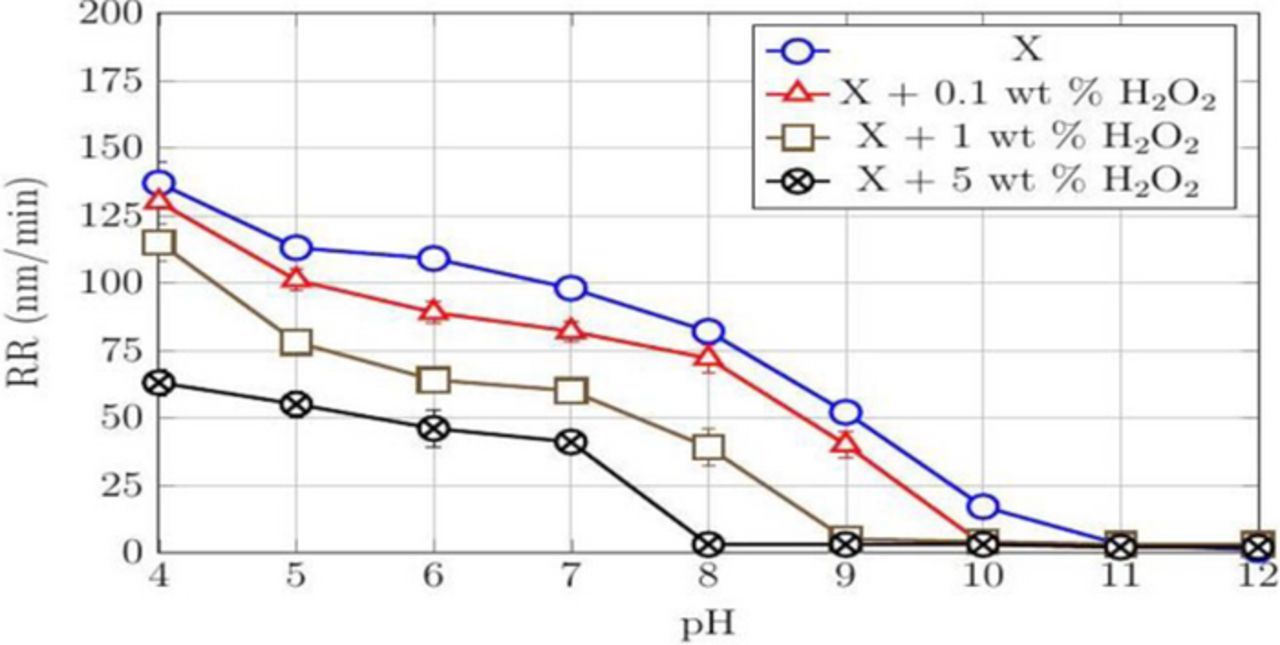
Figure 2. RRs of CVD Co films at different concentrations of H2O2 in a 3 wt% silica dispersion (X) as a function of pH, all at a down pressure of 2 psi.
DR (∼6 nm/min) with just water and RR of ∼140 nm/min with 3 wt% silica were measured at pH 4 and both decreased as the pH was increased. Beyond 9, there were no measurable DRs with water while the RRs decreased from ∼50 nm/min at pH = 9 to negligible RRs at pH = 12. Previous studies show a similar decrease of DRs and RRs with increasing pH for PVD films and polycrystalline disks.19,22 The addition of H2O2 to just water and to a 3 wt% silica dispersion lowered both the DRs and RRs (Figure 2) at all the pH values and the three concentrations tested. These results suggest an increase in the passive nature of the Co surface with an increase in both the pH and the concentration of H2O2.
Co removal mechanism
Typically, the cobalt surface consists of native oxide (CoO) or the hydrated oxide (Co(OH)2) in the presence of aqueous solutions.46–48 In acidic conditions, Reactions 1 and 2 (see below) describe the dissolution of CoO and Co(OH)2 into Co2+ ions.46,48,49 Once the native oxide is removed, the dissolution continues according to Reaction 350 which can be accelerated by the reduction of dissolved O2 (Reaction 4). The relatively high DRs observed with just water in the acidic conditions (Figure 1) are due to the dissolution processes described by Reactions 1–3 which are spontaneous (ΔG <0) in nature. Also, since the hardness of silica (∼6–7 mohs) is higher than that of cobalt (∼5.5 mohs),22 the silica particles can directly abrade the cobalt film resulting in higher RRs (Figure 2) even at 2 psi applied pressure.
![Equation ([1])](https://content.cld.iop.org/journals/2162-8777/6/9/P594/revision1/d0001.gif)
![Equation ([2])](https://content.cld.iop.org/journals/2162-8777/6/9/P594/revision1/d0002.gif)
![Equation ([3])](https://content.cld.iop.org/journals/2162-8777/6/9/P594/revision1/d0003.gif)
![Equation ([4])](https://content.cld.iop.org/journals/2162-8777/6/9/P594/revision1/d0004.gif)
Increasing the concentration of H2O2 increase the formation of CoO as shown in Reaction 5 below, which is less soluble than Co(OH)2 causing a decrease in the DRs. The positively charged CoO (IEP ∼9.251) can be removed due to abrasion by the negatively charged silica abrasives in the acidic region as seen from the RRs in Figure 2. The RR decreases with increasing peroxide concentration, presumably due to the formation of a thicker oxide.
![Equation ([5])](https://content.cld.iop.org/journals/2162-8777/6/9/P594/revision1/d0005.gif)
In the alkaline regions, Co(III) oxide (Co3O4), which is more passive and three times harder compared to CoO,52 is known to form as shown in Reactions 6 and 7 below. Simultaneously, some of the dissolved O2 reduces to OH− ions as shown in Reaction 8 which can assist Reaction 6.
![Equation ([6])](https://content.cld.iop.org/journals/2162-8777/6/9/P594/revision1/d0006.gif)
![Equation ([7])](https://content.cld.iop.org/journals/2162-8777/6/9/P594/revision1/d0007.gif)
![Equation ([8])](https://content.cld.iop.org/journals/2162-8777/6/9/P594/revision1/d0008.gif)
In the presence of H2O2, more OH− ions can be generated according to Reaction 9 as shown below which can further enhance the formation of Co3O4 (IEP ∼9.5) leading to negligible DRs and RRs beyond 9.
![Equation ([9])](https://content.cld.iop.org/journals/2162-8777/6/9/P594/revision1/d0009.gif)
Citric acid as a complexing agent to enhance Co RRs
Our results suggest that a passive layer, perhaps CoO/Co(OH)2 or Co3O4 depending on the pH, is formed in the presence of peroxide. Citric acid was investigated as a possible complexing agent to enhance Co RRs since it complexes with its oxides. The RRs at four different concentrations of H2O2 (0, 0.1, 1, and 5 wt%), 3 wt% silica, and 50 mM citric acid are shown in Figure 3 as a function of pH. When peroxide was added to 3 wt% silica and 50 mM citric acid (Ref.) dispersion, the rates are low at 0.1 wt% H2O2, reach a high in the range of 325–400 nm/min at 1 wt% H2O2, but then drop again at 5 wt% H2O2. This indicates that, beyond a critical concentration of H2O2, the rate of oxidation exceeds that of complexation reducing the rate of formation of soluble complexes lowering the RRs and as well the DRs. To confirm this observation, DRs were measured across the pH range of 4–10 and the results are shown in Figure 4. The DRs are again the highest among these four compositions at 1 wt% H2O2.
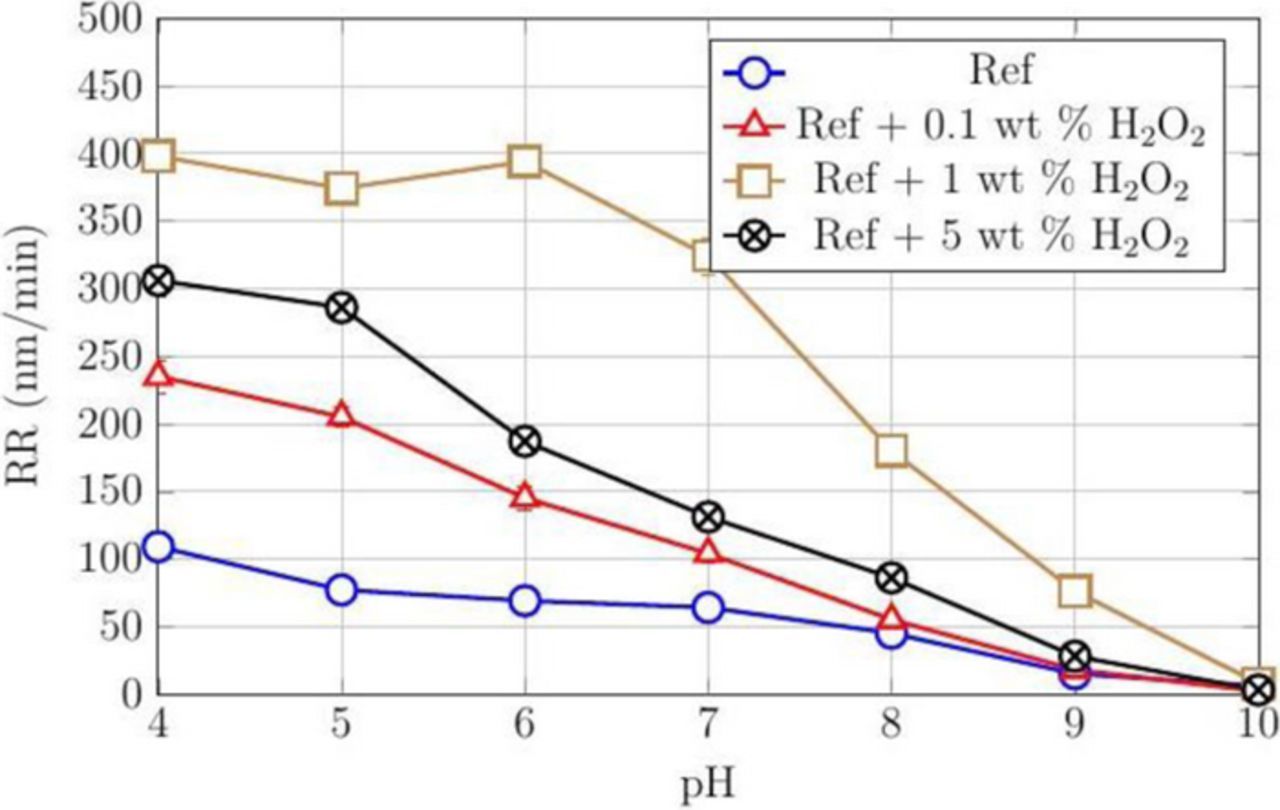
Figure 3. RRs of CVD Co films using 3 wt% silica, 50 mM citric acid (Ref.) and different concentrations of H2O2, all at a down pressure of 2 psi.
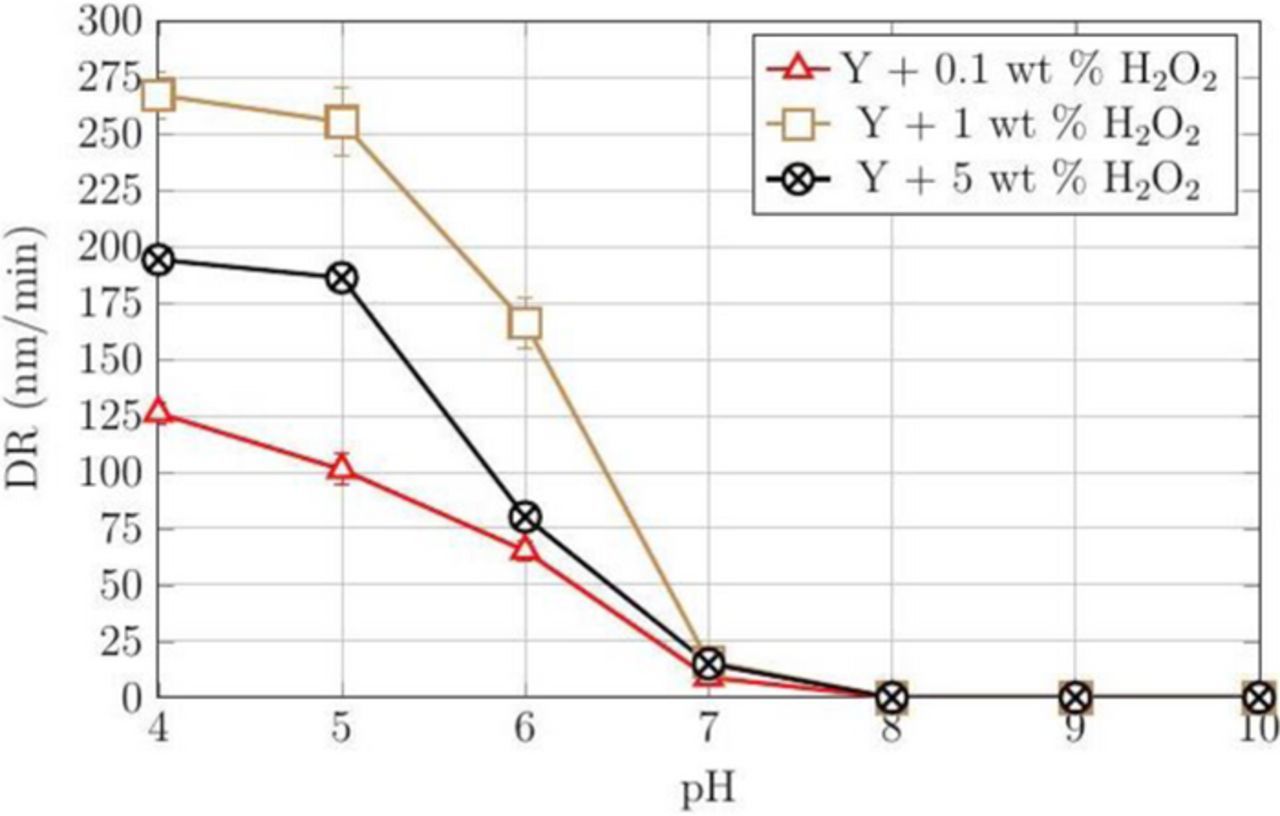
Figure 4. DRs of CVD Co films for different concentrations of H2O2 and 50 mM citric acid (Y) as a function of pH at 45°C.
The combination of low DRs and relatively higher RRs at pH 7 and 8 with 50 mM citric acid, 1 wt% H2O2 and 3 wt% silica suggest that at these pH values, the dispersion can meet the interconnect polishing requirements.29 Nevertheless, we investigated the effect of increasing both the silica particle loading and citric acid concentration separately in this dispersion at pH 7 and 8. These results are shown in Figures 5 and 6. The results shown in Figure 5 indicate that increasing the silica particle loading increases the RRs at both pH 7 and 8. On the other hand, increasing the citric acid concentration enhanced both the RRs and DRs at pH 7 and 8. Fig. 6 shows that increasing the citric acid concentration beyond 100 mM does not increase Co RRs. This suggests that, beyond this concentration, the rate of complexation and removal are determined by the rate-limiting formation of the oxide layer on cobalt that is determined by the peroxide concentration.
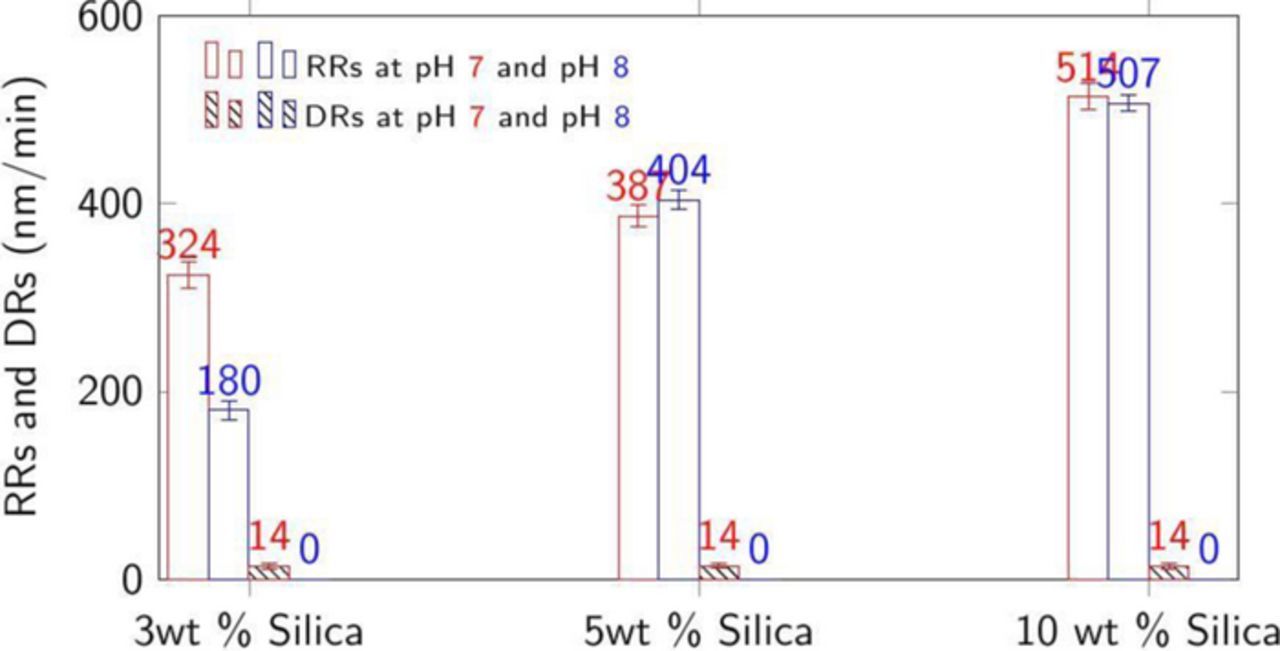
Figure 5. RRs and DRs at 45°C of CVD Co films with 1 wt% H2O2, 50 mM citric acid (Y) plus 3, 5, and 10 wt% silica loading at pH = 7 and 8. RRs were obtained at 2 psi down pressure.
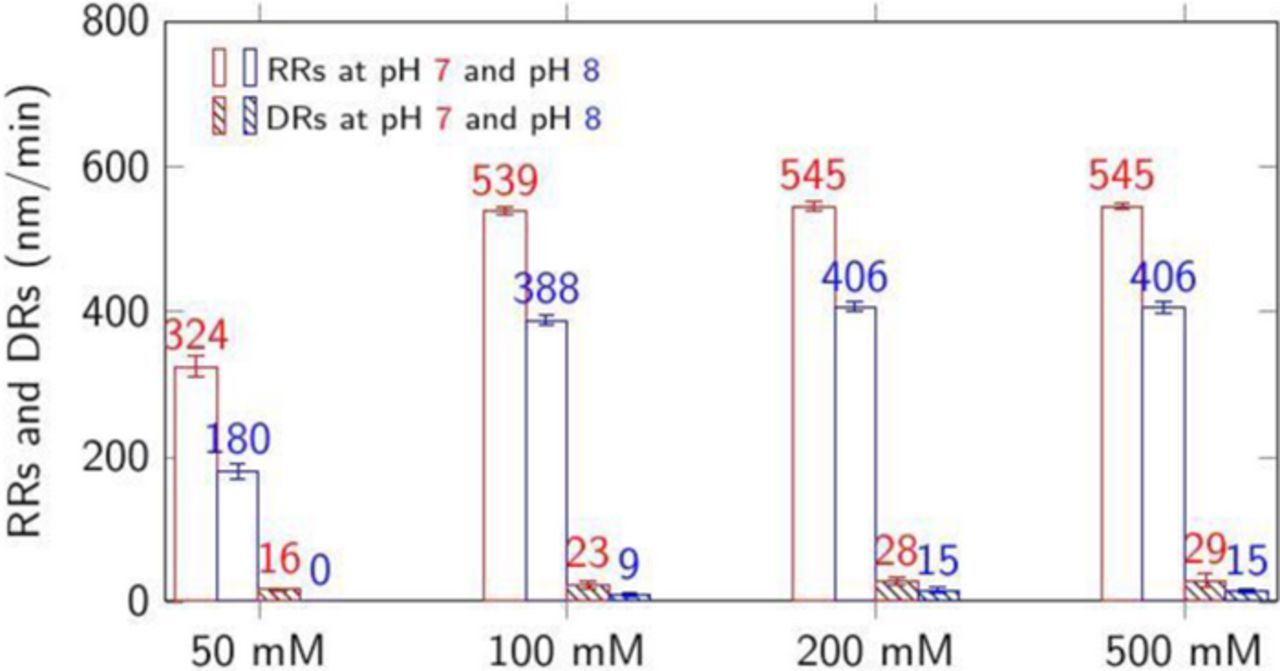
Figure 6. RRs and DRs at 45°C of CVD Co films with 3 wt% silica, 1 wt% H2O2 plus 50, 100, 200, and 500 mM citric acid at pH = 7 and 8. RRs were obtained at 2 psi down pressure.
However, since a DR as close to zero as possible is highly desirable for effective planarization, the dispersion containing 50 mM citric acid, 1 wt% H2O2 and 3–10 wt% silica at pH 8 with a reasonable RRs ∼180–500 nm/min and DR ∼0 nm/min seems to be very good choice. This choice is also validated by the superior surface quality of the Co film post-polish and dissolution as shown in Figure 7.
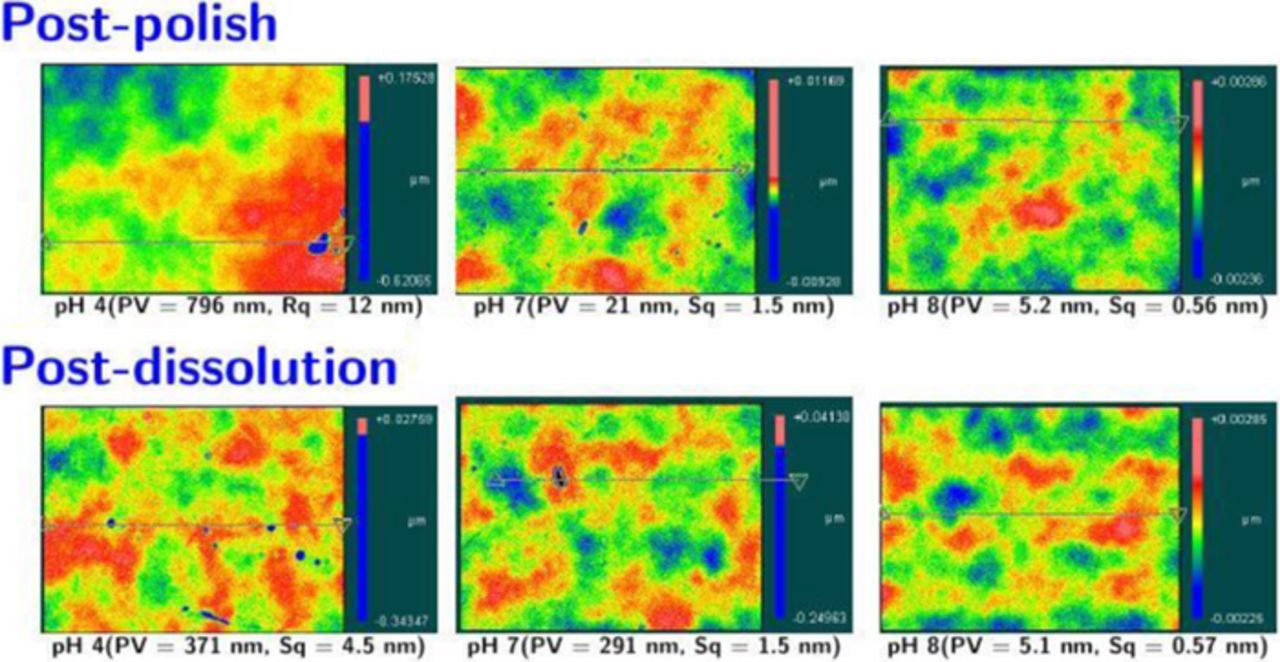
Figure 7. Typical images of Co film surfaces and associated roughness values after polishing with 3 wt% silica + 1 wt% H2O2 + 50 mM citric acid at pH (a) 4, (b) 7, and (c) 8 and after exposure for 3 min to 1 wt% H2O2 + 50 mM citric acid solution at pH (d) 4, (e) 7, and (f) 8. In both cases, pits are seen for pH 4, 7 but not for pH 8.
Surface quality of Co films
Typical surface images of Co films over a 350 μm × 260 μm area and RMS roughness (Sq) and peak to valley (P/V) values, all obtained after polishing with 3 wt% silica, 1 wt% H2O2, and 50 mM citric acid at 2 psi down pressure, are shown in Figure 7 (panels a, b and c) at pH 4, 7, and 8. At pH 4 and 7, the post-polish surface had much higher P/V and Sq values compare to that at pH 8. The higher roughness in the acidic region can be attributed to localized corrosion that was also reported by other authors18,53,54 for PVD films. Indeed Co coupons (∼2 × 2 cm2) simply dipped in 200 ml of 1 wt% H2O2 + 1 wt% citric acid solution (stirred at 300 rpm) at pH 4, 7, or 8 for three minutes showed pits again at pH 4 and 7 but not at pH 8, as shown Figure 7 (panels d, e and f). This is likely due to the thicker, robust, and uniform Co(III) oxide formed at pH 8 by the faster conversion of Co(OH)2, facilitated by the higher number of OH− ions. These results along with very low DRs and a reasonable RR suggest that polishing with this dispersion is best carried out at pH = 8.
UV-Vis spectra
The absorption spectra of the supernatants collected from dispersions containing Co powder (0.1 wt%) mixed continually for 60 min at 25°C with different amounts of H2O2 in DI water adjusted to pH 4 showed negligible absorbance values across the entire wavelength range of 300 to 800 nm (data not shown). However, Figure 1 show that DRs at 45°C are in the range of 3–6 nm/min, which indicates that temperature is an important factor which can affect dissolution rates. Nevertheless, due to the unavailability of control on temperature with our sonicator, all of our spectral data were obtained from the supernatants of dispersions mixed at 25°C with background correction for different solutions (i.e., without Co powder) and these results obtained were used to explain the variation in DRs and RRs. The absorption spectra of the supernatants collected from the same dispersions, but now at pH 2, are shown in Figure 8. A spectral peak was observed at ∼517 nm which corresponds to the water soluble complex [Co(H2O)6]2+ as reported by several authors.55–57 This indicates that not only temperature but also addition of H+ ions enhances the dissolution rates of Co, consistent with Reaction 1 and Figure 1. Also, the peak intensity decreases with the addition of H2O2, reflecting the decrease in the DRs of Co observed earlier (Figure 1). However, this peak disappears completely at pH 8 (data not shown) for the three concentrations of H2O2 and pH adjusted DI water, again consistent with negligible DRs (∼0 nm/min) observed at pH 8 for all the above solutions (Figure 1).
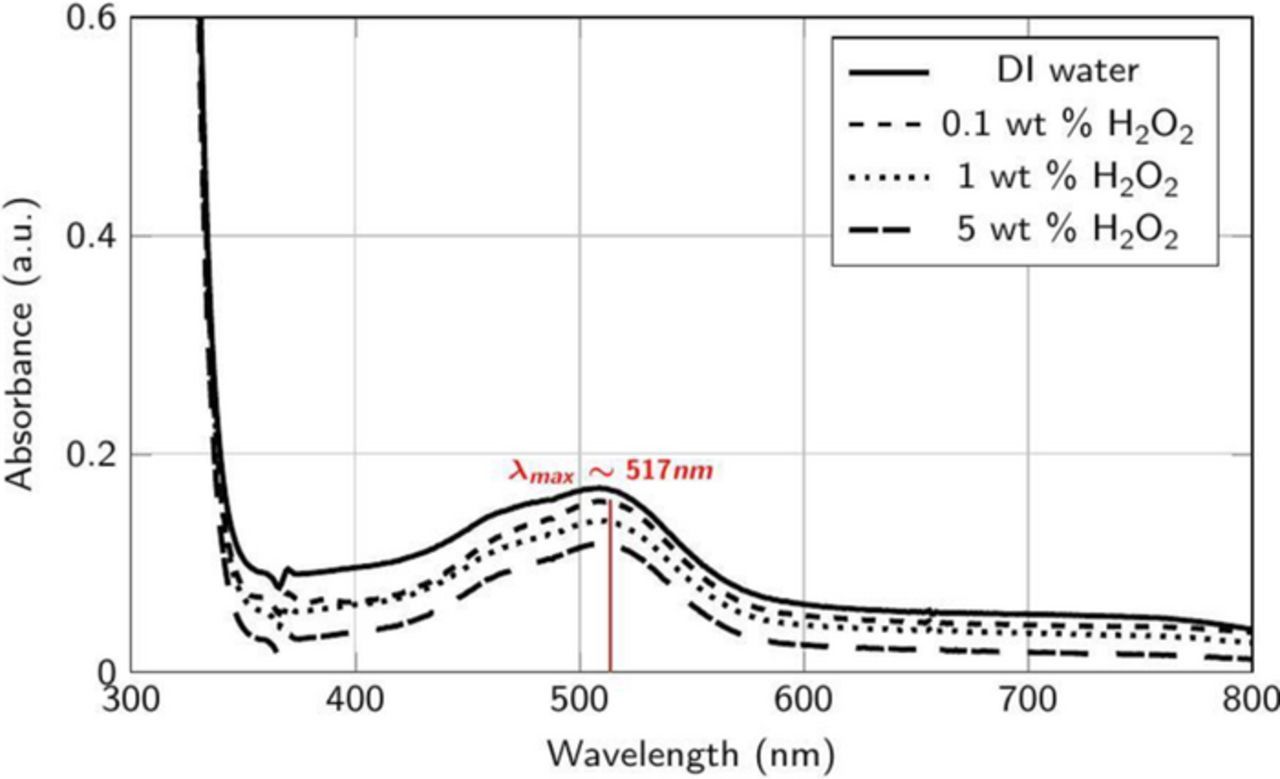
Figure 8. Absorbance spectra of the supernatant collected after the addition of ∼2 μm Co powder (0.1 wt%) to DI water at different concentrations of H2O2 at pH 2.
Figure 9 shows the absorption spectra of the supernatants collected from the dispersions stirred with Co powder with the same three concentrations of H2O2 but now in the presence of 50 mM citric acid at pH 4. The same spectral peak at ∼517 nm was observed with 0.1, 1, and 5 wt% H2O2 concentrations as shown in Figure 8. Also, the absorbance values observed at the wavelength ∼517 nm are relatively higher than those in the absence of citric acid. This corresponds to the increase in the rate of dissolution of Co in the presence of both H2O2 and citric acid, consistent with the observed DRs for different H2O2 concentrations (Figure 4), with the rates being higher at 1 wt% H2O2 than at 0.1 or 5 wt%.
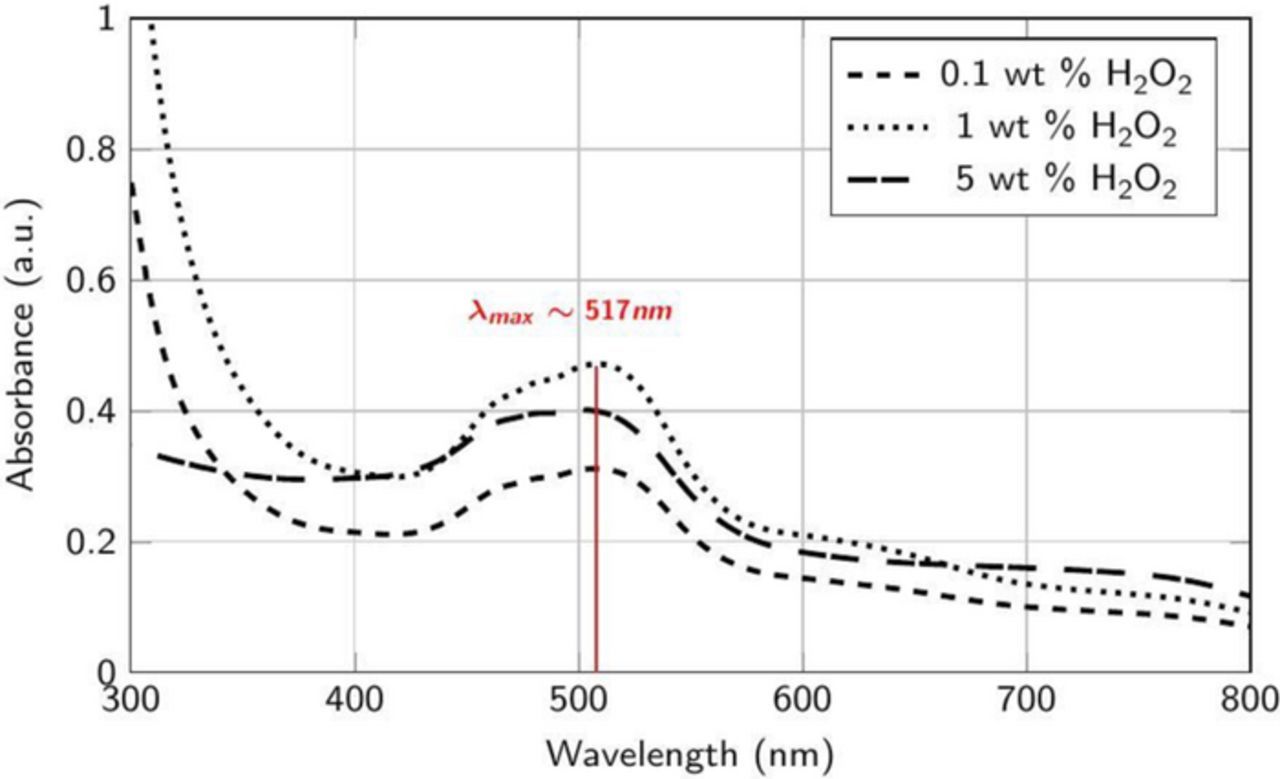
Figure 9. Absorbance spectra of the supernatant collected after the addition of ∼2 μm Co powder (∼0.1 wt%) to 50 mM citric acid in DI water at different concentrations of H2O2 at pH 4.
The spectra for the supernatant obtained from 5 mM Co acetate, 50 mM citric acid and Co powder without peroxide showed a spectral peak at 517 nm, identical to that observed with just DI water (data not shown). More interestingly, adding 5 mM cobalt acetate at all the tested concentrations of H2O2 in the presence of 50 mM citric acid plus Co powder and then analyzing the supernatants resulted in a new spectral peak at ∼600 nm (Figure 10) while the peak at 517 nm disappears suggesting the formation of a soluble Co3+ complex58,59 which is most likely [Co(C6H5O7)2]3− based on Reactions 10 and 11. This suggests that if the abraded Co film generates Co2+ ions, they can react with the completely deprotonated citric acid (pKa1 = 3.2, pKa2 = 4.9, pKa3 = 6.4) at pH 8 (Reactions 10 and 11), increasing the formation of [Co(C6H5O7)2]3− and contributing to the higher RRs seen in Figure 3.
![Equation ([10])](https://content.cld.iop.org/journals/2162-8777/6/9/P594/revision1/d0010.gif)
![Equation ([11])](https://content.cld.iop.org/journals/2162-8777/6/9/P594/revision1/d0011.gif)
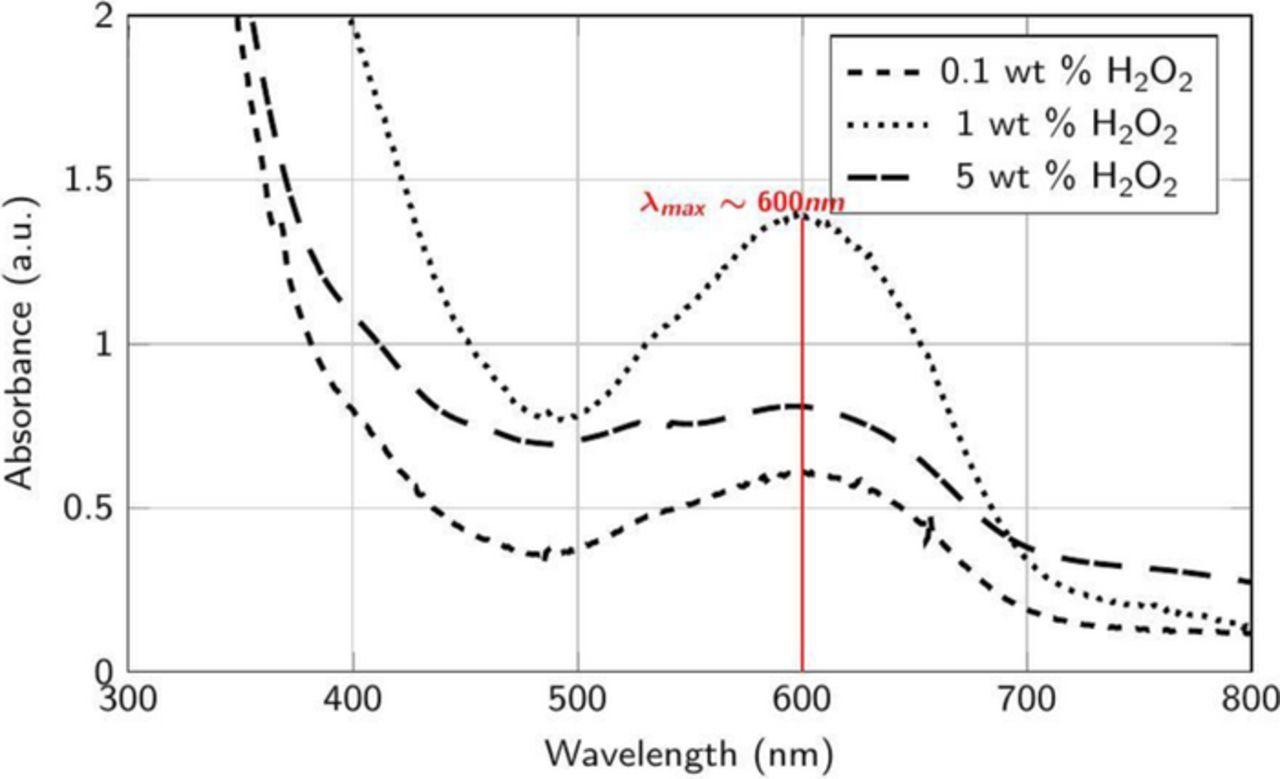
Figure 10. Absorbance spectra of the supernatant collected after the addition of ∼2 μm Co powder (∼0.1 wt%) and 5 mM cobalt acetate to 50 mM citric acid in DI water at different concentrations of H2O2 at pH 4.
Figures 11 and 12 show the absorption spectra of the supernatants collected from dispersions containing Co powder (0.1 wt%) mixed continually for 60 min with same amounts of H2O2 in DI water, now adjusted to pH 8, without and with 5 mM cobalt acetate. The peak at ∼517 nm is absent in Figure 10 at all the concentrations of H2O2 suggesting no soluble complex formation, in agreement with the negligible DRs observed at this pH (Figure 4). However, the spectral peak at ∼600 nm appears in Figure 11 which suggests the formation of [Co(C6H5O7)2]3− in the presence of Co2+ ions even at pH 8. The lower intensity of this peak reflects the lower RRs at this pH (Figure 3). Hence, the choice of the appropriate pH, in our case 8, that results in negligible DRs and reasonable RRs (Figures 3 and 4) in the presence of citric acid is crucial for the desired slurry performance. It should be emphasized that all the spectral data reported here were obtained after subtracting the data from just the solutions without the cobalt powder.
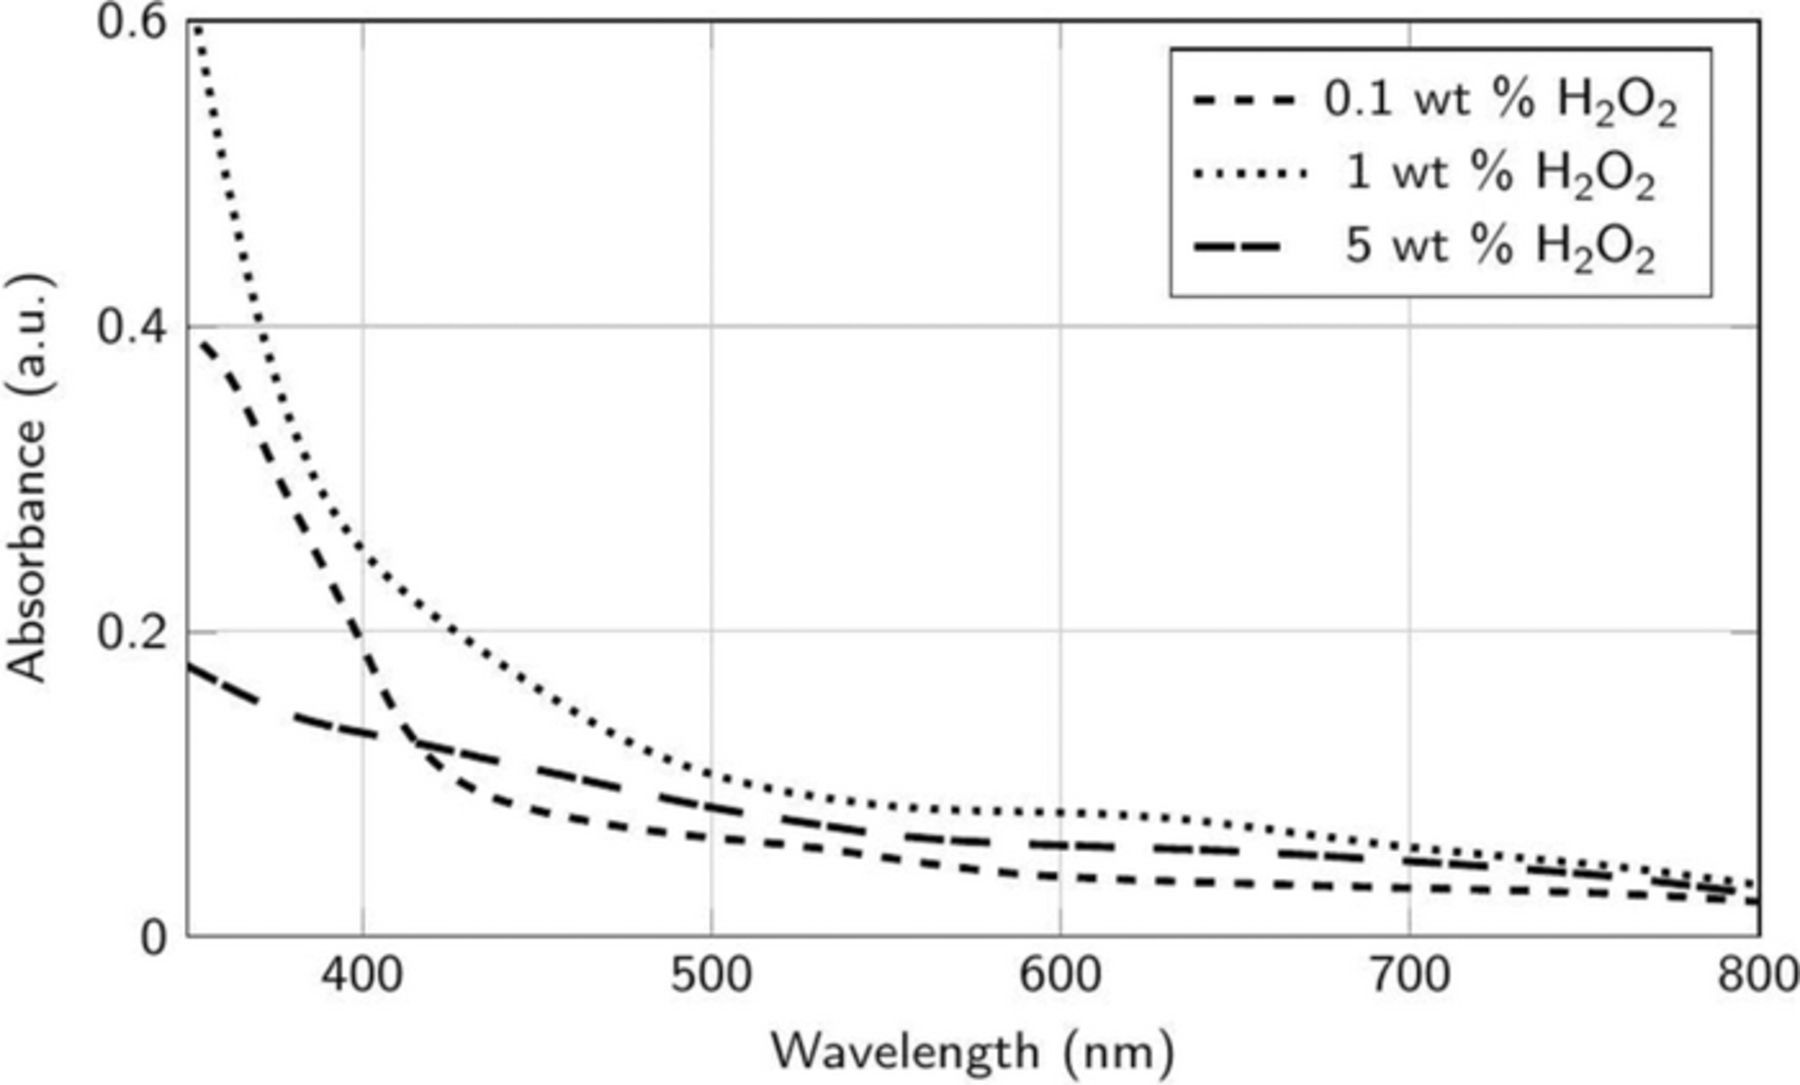
Figure 11. Absorbance spectra of the supernatant collected after the addition of ∼2 μm Co powder (∼0.1 wt%) to 50 mM citric acid in DI water at different concentrations of H2O2 at pH 8.
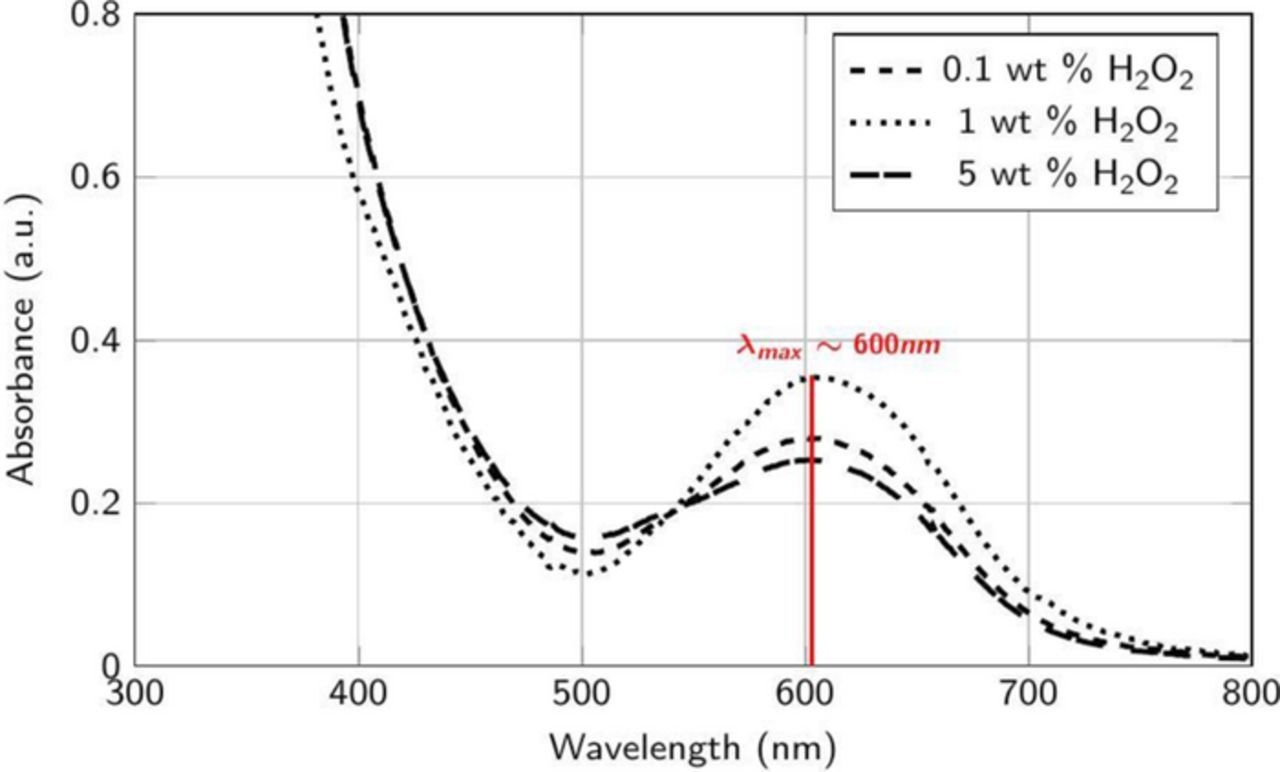
Figure 12. Absorbance spectra of the supernatant collected after the addition of ∼2 μm Co powder (0.1 wt%) and 5 mM cobalt acetate to 50 mM citric acid in DI water at different concentrations of H2O2 at pH 8.
Potentiodynamic polarization data
Figures 13 and 14 show the potentiodynamic curves of CVD Co films obtained when they are exposed to 0.1, 1, and 5 wt% H2O2 at pH 4 and 8. The icorr (corrosion current density) and Ecorr (corrosion potential) which are calculated by the standard Tafel analysis60–62 are listed in Table I. At pH = 4, the addition of H2O2 reduced the corrosion currents monotonically from ∼320 μA/cm2 with just water to ∼90 μA/cm2 with 5 wt% H2O2 and increased the corrosion potential from ∼−15 mV to ∼283 mV (see Table I). At pH = 8, the corrosion current of Co decreased similarly but from an already much lower ∼46 μA/cm2 to an even lower 6 μA/cm2 while the corrosion potential increased from ∼−500 mV to 287 mV. The decrease in the corrosion currents and increase in the corrosion potentials are due to the formation of CoO/Co(OH)2 and Co3O4 (Equations 6 and 7).

Figure 13. Potentiodynamic plots for different concentrations of H2O2 at pH 4.
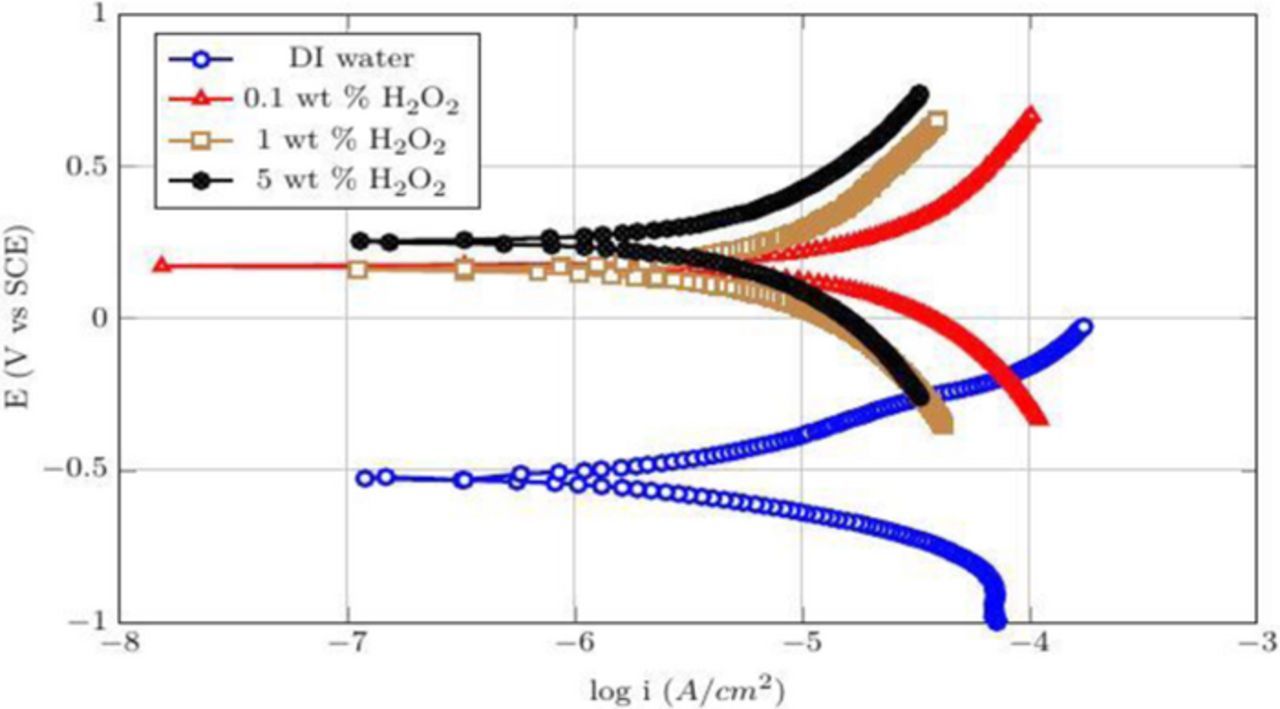
Figure 14. Potentiodynamic plots for different concentrations of H2O2 at pH 4.
Table I. The corrosion potentials and current densities for different concentrations of peroxide at pH 4 and 8.
| S. No | Composition | Ecorr (V) | Icorr (μA cm−2) |
|---|---|---|---|
| 1 | DI water at pH 4 | −0.275 | 320 |
| 2 | 0.1 wt% H2O2 at pH 4 | −0.037 | 293 |
| 3 | 1 wt% H2O2 at pH 4 | 0.192 | 220 |
| 4 | 5 wt% H2O2 at pH 4 | 0.283 | 90 |
| 5 | DI water at pH 8 | −0.5 | 46 |
| 6 | 0.1 wt% H2O2 at pH 8 | 0.185 | 20 |
| 7 | 1 wt% H2O2 at pH 8 | 0.204 | 10 |
| 8 | 5 wt% H2O2 at pH 8 | 0.287 | 6 |
However, since the potentiodynamic curves with just water at pH 4 and 8 show non-Tafel behavior, we used the linear polarization resistance (Rp)63,64 determined from potentiodynamic data obtained with the scan range limited to Eoc ± 20 mV to get a qualitative measure of the relative corrosion currents and the surface reactivity. For comparison, we also obtained the linear polarization resistance data for the citric acid + peroxide mixture at pH 4 and 8. The results are shown in Figure 15 and Table II.
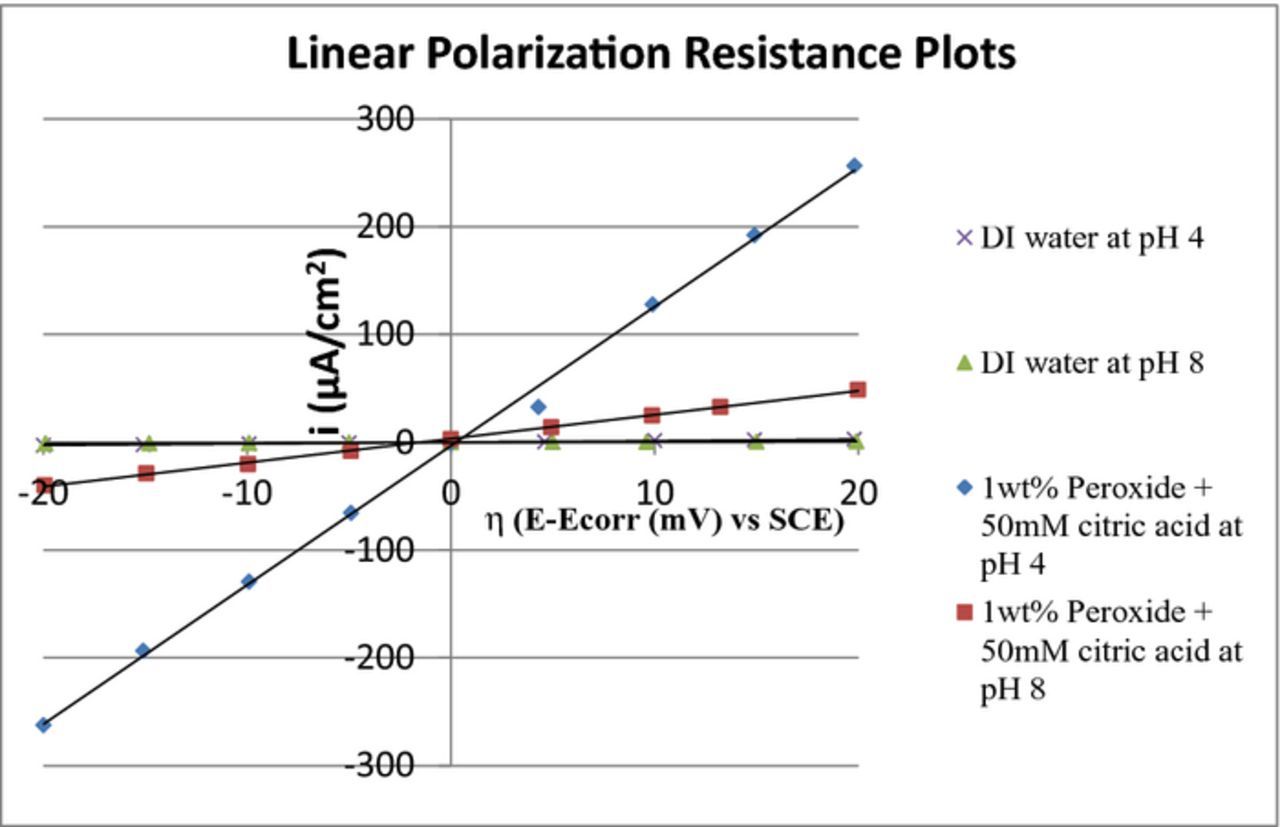
Figure 15. Plots of current (i) vs η (E-Ecorr) of Co in the voltage range of Eoc ± 20 mV at pH 4 and 8.
Table II. The polarization conductance values of Co at pH 4 and 8.
| S. No | Composition | 1/Rp (mS cm−2) |
|---|---|---|
| 1 | DI water at pH 4 | 0.14 |
| 2 | DI water at pH 8 | 0.05 |
| 3 | 1 wt% H2O2 and 50 mM citric acid at pH 4 | 13 |
| 4 | 1 wt% H2O2 and 50 mM citric acid at pH 8 | 2 |
Table III shown below summarize the Ecorr and icorr for the potentiodynamic curves of Co films shown in Figures 16 and 17 obtained when 50 mM citric acid was added to the three peroxide solutions at pH 4 and 8, respectively. The corrosion potentials increased with the addition of peroxide concentration at both pH 4 and 8 suggesting the formation of passive oxides increase with higher concentration of peroxide. At pH = 4, the corrosion current increased with the addition of peroxide to 800 μAcm−2 at 1 wt% and then decreased to 540 μAcm−2 at 5 wt% H2O2 consistent with the observed DRs (Figure 4). A similar trend was observed at pH 8. This behavior of corrosion currents suggests that at low concentrations of peroxide (0.1–1 wt%), the rate of complexation dominates the rate of oxidation enhancing the dissolution of cobalt, whereas, at higher concentration of peroxide (5 wt%) formation of passive oxides which inhibit the rate of complexation reaction and hence reduce the dissolution of cobalt. While these results support the suggestion that 3–10 wt% silica dispersion with 1 wt% H2O2 and 50 mM citric acid at pH 8 are very good candidates for polishing CVD Co films, it is also essential that the galvanic corrosion is suppressed.
Table III. The corrosion potentials and current densities for different concentrations of H2O2 with 50 mM citric acid at pH 4 and 8.
| S. No | Composition | Ecorr (V) | Icorr (μA cm−2) |
|---|---|---|---|
| 1 | 0.1 wt% H2O2 and 50 mM citric acid at pH 4 | −0.349 | 200 |
| 2 | 1 wt% H2O2 and 50 mM citric acid at pH 4 | −0.248 | 800 |
| 3 | 5 wt% H2O2 and 50 mM citric acid at pH 4 | 0.205 | 540 |
| 4 | 0.1 wt% H2O2 and 50 mM citric acid at pH 8 | 0.149 | 3 |
| 5 | 1 wt% H2O2 and 50 mM citric acid at pH 8 | 0.189 | 46 |
| 6 | 5 wt% H2O2 and 50 mM citric acid at pH 8 | 0.324 | 11 |
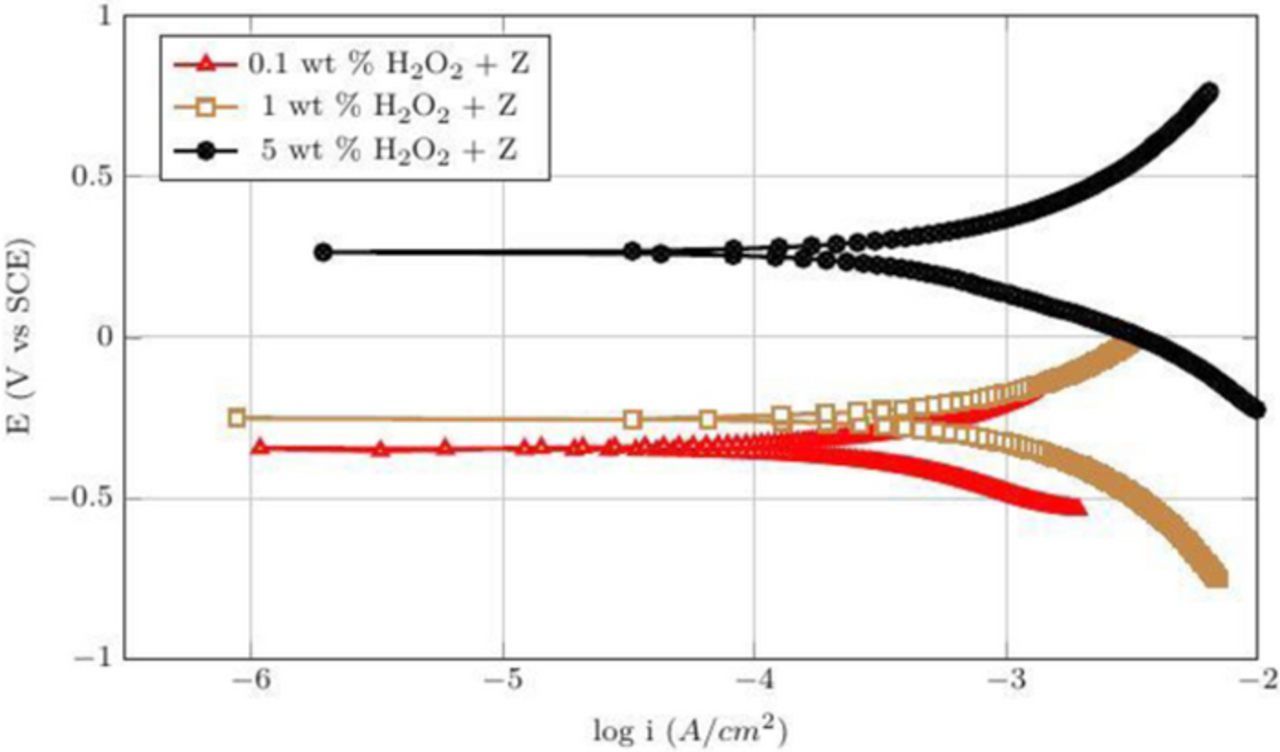
Figure 16. Potentiodynamic plots for different concentrations of H2O2 with 50 mM citric acid (Z) at pH 4.
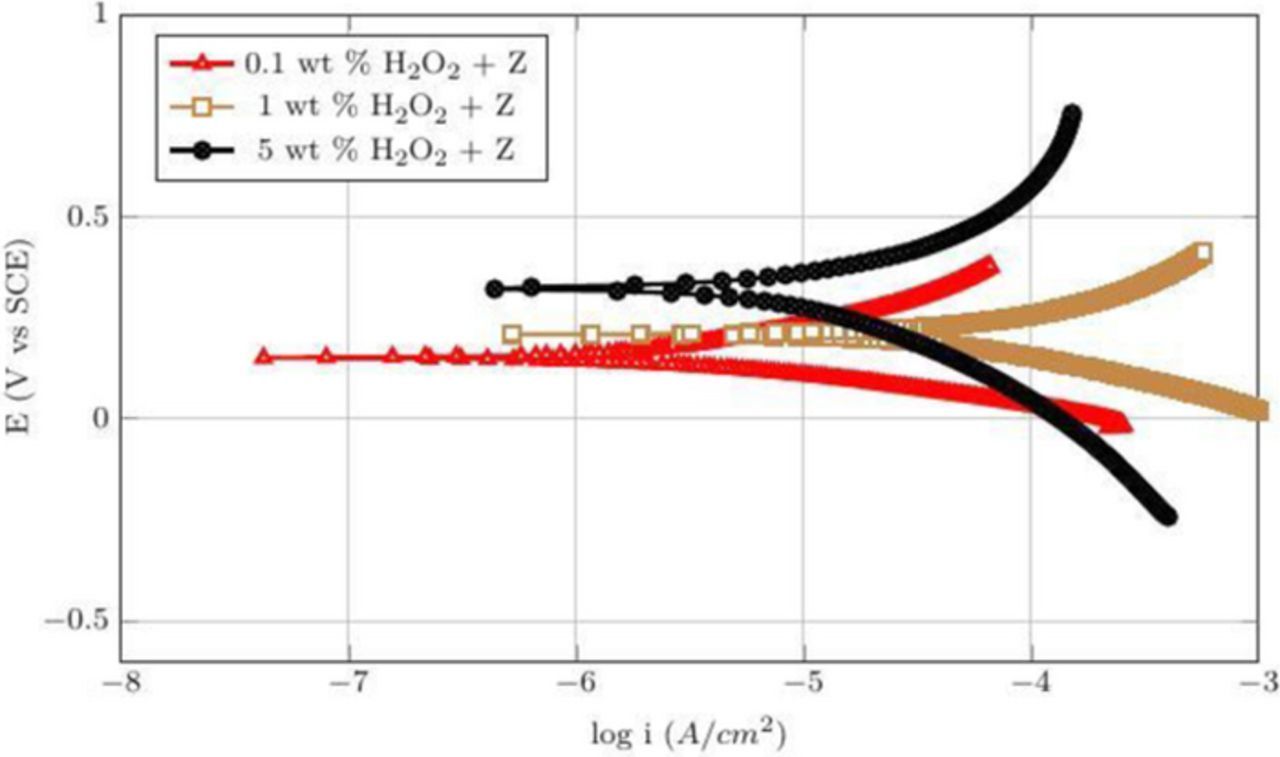
Figure 17. Potentiodynamic plots for different concentrations of H2O2 with 50 mM citric acid (Z) at pH 8.
Galvanic corrosion between Co and Ti during barrier CMP
Galvanic corrosion can occur when electrochemically different materials are electrically connected and immersed in an electrolyte. The standard reduction potentials of Co/Co2+ and Ti/Ti2+ are E° = −0.28 V, E° = −1.63 V, respectively, suggesting loss of Ti when it is in contact with cobalt. This is highly undesirable since the depletion of the already thin liner (Ti) can degrade the electrical and mechanical integrity of the interconnects and lead to device failure similar to the loss of Co when it is used as the liner in Cu interconnects. Therefore, it is necessary to control galvanic corrosion between Co and the underlying Ti liner to ensure the attractiveness of the 3–10 wt% silica dispersion consisting of 1 wt% H2O2 and 50 mM citric acid at pH 8 to satisfy the requirements for the barrier polishing step. Typically, a barrier slurry should not only control galvanic corrosion but also achieve 1:1 RR selectivity between Co and Ti and stop on the underlying low-k dielectric. The potentiodynamic data shown in Figure 18 for Co and Ti films in the presence of 1 wt% H2O2 and 50 mM citric acid at pH 8 show that the difference in their corrosion potentials is ∼270 mV which is quite high resulting in the possibility of galvanic corrosion. Therefore, since the above composition was unable to control galvanic corrosion, RRs for Ti and low-k dielectric (TEOS oxide) were not obtained.
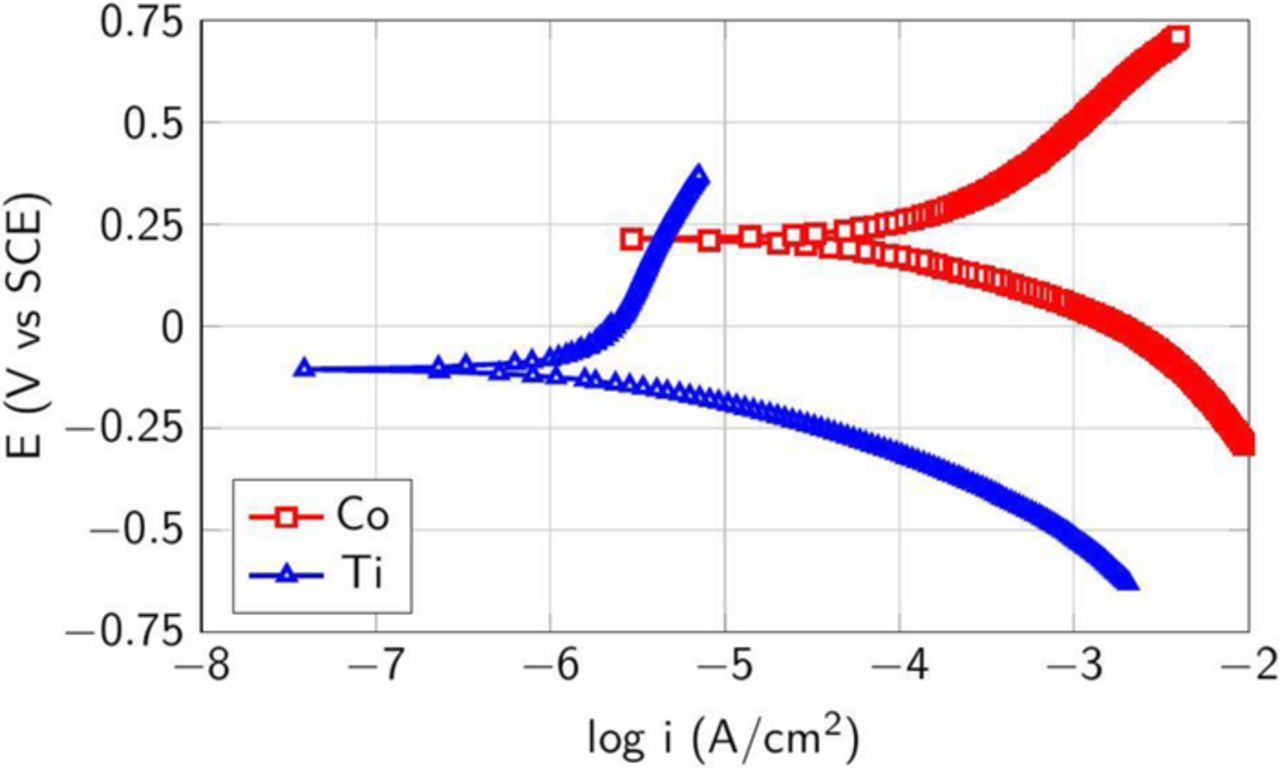
Figure 18. Potentiodynamic plots for Co and Ti in the presence of 1 wt% H2O2 and 50 mM citric acid at pH 8.
Hence, the polishing composition of 3–10 wt% silica, 1 wt% H2O2 and 50 mM citric acid at pH 8 is acceptable only for the bulk removal of Co and not for the barrier/liner CMP for Co interconnects. Therefore, we explored the effect of H2O2 concentration on the difference in the corrosion potentials for Co and Ti in the presence of 50 mM citric acid at pH 8 and the results are shown in Table IV. None of these H2O2 compositions led to a ΔEcorr for the Co-Ti couple that is acceptable.
Table IV. The corrosion potentials and ΔEcorr of Co and Ti for four different concentrations of H2O2 with 50 mM citric acid at pH 8.
| Ecorr (mV) | |||
|---|---|---|---|
| Composition | Co | Ti | ΔEcorr Co/Ti (mV) |
| 50 mM citric acid at pH 8 | −567 | −430 | 137 |
| 0.1 wt% H2O2 and 50 mM citric acid at pH 8 | 149 | −183 | 332 |
| 0.5 wt% H2O2 and 50 mM citric acid at pH 8 | 165 | −88 | 253 |
| 1 wt% H2O2 and 50 mM citric acid at pH 8 | 241 | −27 | 268 |
| 5 wt% H2O2 and 50 mM citric acid at pH 8 | 324 | 5 | 319 |
Hence, commonly used inhibitors such as 1, 2, 4 - triazole (TAZ) and benzotriazole (BTA) were evaluated for their ability to lower ΔEcorr of the Co-Ti couple. Unfortunately, aqueous solution containing 50 mM citric acid and 4 - 100 mM of the above inhibitors at pH 8 were unable to reduce the ΔEcorr of Co-Ti couple to less than 20 mV (data not presented here). Hence, testing of additional additives is necessary in order to control galvanic corrosion between the Co-Ti couple.
Conclusions
Citric acid was investigated as a complexing agent in H2O2-based silica slurries for Co CMP at different pH values. Slurry pH had a dramatic effect on both the DRs and RRs, with both decreasing with an increase in the pH and also H2O2 concentration. However, when both H2O2 and citric acid are present, the DRs and RRs increase significantly. At pH 8, using a dispersion containing 3–10 wt% silica, 1 wt% H2O2, and 50 mM citric acid resulted in reasonably high RR ∼180–500 nm/min and negligible DR ∼0 nm/min which makes this dispersion a good candidate for the bulk removal of Co while polishing Co interconnects. Electrochemical and UV-Vis spectroscopic data were used to explain the variation of RR across different pH values and led to a suggested Co removal mechanism. However, this composition was unable to control the galvanic corrosion between the Co-Ti couple, where Ti is a commonly used liner. Conventional inhibitors like TAZ and BTA were also not effective in reducing the ΔEcorr of the Co-Ti couple to less that 20 mV even at concentrations of 100 mM in the presence of 50 mM citric acid at pH 8 suggesting a need for testing other additives.
Acknowledgments
We acknowledge IBM for providing CVD Co films and NYACOL for supplying the silica slurry. We thank Chris Plunkett for equipment maintenance. S. V. Babu thanks IBM for a 2016 faculty award that partially supported this work.