
Abstract
Nitinol shape memory alloy (SMA) is a tough material to machine because it is difficult to cut. The results of the current research work demonstrate how two different electrolytes affect the electrochemical behavior in relation to electrochemical machining performance of nitinol. Potentiodynamic polarisation (PDP) and electrochemical impedance spectroscopy (EIS) tests have been conducted using 0.1 M H2SO4 and mixed 0.1 M H2SO4 + 0.1 M citric acid electrolyte. Further, the experimental investigation on the machining characteristics of nitinol during wire electrochemical machining (WECM) has been conducted. It is revealed that the grooves width and depth increase with increase in applied pulse voltage and surface roughness increase with increase in groove depth. The minimum width overcut of machined groove was 18.10 μm in 0.1 M H2SO4 + 0.1 M citric acid at 5 V pulse voltage which is less compared to width overcut of 24.85 μm produced in 0.1 M H2SO4 electrolyte for same parametric machining condition. This specific mixed electrolyte produced average surface roughness (Ra) of 0.0631 μm at 5 V which is lower compared to 0.09055 μm produced using 0.1 M H2SO4 electrolyte. The fabrication of homogeneous average slit width of 92.234 μm using citric acid mixed H2SO4 electrolyte with minimum average surface roughness (Ra) of 0.0691 μm shows the capability of WECM.
Export citation and abstract BibTeX RIS

This is an open access article distributed under the terms of the Creative Commons Attribution 4.0 License (CC BY, http://creativecommons.org/licenses/by/4.0/), which permits unrestricted reuse of the work in any medium, provided the original work is properly cited.
Nitinol, which gets its name from the two main metals that make up the material—nickel (Ni) and titanium (Ti)—was first discovered at the Naval Ordinance Laboratory (NAL). It has many advantages, including high strength, excellent damping properties, good biocompatibility, low density, high corrosion resistance, and the unique characteristics of thermally and mechanically induced superelasticity and shape memory effect. Nitinol is a smart material of choice for making biomedical devices like cardiovascular stents, catheter tubes, needles, guide wires, filters, dental files, and arch wires as well as other surgical instruments, aerospace and automotive industry applications. Nitinol is an intermetallic compound that, when nickel and titanium combined in equiatomic proportion, speeds up the transition between the martensite and austenite phases. The performance of nitinol micro-features that have been manufactured is mostly dependent on the surface state which is caused by surface reconstruction of the local crystal due to surface tension, surface defects and passivating molecules. Currently, the complicated biomedical components are often manufactured using laser machining or WEDM for micromachining of nitinol. However, these machining procedures result in heat damage to machined micro-features' surfaces, generating HAZ and recast layers, which results in poor surface quality and lowers the functionality of the microfeature. Therefore, the surface quality improvement plays very important role for maintaining the properties of machined micro-features for biomedical applications. As is well known, electrically conductive materials are typically machined using the WECM method. It is discovered that because of the special material qualities, machining nitinol without altering original properties is a bit challenging.
The acidic H2SO4 electrolyte performed the best among the investigated electrolytes in terms of a larger MRR and a lower surface roughness. However, it is an extremely corrosive acid that, even at modest concentrations, can result in secondary burns and serious chemical burns. Long-term inhalation of low amounts of substances can have harmful consequences on human health. A complex machining chamber and an electrolyte filtering unit are necessary to contain H2SO4 toxicity during the WECM process, which will ultimately increase the cost of the machining. The researchers have investigated methods that involve adding an additive to a primary electrolyte. Hence, citric acid working as complexing agent mixed with the H2SO4 electrolyte to reduce the challenges and other harmful consequences of using H2SO4 electrolyte. This method entirely eliminates the sludge while also reducing the creation of thick oxide layers. Because they create soluble complex products with metal ions, these additives are known as complexing agents.
Rakesh Chaudhari et al. (2020) investigated the surface integrity of a sample achieved by WEDM of nitinol at optimal parameter values. 1 Kishan Zadafiya et al. (2021) presented that the characterization of high-temperature SMA's has received comparatively little attention. Due to different unpredicted phenomena, including the appearance of residual stresses, elevated temperatures during machining, and the production of the recast layer, the uses of SMAs are restricted. 2 James Wamai Mwangia et al. (2019) has reviewed on production and fabrication of micro features of nitinol for medical use. 3 For the purpose of researching the impacts of pulse voltage on the fundamental properties, nitinol was processed in a LiCl-ethanol solution. Wide etching patterns were seen, with typically rough surfaces. 4 For investigating nitinol machinability characteristics, electrochemical (EC) polishing was carried out using aqueous electrolytes prepared of 17.8 M of H3PO4, 14.6 M of H2SO4, and neutral electrolytes prepared of 1.5 M of NaNO2 and 0.1 M of Na2C4H4O. 5 The microstructures were created in NiTi alloys using ethanol as the water-free electrolyte to minimize the production of TiCl4 oxide layer. However, if too much ethanol was injected, it had an impact on the surface quality and precision of the machining. 6 Rutvij Kulkarni et al. (2021) studied the impact of constrained groove pressing which causes an increase in shear and deformation bands, grain boundaries and deteriorates nitinol corrosion resistance. 7 Yuebin Guo et al. (2013) focused on surface characteristics in EDM of nitinol and compared with milling. When milling at a high feed rate, large burrs occur, whereas EDM creates surfaces without burrs but resulted in thick white layers due to heat which can be reduced using an EDM finish trim cut. 8 G. Ebenezer et al. (2021) studied electrochemical behavior of machined Ni55Ti45 alloy by wire electro spark erosion techniques by considering different process parameters and the surface of the corroded specimens considering NaCl as a electrolyte solution. 9
Xin-Zhou Maa et al. (2013) fabricated 3D microstructures using confined layer technique on Nitinol by HF and HNO3 electromagnetic etching and NaOH scavenger by optimizing the electrolyte composition. 10 Natalia Isabel de Azevedo Lopes et al. (2017) studied different parameters for electrolytic polishing of nitinol wire in both the elastic and shape memory states using 3.5 Mol l−1 methanolic H2SO4 electrolyte solution at 20 °C. 11 Mouli Prasanth B et al. (2021) evaluated 3D surface roughness of nitinol in EMM and found composite electrolyte more suitable for best surface integrity compared to other electrolytes. 12 Shi Hyoung Ryu (2015) investigated eco-friendly ECM characteristics for drilling and milling SS304 using micro wire and micro foil in C6H8O7 electrolyte solution. 13 Shouye Li et al. (2019) proposed EC polishing method in phosphoric acid and ethanol as electrolyte in microgrooves fabrication with improvement in flushing. 14 Zhao Han et al. (2022) trimmed WEDM surface to obtain smooth surface without a recast layer using wire electrochemical trimming on Rene 88DT for aerospace applications which shows the capability of this process to fabricate parts without any processing defects. 15 To explore the machining properties, nitinol micro-grooves were produced using short pulse ECM. 1.5M NaNO2 and 0.1 M Na2C4H4O6 were employed as the electrolytes to dissolve the SMA in order to prevent the precipitation of Ni(OH)2 when utilizing only NaNO2 as the electrolyte. 16 According to Vyom Sharma et al. (2020), WECM is established to be a feasible process for micromachining. 17 Naresh Besekar et al. (2022) compared different insulation methods for reducing stray current and overcut during wire electrochemical machining and found PTFE tube insulation method as a best amongst others. 18 Further, Naresh besekar et al. (2021) experimentally investigated vibration assisted axial nozzle jet WECM which has proven more effective due to efficient mass transport capability during machining process. 19 Abhijeet Sethi et al. (2022) studied EC dissolution of WC-Co Micro tool in WECM using mixed citric acid + NaNO3 electrolyte and obtained better surface finish. 20 Jung-Chou Hung et al. (2021) attained high-precision WECM finish by cutting fine slot into the nickel–titanium wire. 21 Yongqi Wang et al. (2022) investigated the effect of an environmentally friendly sodium chloride–glycol–ethanol electrolyte on the surface morphology and biocompatibility of nitinol cardiovascular stents. 22
With a variety of complexing agents, such as phosphoric, hydrochloric, acetic, oxalic, tartaric, citric, salicylic, and EDTA, Nitinol can form complexes. However, to get mixed sulphuric acid (H2SO4) + citric acid (C6H8O7) electrolyte for this experiment, citric acid is utilized as a complexing agent. The natural organic citric acid, which is a member of the carboxylic acid family, is frequently employed as a preservative and flavoring in the food business. It occurs naturally in citrus fruits and is frequently utilized as a secure and environmentally friendly substance. As a result, the combined electrolyte is kept environmentally friendly by mixing citric acid with H2SO4. For a steady machining process with an appropriate machining rate in such a narrow inter-electrode gap (IEG), the complicated electrolyte generates fewer insoluble by-products. This study seeks to look into the surface morphology of nitinol in relation to the H2SO4 electrolyte and complexing agent of environmentally friendly citric acid electrolyte. The performance of nitinol has been electrochemically characterized using Potentiodynamic Polarization (PDP) tests and Electrochemical Impedance Spectroscopy (EIS) in 0.1 M H2SO4 and mixed 0.1 M H2SO4 + 0.1 M citric acid electrolyte solutions to assess the viability of its applications. PDP tests are carried out for getting important helpful information regarding corrosion mechanisms, corrosion rates and susceptibility of nitinol material to corrosion in these selected combinations of electrolytes. EIS tests have been conducted to obtain important data related to corrosion rate, polarization resistance and capacitance which further helps to determine the machining characteristics of nitinol in these electrolytes using wire electrochemical process.
Additionally, during WECM of nitinol, for the machined microgrooves, an examination of surface roughness with groove depth and width overcut has been done. These investigations' findings have been evaluated, and it has been highlighted how changes in electrochemical behavior are caused by micro structural variables. Finding the best and most efficient settings for machining nitinol with improved accuracy and high surface integrity was the main outcome of this work. The experimental findings indicate that the wire electrochemical machining performance has significantly improved, which could assist to lessen the negative effects of using nitinol micro features that have been created. A conclusion that can be drawn from the literature analysis and preliminary experimental findings is that wire electrochemical machining may efficiently remove hard to machine work materials with high surface integrity. The aforementioned studies encouraged the production of nitinol microstructures using wire electrochemical machining while examining the machining and surface integrity of the process.
Materials and Experimental Details
For electrochemical characterization of nitinol, a standard three electrode configuration was used to perform cyclic potentiodynamic polarization tests and EIS as shown in Fig. 1. The Metrohm Autolab electrochemical workstation was used to conduct electrochemical analyses of the test samples. Before performing polarization tests, test specimens were carefully washed with distilled water after being placed in acetone for one hour. In this electrochemical workstation, test specimens are fixed by using a screw-type mechanism. In an effort to examine how surface integrity affects corrosion behavior, no specimens were passivised prior to corrosion testing.

Figure 1. Schematic of potentiodynamic and EIS test setup.
Download figure:
Standard image High-resolution imageIn order to suit the anode size of 15 mm × 15 mm × 1 mm for corrosion testing, test specimens were made to that size. The working electrode for EIS and PDP testing was a nitinol specimen, whereas the reference and counter electrodes for those tests were Ag/AgCl cells. The curve was generated by scanning at a rate of 10 mV s−1. A condition known as Open Circuit Potential (OCP) was used for the EIS measurement. Standard Nyquist and Bode charts are used to present the results.
Using the EIS analyzer programme, the precise parameters for the EIS observations were determined. The electrolyte solutions of 0.1 M H2SO4 and mixed 0.1 M H2SO4 + citric acid were utilized for electrochemical testing. To account for repeatability, PDP tests and EIS were carried out on two samples. The ASTM standard G61 was used to determine the susceptibility to localize corrosion on Nitinol with a value of current cutoff as 5 mA. The measurement has been stopped when the potential reaches the corrosion potential.
Due to the wire electrode's side cross-section, WECM machining kinematics differs from those of other ECM techniques. It was laborious to integrate a hardware and software system. For the successful adaptation of this system in the various manufacturing industries, an attempt has been made in the current research to design and develop the full-fledged WECM system that will be more affordable, adaptable, and economically viable in comparison to other existing non-conventional machining methods. The tool holding and feeding unit and the workpiece mounting unit are just two of the functional components that have been added to the mechanical machining unit. A tool holding device fabricated from acrylic material is developed and attached to the Z axis of stage. The tool is positioned on an XYZ translation stage with a resolution of 0.1 μm and a total travel distance of 100 mm for each axis. Because portions of this unit will always be submerged in the corrosive working fluid like electrolytes, the workpiece mounting unit is also made of acrylic material because it has resistance to electricity and corrosion. With the aid of two tiny screws and clamps in the housing, there is a provision for tightly retaining the workpiece. The positive terminal of the power supply system is connected to one of these two screws via the workpiece, while the negative terminal is connected to the wire electrode. The machining table is securely fastened to the rigid stand. The flow control valve connects the main machining chamber, which houses the workpiece, to the electrolyte chamber, and a rotameter is coupled to the flow system to monitor the flow rate of the electrolyte flowing from the flexible hose pipe to the machining chamber to carry out WECM operation. By taking into account the largest workpiece that can be accommodated as well as the economical and prudent use of working media, the chamber size is kept at its ideal level. A pump with a filter and a flow control valve is used during the WECM process to maintain a regulated flow of electrolyte. When doing WECM, the electrolyte is employed as the working medium, and the wire electrode tool is simply dipped into it before moving forward to perform the machining. Because micromachining requires a different power supply rating, a separate power supply device is needed. A pulsed DC power supply (Matsusada DOA75) is employed to keep the polarity consistent during WECM. The primary input power supply line is a 3-Phase, 440 V AC line. With the use of a pulsed power source, the input voltage was lowered and converted from AC to DC. The power supply is readily available and offers a voltage range of −75 to + 75 V, a current rating of up to 4 A, and a maximum power output of 300 W. A pulse generator device is used to produce the necessary types of pulses. To determine the pulse's nature and to keep track of the machining circumstances, a function generator (Tektronix AFG1022) is utilized. On an in-house developed experimental WECM system, all of the experiments were conducted and data has been analyzed. In order to determine the best electrolyte for machining, two distinct electrolytes were selected, including an inorganic acidic aqueous solution and a mixture of an inorganic and environmentally friendly organic acidic solution.
All of the tests for the machining of nitinol employed 0.1 M H2SO4 and mixed 0.1 M H2SO4 + 0.1 M environmentally friendly citric acid as the electrolyte. Wire EDM was used to cut the workpiece material into a rectangular sheet, which fit inside the confines of the machining chamber. The workpiece used for experimental investigation was made of nitinol (Martensite below 80 °C, Heat treatments for 30 min at 550 °C–750 °C; water quench, 80 °C to 10 °C for activation). For the purposes of this investigation, a tungsten wire electrode with 50 μm diameter was taken into consideration. An initial IEG of 50 μm has been maintained between the wire electrode (cathode) and the workpiece (anode) throughout the whole experiment. Using the proper techniques with the applications of scissors, tongs and clamping devices without touching hands to the wire tool, the wire was placed into the tool holder with proper tension so that it should be vertically straight throughout the experimentation without more tightness and looseness. The workpiece and wire have been held at vertically straight position for fabricating linear micro grooves on nitinol. The wire electrode was fed linearly while the arrangement was held still. The fixture and the workpiece were both immersed into the electrolyte bath. Figure 2 shows the indigenously developed experimental setup used to carry out the machining of nitinol shape memory alloy during wire electrochemical machining. The flushing is provided with small frequency and amplitude PZT vibration at constant axial flow rate for efficient removal of dissolved products from the machining zone. The machine is featured with continuity setting for micro-sparks recognition using Tektronix TBS 2000 series digital oscilloscope. The elemental composition of the nitinol before machining used for fabrication of microgrooves was presented through SEM, EDS and 3D surface as shown in Fig. 3.
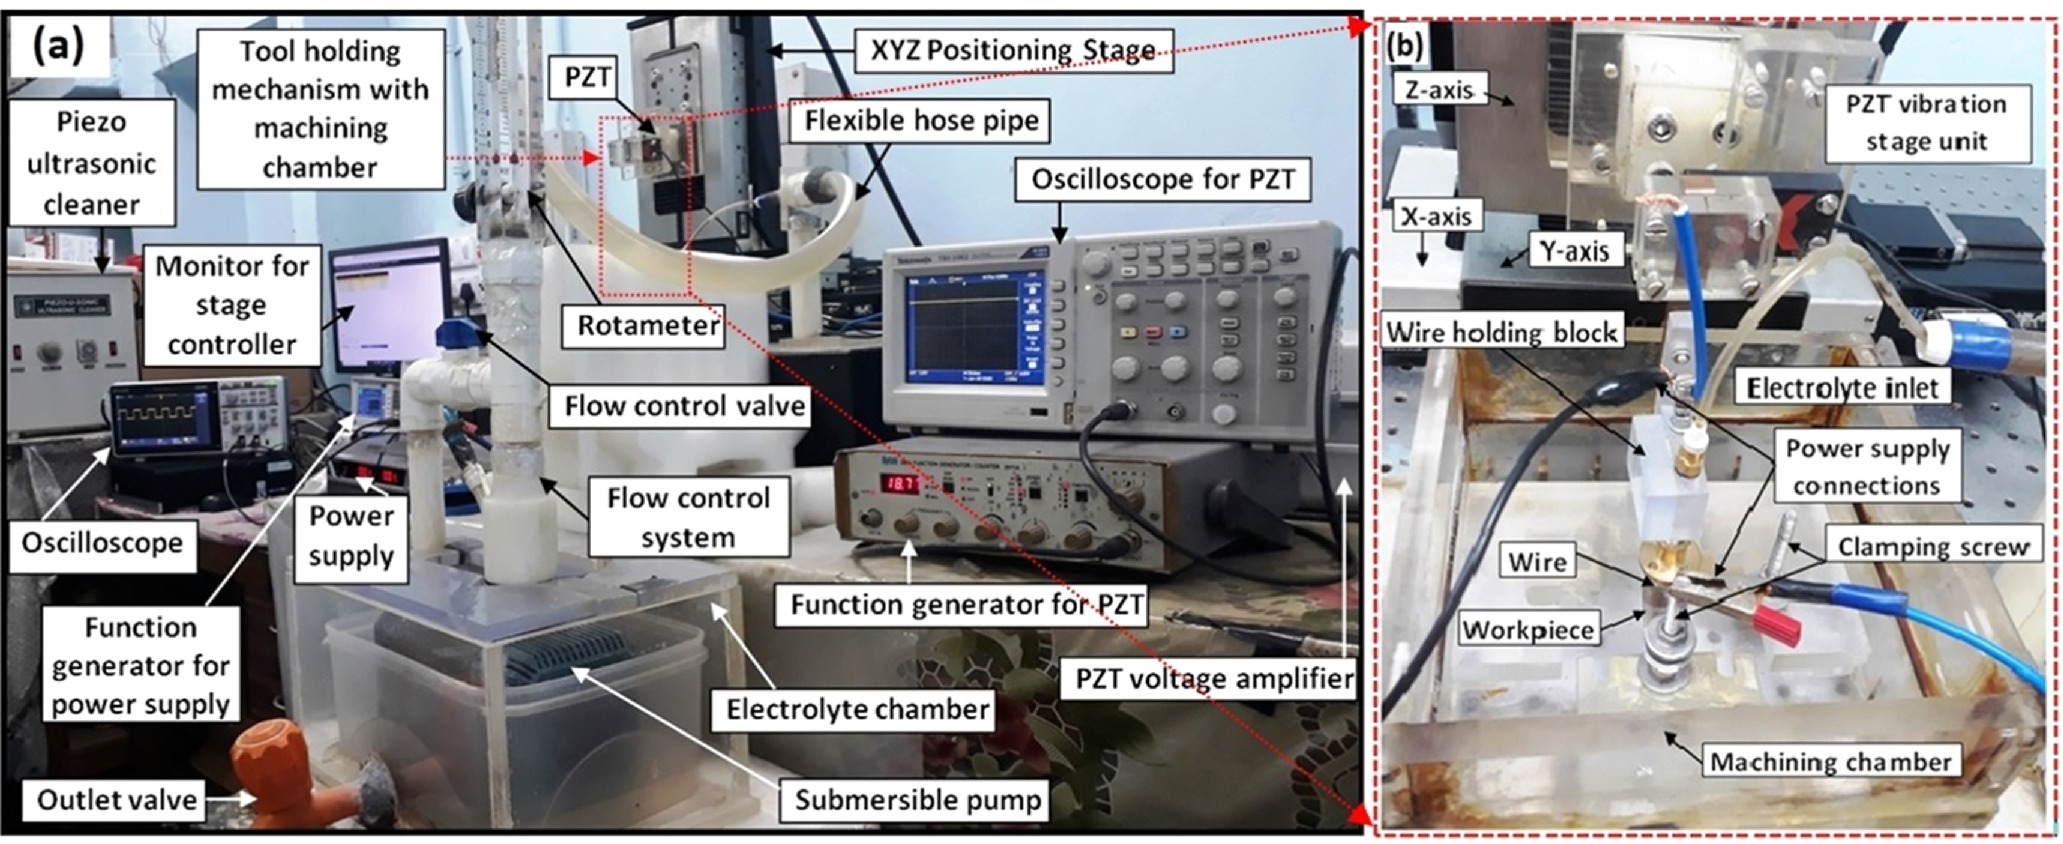
Figure 2. WECM experimental setup (a) Main machining unit (b) Tool holding mechanism with machining chamber.
Download figure:
Standard image High-resolution image
Figure 3. Elemental composition and surface roughness of the fresh non-machined 1 mm thick nitinol sample (a) FESEM image, EDS diagram and all elements composition on the surface of sample (b) 3D surface profile image with 4.076 μm surface roughness (Sa) measured with CCI prfilometer.
Download figure:
Standard image High-resolution imageTo determine the appropriate input process parameters, such as pulse voltage, duty ratio and wire feed rate, a broad variety of trial experiments were carried out for fabrication of micro grooves. Table I displays every WECM parametric conditions that were applied to create the micro grooves.
Table I. Process parametric conditions.
| Sr. no. | Process parameters | Nature | Range |
|---|---|---|---|
| 1 | Electrolyte concentration | Fixed | 0.1 M |
| 2 | Applied pulse voltage | Variable | 6 to 8 V |
| 3 | Wire feed rate | Variable | 1.2 to 1.8 μm s−1 |
| 4 | Pulse frequency | Fixed | 250 KHz |
| 5 | Duty ratio | Variable | 35 to 50% |
| 6 | PZT vibration frequency | Fixed | 25 Hz |
| 7 | PZT vibration amplitude | Fixed | 12.54 μm |
| 8 | Flow rate | Fixed | 5 lPh |
| 9 | Electrode wire diameter | Fixed | 50 μm |
Additionally, the noncontact type CCI profilometer made by Taylor & Hobson was used to measure the depth of the groove and the surface roughness of the machined micro groove. This technique provided 3D surface roughness data for the surfaces, and a Lieca optical microscope was used to determine the groove width.
Results and Discussion
In this section, the polarization studies using PDP tests and EIS, experimental results, interpretation and the performance characteristics have been discussed thoroughly to explore the surface integrity. After conducting wide range of trial experiments and obtaining best possible parameter combinations, the machined microgrooves have been vigilantly examined. To discover the outcome of 0.1 M H2SO4 and mixed 0.1 M H2SO4 + 0.1 M citric acid electrolyte on machined micro-groove dimensions i.e. width and depth as well as surface characteristics; the results have been discussed hereunder.
Electrochemical characterization
Potentiodynamic polarization tests
The potentiodynamic polarization (PDP) investigation has been carried out on Nitinol shape memory alloy (SMA), and the resulting voltammograms as per the ASTM standard are shown in Fig. 4 as polarization curves created by two different electrolytes and their consequences. For Nitinol, two distinct electrolytes i.e. 0.1 M H2SO4 and mixed 0.1 M H2SO4 + 0.1 M citric acid electrolyte were used in the corrosion investigations. The electrolyte conductivity plays very important role in all electrochemical experiments, especially in the cyclic polarization technique. The externally polarized current-potential behavior of a metal near its corrosion potential gives an excellent estimate of the rate of corrosion.
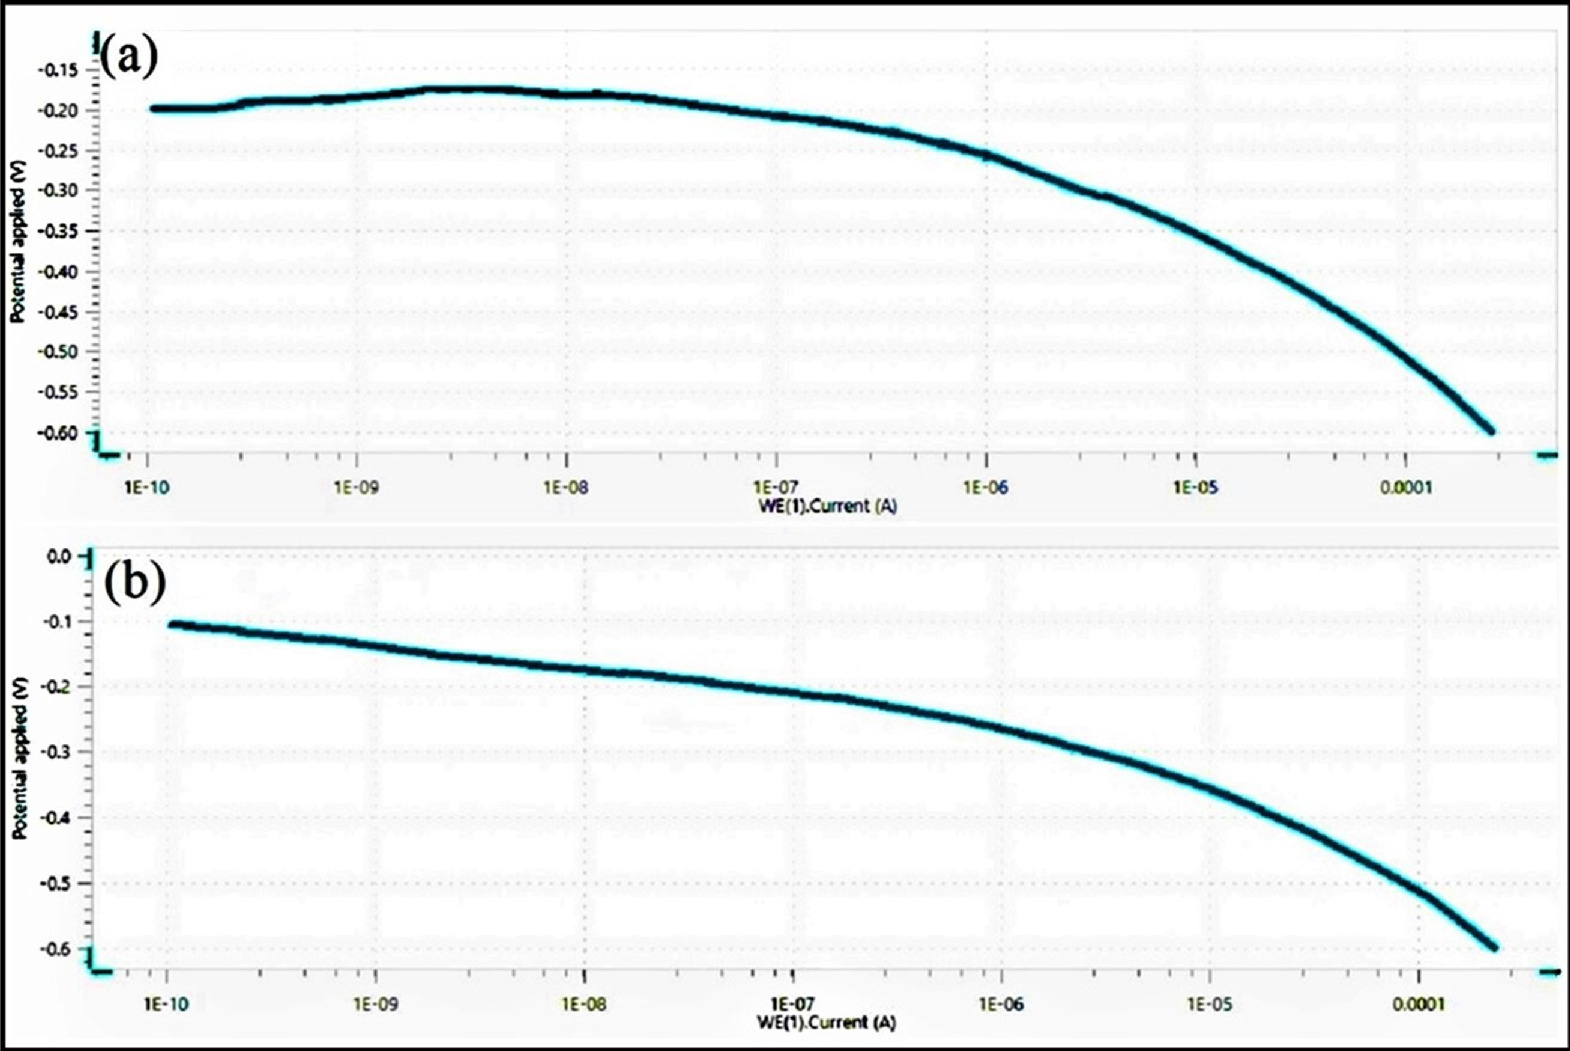
Figure 4. Voltammogram of (a) 0.1 M H2SO4 (b) Mixed 0.1 M H2SO4 + 0.1 M citric acid electrolyte.
Download figure:
Standard image High-resolution imageThe polarization curve depicts corrosion potential against current and the influence of these electrolytes on Nitinol propensity to localized corrosion has been studied.
It is evident from the ensuing voltammograms in both PDP tests that localized corrosion is not present under either electrolyte state, but uniform corrosion in the transpassive or oxygen evolution zone may occur. These graphs show that Nitinol is more resistant to the start and spread of localized corrosion, assuming that the corrosion potentials of nitinol in both the electrolyte obtained at a fixed scan rate in these tests are similar or having negligible difference. The voltage at which the anodic current grows quickly in this test method indicates the vulnerability to the start of localized corrosion.
The test results reveals that the corrosion potential shifted towards the anodic forward direction with decrease in corrosion current as the surface roughness decreased without significant difference in cathodic currents among both the nitinol samples with different surface roughness in different electrolyte due to the different anodic behavior of the alloy. The specimens in 0.1 M H2SO4 electrolyte showed increase in the anodic current compared to mixed 0.1 M H2SO4 + 0.1 M citric acid electrolyte which may be responsible for increase in surface roughness due to increase in corrosion rate. The decrease in surface roughness occurs with lower corrosion rate and very high corrosion rate results in pitting resulting in rougher surface. It shows that the higher roughness corresponds to a lower pitting potential. The passive oxide layer can form due to formation hydroxide and gas bubbles. The overall surface-to-electrolyte contact area is greatly reduced by the heterogeneous interface that forms between the solution and the surface, which significantly slows down corrosion. The corrosion current of 1 × 10⁻¹⁰ A is achieved with the acidic H2SO4 electrolyte, which is identical to the mixed 0.1 M H2SO4 + 0.1 M citric acid electrolyte, but this mixed electrolyte reached the corrosion potential of −0.1 V, which is higher. This test demonstrates the acidic H2SO4 electrolyte's excellent active dissolution process. It demonstrates that the controlled dissolution of Nitinol with low current of mixed 0.1 M H2SO4 + 0.1 M citric acid electrolyte gives lower corrosion rate, further improving the surface roughness which has been measured using CCI profilometer. Among the selected electrolytes, 0.1 M H2SO4 electrolytes have been discovered to be the most corrosive solution. Due to a low passive current and a greater potential, Ni ions present in electrolyte show a lesser tendency to corrode when used in an electrolyte solution containing mixed 0.1 M H2SO4 + 0.1 M citric acid. It was discovered that the composition of the electrolyte caused differences in the passive zone of the polarization curves of various electrolytes. The anions present during process have considerable effect on the corrosion behavior of nitinol. The polarization study suggests that mixed 0.1 M H2SO4 and citric acid electrolyte solution may effectively machine nitinol. In contrast to other electrolytes, 0.1 M H2SO4 in the presence of citric acid electrolyte can be used to generate the smooth surface. The surface topography in the solution of 0.1 M H2SO4 electrolyte and mixed 0.1 M H2SO4 + 0.1 M citric acid, as shown in Figs. 5a and 5b.

Figure 5. Surface roughness after PDP at (a) 0.1 M H2SO4 (b) 0.1 M H2SO4 + 0.1 M citric acid.
Download figure:
Standard image High-resolution imageTo achieve high surface quality, the citric acid solution serves as a safe organic acidic electrolyte. According to the findings of the potentiodynamic tests, the surface roughness of the nitinol sample in mixed 0.1 M H2SO4 + 0.1 M citric acid electrolyte solution was Sa = 0.5100 μm, which is much less than the surface roughness Sa = 0.7393 μm of 0.1 M H2SO4 electrolyte solutions. Thus, it is considered that the electrochemical machinability of the nitinol alloy is better in mixed electrolyte.
Electrochemical impedance spectroscopy
The working electrode i.e. nitinol is applied a modest amplitude sinusoidal voltage across a broad frequency range in electrochemical impedance spectroscopy (EIS) using.1 M H2SO4 and mixed 0.1 M H2SO4 + 0.1 M citric acid electrolyte. Another sinusoidal signal with amplitude (I) and a phase shift in relation to the input signal is produced at each frequency. The imaginary component (Z'') is shown against the real component (Z') for each excitation frequency in an EIS data Nyquist plot as shown in Figs. 6a and 7b. Plots of Bode-magnitude and Bode-phase enable analysis of absolute impedance as shown in Figs. 6b, 6c and 7b, 7c The notion of constant phase element (CPE) may be applied to the modeling of an electrical double layer to correct the capacitor's non-ideal behavior. As illustrated in Figs. 6d and 7d, the surface-deposited double layer capacitor is linked in parallel with the polarization resistor (Rp), which is coupled in series with the bulk resistor (Rs). An electrochemical system analysis starts with this model. The resistance of Rs moves the semicircle's beginning point to higher Z' values in the Nyquist plot of a basic Randles cell. The polarization resistance is also represented by the semicircle's diameter. The equivalent circuit's Rs, Rp, and CPE component is fitted to the semicircle, which represents the rapid oxidation and reduction kinetics. The amount of the current during the polarization of nitinol as working electrode is governed by reaction kinetics. The lower corrosion current results from higher polarization resistance. When an electrode's potential is deviated from its value at corrosion potential, the electrode becomes polarized. Due to electrochemical processes that are triggered at the electrode surface by the polarization of an electrode, current flows. Nitinol alloys with high polarization resistance Rp have good corrosion resistance, whereas those with low Rp have low corrosion resistance. During an electrochemical reaction, the roughness values are low at strong corrosion resistance and a drop in corrosion rate. A smart way to manage corrosion, incidentally, is to increase the solution resistance since a reduction in corrosion current results in a reduction in corrosion rate. In this approach, the solution resistance (Rs) is obtained from the high-frequency intercept of real impedance, and the sum of Rs and Rp is obtained from the low-frequency intercept. When Rp is known, the Stern-Geary equation may be used to calculate the metal corrosion rate.

Figure 6. EIS of 0.1 M H2SO4 electrolyte.
Download figure:
Standard image High-resolution image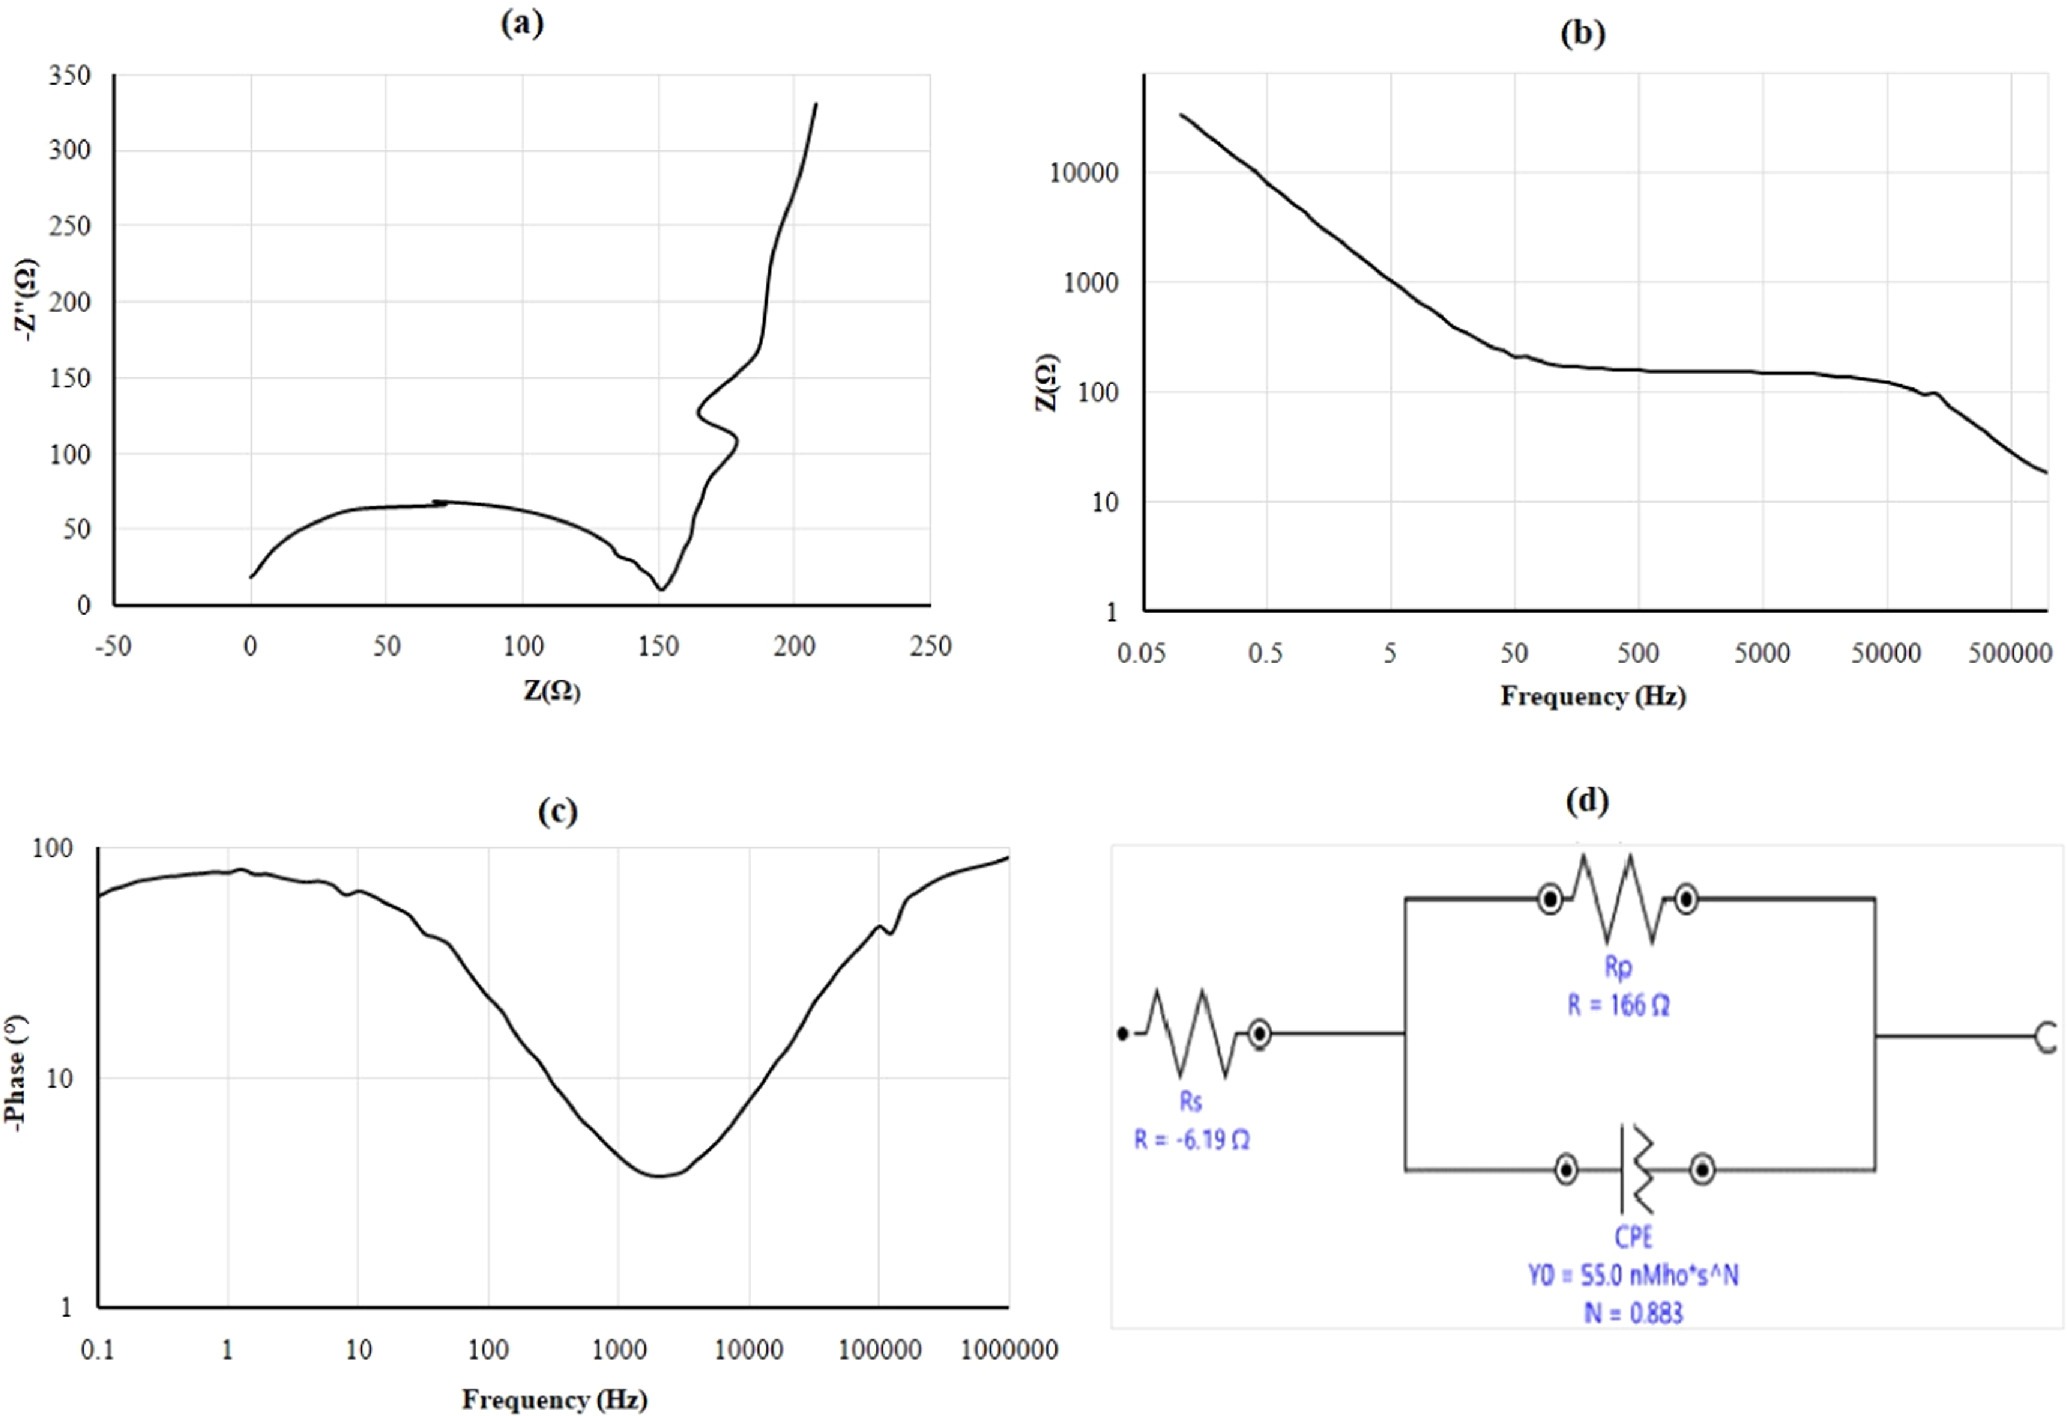
Figure 7. EIS of mixed 0.1 M H2SO4 + 0.1 M citric acid electrolyte.
Download figure:
Standard image High-resolution imageTo confirm the conclusion drawn in the EIS section, the polarization resistances (Rp) were determined and examined using the Nyquist and Bode plots as can be shown in Figs. 6 and 7. The potentiodynamic tests order of the polarization resistances and the EIS findings order of the resistances accord with one another. A qualitative indicator of corrosion resistance is the capacitive loop's diameter in the Nyquist plot; a greater diameter denotes stronger corrosion resistance for nitinol in respective electrolytes. It shown that for the case of metal under corrosive conditions, the resistance behavior predominates in the low frequency zone and that the Bode impedance values at low frequency may be used as a gauge of the corrosion resistance. The EC system was modeled using comparable electric circuits in order to support this result and quantify the corrosion behavior of the nitinol samples in both electrolytes. The ideal circuit for each sample was chosen using the Nyquist and Bode plots of each circuit. In order to account for the electrolyte behavior and the resistance of the oxide layer, each circuit contains CPE and Rs causes a potential drop between the working electrode i.e. nitinol and reference electrode i.e. Ag/AgCl cell causing errors and Rp behaves like a resistor. The polarization resistance of the nitinol sample in 0.1 M H2SO4 electrolyte was 123 Ω is improved to 166 Ω when compared to the nitinol sample in 0.1 M H2SO4 with citric acid electrolyte. It is evident from the values of the resistances Rp and Rs that the corrosion resistance of the Nitinol sample dissolute in 0.1 M H2SO4 electrolyte is significantly lower than that of the 0.1 M H2SO4 and citric acid electrolyte.
The values of the CPE can be dependably utilized to detect the thickness of the oxide film. The sample which shows the highest resistance also has the lowest oxide layer thickness. The interpretation for this inconsistency is the porous oxide film leading to surface area larger than the geometric area. It shows that the nitinol using mixed 0.1 M H2SO4 + 0.1 M citric acid electrolyte has lower oxide layer thickness which is responsible for uniform anodic dissolution.
The EIS findings are consistent with the fact that the corrosion resistance of the nitinol alloy is linked to the development of a tough titanium oxide layer on the surface. The Bode plot in the high frequency region showed very low values of phase angle near to 0°. The layer is displaying pure capacitive behavior when the phase angle is near to 90° in the low frequency band. The Bode-phase charts, where the greatest phase angle obtained was around 90°, show a considerable amount of departure from perfect capacitive behavior. The changes in electrolyte conductivity are to blame for variations in the passive oxide layer's resistance. The changes in the surface's roughness are what caused the observed increase in corrosion resistance. The results of frequency response study are connected with the electrochemical process model at the corrosion system interface. The most common way to describe that concept is in terms of an electrical equivalent circuit. The results of the current experiments demonstrate that the nitinol's corrosion resistance is increased by the process-induced surface smoothing as well as the spontaneous creation of a passive layer. The smoothening of the surface and the development of a thin layer of TiO2 on it are related to the alloy's increased corrosion resistance with uniform corrosion behavior. The corrosion resistance of the nitinol in mixed 0.1 M H2SO4 + 0.1 M citric acid electrolyte solution is marginally superior to that of sulfuric acid alone. It is commonly recognized that the EIS measurement's outcome may be used to effectively define a material's surface condition.
Using this electrochemical characterization study for nitinol using 0.1 M H2SO4 and mixed 0.1 M H2SO4 + 0.1 M citric acid electrolyte, the best and most appropriate electrolyte was identified for further machining during WECM. The concentrations used in the tests and the electrolytic concentrations used in this experimental investigation during WECM were identical. The nitinol has higher electrochemical machinability in terms of machining potential and dissolved surface roughness. Its micro structural compositions are determined by the WECM, which also has a significant impact on how well it resists corrosion as discuss below.
Effect of electrolytes on groove dimensions and surface roughness
Effect of electrolytes on groove dimensions
In the WECM process, it is crucial to regulate the groove dimensions (width and depth) by establishing certain input process parameters. These geometrical parameters talk about the process's precision, quality, and controllability. From the previous research work and literature review, it is seen that the pulse voltage is most influencing parameter during machining of nitinol micro grooves using WECM. Under the same set of process settings, the effect of pulse voltage on various groove dimensions i.e. groove width, groove depth and surface roughness have been investigated in order to conduct meaningful research. This investigation's main motivation is to determine how various electrolytic media impact the behavior of electrolysis products at the tool and workpiece. The effect of different pulse voltages ranging from 5 to 8 V on average machined groove width with a maximum tool immersion depth of 100 μm for all experiments at a feed rate of 1.4 μm/s using 0.1 M H2SO4 electrolyte and mixed 0.1 M H2SO4 + 0.1 M citric acid electrolytes has been shown in Fig. 8. As the current density rises due to increase in pulse voltage, the groove's width also increases due to higher dissolution as material removal rate increases with increase in current density. It is well known that H2SO4 is strong inorganic acid and citric acid is weak organic tri carboxylic acid. A strong acid will have higher dissociation constant than a weak acid. The dissolution rate of citric acid electrolyte is quite lower as compared to H2SO4 electrolyte. An electrolyte with low water content can inhibit the formation of the passive layer since water is thought to play a significant part in the passivation process. Figures 9 and 10 shows the machined microgrooves of nitinol during WECM at pulse voltages ranging from 5 to 7 V in 0.1 M H2SO4 electrolyte and mixed 0.1 M H2SO4 + 0.1 M citric acid electrolytes, respectively. As can be seen, at constant wire feed rate of 1.4 μm/s, 45% duty ratio and other fixed parameters as per Table I, the minimum average machined groove width is 86.20 μm in 0.1 M H2SO4+0.1 M citric acid at 5 V pulse voltage as shown in Fig. 9 which is less as compared to 99.125 μm groove width produced using 0.1 M H2SO4 electrolyte solution as shown in Fig. 10. When the pulse voltage is 7 V, the groove width is 137. 927 μm which is larger in 0.1 M H2SO4+ 0.1 M citric acid which further increases to 145.433 μm in 0.1 M H2SO4 electrolyte solution because the dissolution reactivity is greater and passive layer is less stable according to the polarization characteristics. It is thought that high pulse voltage produces more stray currents than tiny, low pulse voltage. At mixed 0.1 M H2SO4 + 0.1 M citric acid electrolyte solution, the machining groove width reduces as the electrolyte concentration was most suitable for acquiring proper anodic dissolution of nitinol because the specific electrolyte resistivity is inversely proportional to the electrolyte concentration. The groove width overcut ( where
where  goove width overcut,
  groove width,
  diameter of wire) has been greatly reduced with addition of ecofriendly organic citric acid in sulphuric acid due to controlled current density distribution and toxicity of the strong H2SO4 electrolyte reduced by taking advantages of eco-friendly citric acid in the electrolyte solution for microgroove fabrication during WECM of nitinol. Citric acid-containing solutions enable for less current to be created than citric acid-free solutions. When citric acid is present in the electrolyte solution, this leads to a lower material removal rate, which also accounts for the decrease in width overcut.

Figure 8. Micrograph of average groove width and overcut at different pulse voltages.
Download figure:
Standard image High-resolution image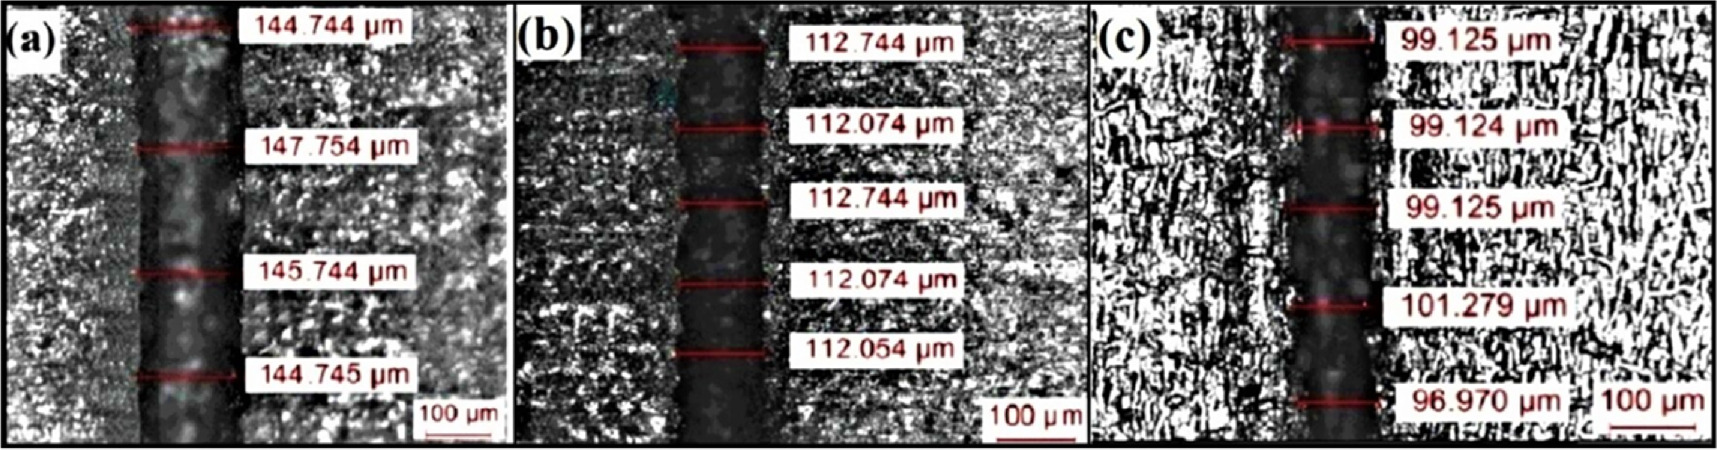
Figure 9. Groove width using 0.1 M H2SO4 electrolyte at (a) 7 V (b) 6 V (c) 5 V.
Download figure:
Standard image High-resolution image
Figure 10. Groove width using 0.1 M H2SO4 and 0.1 M citric acid (a) 7 V (b) 6 V (c) 5 V.
Download figure:
Standard image High-resolution imageThe production of the insoluble precipitates is decreased when an environmentally friendly citric acid complexing agent is added to the 0.1 M H2SO4 aqueous electrolytes. In contrast to acids, these complexing agents are non-toxic and non-corrosive, making them acceptable for use in WECM. The minimum average machined groove width overcut was 18.10 μm in 0.1 M H2SO4 + 0.1 M citric acid at 5 V pulse voltage which is less compared to width overcut of 24.85 μm produced at 0.1 M H2SO4 electrolyte in same parametric machining condition. The effect of pulse voltages on maximum groove depth are as shown in Fig. 11.

Figure 11. Micrograph of maximum groove depth at different pulse voltages.
Download figure:
Standard image High-resolution imageIt shows how the depth of the groove rises as the pulse voltage increases. According to the aforementioned factor, material removal rate increases as pulse voltage increases, increasing the current density at inter electrode gap near machining zone. The maximum depth of groove at 5 V using 0.1 M H2SO4 was 73.03 μm which is further increased to 98.9 at 5 V pulse voltage as shown in Fig. 12. The addition of organic citric acid diluted the concentration of strong sulphuric acid to some extent with reduction in toxicity by acting as a complexing agent to the electrolyte solution. However, the depth of the groove also reduced to some extent which can be further enhanced by increasing the molar concentration of citric acid in the solution.

Figure 12. Groove depth using 0.1 M H2SO4 electrolyte at (a) 7 V (b) 6 V (c) 5 V.
Download figure:
Standard image High-resolution imageThe deepest machining groove i.e. 93.9 μm has been obtained at 7 V pulse voltage using mixed 0.1 M H2SO4 + 0.1 M citric acid electrolyte as shown in Fig. 13. From 5 V to 7 V pulse voltage at constant wire feed rate, the depth of the groove increases. A parabolic form may have been created because, according to a thorough investigation, the entrance of the groove, where the width is measured, was more susceptible to higher machining times than the groove end. However, at low current densities compared to high current densities, the variation in the depth of each groove is greater.

Figure 13. Groove depth using 0.1 M H2SO4 and 0.1 M Citric acid at (a) 7 V (b) 6 V (c) 5 V.
Download figure:
Standard image High-resolution imageFurther, experimental results reveal that the depth of groove using 0.1 M H2SO4 electrolyte was higher as compared to the mixed 0.1 M H2SO4 + 0.1 M citric acid solution. It is due to the less current density for machining for same pulse voltage conditions in mixed electrolyte.
The sulphuric acid is strong inorganic acid which has a capability of producing maximum current without producing any dissolved products. However more concentration adversely affects the machining process and produces overcut with poor homogeneity and surface quality. The depth of groove decreases with increasing machining time due to lower wire feed rate. However, when machining time rises at lower wire feed rates, the average groove width inaccuracy grows. As IEG between the machined surface and the wire electrode grows, the depth of the groove decreases with increase in width overcut. Because of this, the electrochemical reaction is more active along the sides of each groove than it is vertically into the material's surface.
Effect of electrolytes on surface roughness
The surface properties of the various electrolytes employed also vary, which affects how the machining features work. A slight change in potential during the process may result in a decrease in current, which will inevitably cause a drop in current efficiency. The electrolyte with a very low concentration (0.05 M) resulted in poor machined surface. The ability to produce smooth surface micro-features in mixed 0.1 M H2SO4 + 0.1 M citric acid electrolyte solution was particularly useful due to its uniform dissolution in the required concentration. To obtain smooth machined surfaces in WECM, the passive layer function as insulators to prevent corrosion on the machined surfaces. An acid electrolyte composed of sulfuric acid (0.1 M H2SO4), citric acid (0.1 M), and distilled water (H2O) was employed to identify a suitable electrolyte for machining Nitinol. Cit3 ion, a polyhydroxy carboxylic acid group ligand that functions as a chelating agent with significant complexing capacity, is present in citric acid. Numerous donor atoms in the ligand are capable of swiftly transferring electrons into the coordination sphere of metal cations. As a result, the link between the metal and oxygen becomes polarized and gradually weakens, allowing metal ions to dissolve. As a result, in the case of a mixed 0.1 M H2SO4 + 0.1 M citric acid electrolyte, Ni is readily dissolved, leading to a uniform dissolution and a reduction in surface roughness. In contrast to mixed 0.1 M H2SO4 + 0.1 M citric acid electrolyte solution, the microgroove created while machining Nitinol using 0.1 M H2SO4 electrolyte solution was uneven in shape and had poor surface quality. The surface that was achieved in the 0.1 M H2SO4 electrolyte was subpar, and the micro grooves that were created had significant electrolytic assault on them in and around the machined surface. Since H2SO4 is not environmentally friendly, a mixed electrolyte of H2SO4 and citric acid is provided, and its performance is determined to be superior to H2SO4. A nitinol sample with an initial surface roughness of 4.076 μm was machined to a roughness of 0.0631 μm using mixed 0.1 M H2SO4 + 0.1 M citric acid at 5 V pulse voltage which is lower as compared to 0.09055 μm produced using 0.1 M H2SO4 electrolyte for these experiments. The effect of pulse voltage on surface roughness using 0.1 M H2SO4 and mixed 0.1 M H2SO4 + 0.1 M citric acid is shown in Fig. 14.

Figure 14. Graph of surface roughness at different pulse voltages using different electrolytes.
Download figure:
Standard image High-resolution imageFor anode passivity, the voltage is more negative than the other voltage in the cathode, which makes the disparity perceptible with regard to the applied voltage. Once the oxide layer ruptures, the hostile ions are delivered through it to the contact between the oxide and the metal. The aggressive anions go to the interface through oxygen vacancies. Under the passive layer, the metal substrate is attacked and dissolved by the anions.
Then, as part of the oxide layer-thinning mechanism, the aggressive anions adsorb onto the material's passive layer and combine with the oxide to form complexes, which often form in groups. This causes the oxide layer to dissolve locally up to the depth of the metal. As the Ni ions spread into the layer, the defects further break. Since the anode would react with water and oxygen molecules and reoxidize, these faults in the oxide layer cannot penetrate to the anode.
Figures 15 and 16 displays the 3D surface view of the microgrooves made using this the 0.1 M H2SO4 and mixed 0.1 M H2SO4 + 0.1 M citric acid electrolyte. It is observed that the surface roughness increases with increase in pulse voltage. The machining in 0.1 M H2SO4 electrolyte produces an average surface roughness of 0.3943 μm at 7 V and reduced to 0.09055 μm at 5 V as shown in Fig. 15. Because of the poor surface that was formed in the 0.1 M H2SO4 electrolyte, the surface roughness increased. Due to poor anodic dissolution and etching, the surface roughness of the 0.1 M H2SO4 electrolyte is increased, and the electrolyte has a high current carrying capacity. When mixed 0.1 M H2SO4 + 0.1 M Citric acid electrolyte were used to machine nitinol, the quality of the microgrooves created with electrolytic attack was superior to that of 0.1 M H2SO4 electrolyte in terms of surface integrity and Fig. 16 depicts the surface that was produced during the machining of nitinol using mixed 0.1 M H2SO4 + 0.1 M Citric acid electrolyte. The micro groove created with 0.1 M H2SO4 electrolyte mixed with citric acid is better than that of the 0.1 M H2SO4 electrolyte, and the electrolytic attack is very low (i.e., no ions are observed impinging), but the machining speed is slower than with 0.1 M H2SO4 electrolyte. Smooth dissolving takes place while machining nitinol with mixed 0.1 M H2SO4 + 0.1 M Citric acid electrolyte. Ions slowly tear the anodic film, allowing for anodic disintegration, due to the adsorption of the film. The metal ions instead form oxides, which results in a much slower reaction and longer machining times since they do not produce oxygen vacancies. Due to the existence of electrolyte passivating ions, the surface produced in mixed 0.1 M H2SO4 + 0.1 M Citric acid electrolyte is comparably excellent. With low current density, the passivating ions firmly migrate towards the surface and subtly damage it. This specific electrolyte produced surfaces with an average surface roughness of 0.3193 μm at 7 V and reduced to 0.0631 μm at 5 V. The capacity to smoothly and effectively burst the generated anodic film is excellent. Except at higher voltages, mixed 0.1 M H2SO4 + 0.1 M Citric acid electrolyte offer the least amount of surface roughness compared to the 0.1 M H2SO4 electrolyte. Further, it has been observed that the surface roughness was increased with increase in machined groove depth for 0.1 M H2SO4 electrolyte and mixed 0.1 M H2SO4 + 0.1 M Citric acid electrolyte as shown in Fig. 17. It is due to the fact that the groove depth increases with increase in current density. Formation of sludge, precipitates and generation of bubbles at IEG near the machining zone at higher pulse voltages contributes in an increase in surface roughness.

Figure 15. 3D surface images, surface roughness profiles and amplitude parameters measured using CCI profilometer with 0.1 M H2SO4 electrolyte at pulse voltage (a) 5 V (b) 6 V (c) 7 V.
Download figure:
Standard image High-resolution image
Figure 16. 3D surface images, surface roughness profiles and amplitude parameters measured using CCI profilometer with 0.1 M H2SO4 + 0.1 M Citric acid electrolyte at pulse voltage (a) 5 V (b) 6 V (c) 7 V.
Download figure:
Standard image High-resolution image
Figure 17. Surface roughness relative to machined groove depth with (a) 0.1 M H2SO4 electrolyte (b) 0.1 M H2SO4 + citric acid electrolyte.
Download figure:
Standard image High-resolution imageIn comparison to other neutral electrolytes, there is less oxygen on the Nitinol surface after WECM employing these acid electrolytes. Having a persistent TiO2 layer on its surface gives it great corrosion resistance. When it comes into touch with an environment that contains oxygen, this oxide layer is created. The nitinol anodic dissolution is hampered by the extremely passive oxide layer that forms. With the molecular formula C6H8O7, citric acid is a type of environmentally friendly complexing agent that has the capacity to interact with most metal ions and produce a soluble complex molecule. H2SO4, a passive electrolyte, slows down the electrolysis processes and produces thick TiO2 layer. A thick TiO2 layer makes it extremely difficult to machine in the axial direction and results in significant radial overcuts. Therefore, it is essential to keep TiO2 layer during machining to a minimum so that only stray currents are diminished. Citric acid is a chelating substance that creates soluble complexes with titanium ions, which inhibits the synthesis of TiO2 when present. This implies that just a thin layer of titanium oxide is generated using citric acid-based solutions, resulting in the machining of micro-grooves with fewer overcuts. Citric acid-containing solutions enable for less current to be created than citric acid-free solutions. When citric acid is present in the electrolyte solution, this leads to a lower material removal rate, which also accounts for the decrease in overcut. The production of the insoluble precipitates is decreased when an environmentally friendly citric acid complexing agent is added to the 0.1 M H2SO4 aqueous electrolytes. In contrast to acids, these complexing agents are non-toxic and non-corrosive, making them acceptable for use in WECM.
Further, the micro slit was fabricated at optimized parameter conditions of 5 V pulse voltage, 45% duty ratio and 1.4 μm s−1 shown in Fig. 18.
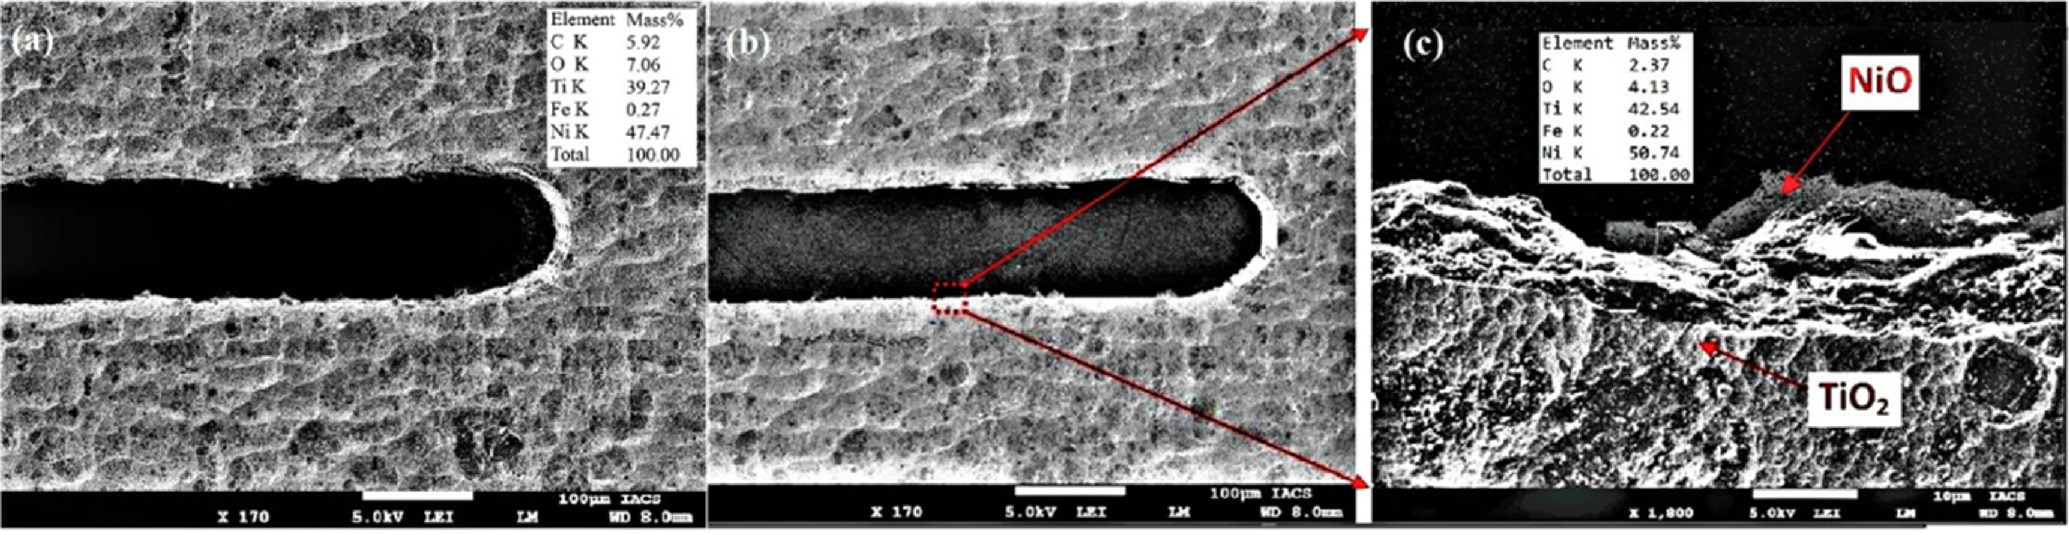
Figure 18. SEM of fabricated micro slit using (a) 0.1 M H2SO4 electrolyte (b) mixed 0.1 M H2SO4 + 0.1 M citric acid electrolyte (c) Zoomed view of micro-slit edge surface.
Download figure:
Standard image High-resolution image
The minimum average slit width of 108.325 μm using 0.1 M H2SO4 electrolyte with minimum average surface roughness of 0.1217 μm and 92.234 μm using mixed 0.1 M H2SO4 + 0.1 M Citric acid electrolyte with minimum average surface roughness of 0.0691 μm shows the capability of WECM for micro-features fabrication without affecting original chemical composition of difficult to cut material i.e. nitinol etc. Although WECM with a neutral electrolyte helped lessen surface roughness, it also made the surface black. However, the mixed 0.1 M H2SO4 + 0.1 M citric acid electrolyte forms thin oxide layer that serves as a layer of corrosion resistance forms with uniform dissolution. Because TiO2 is formed with a negative enthalpy, nitinol undergoes passivation naturally. During WECM, this oxide layer pushes Ni atoms away from the surface, depleting the surface of Ni and also removing the Ni in the form of nickel oxide (NiO). Due to advancements in corrosion resistance, biocompatibility, and surface quality as compared to conventional surface preparation procedures, mixed 0.1 M H2SO4 + 0.1 M citric acid electrolyte during WECM is appealing for the preparation of nitinol surfaces. The increase of oxygen value 7.06 in 0.1 M H2SO4 and 4.13 in mixed 0.1 M H2SO4 + 0.1 M citric acid electrolyte shows formation of oxide layer on nitinol surface after machining. The lower of oxygen in mixed 0.1 M H2SO4 + 0.1 M citric acid electrolyte show production of thin oxide layer compared to 0.1 M H2SO4 electrolyte which has proven to create uniform dissolution and improvement in homogeneity and surface quality of nitinol during WECM.
Conclusions
In this research work, the electrochemical characterization of inorganic H2SO4 combined with organic eco-friendly complexing agent i.e. citric acid electrolytes was conducted using potentiodyanamic tests and electrochemical impedance spectroscopy on the corrosion behavior of nitinol followed by subsequent effects of machining parameters on fabricated micro grooves for width and depth overcut as well as surface roughness have been investigated. The results of the research work can be concluded as follows:
- (i)Polarization studies showed that the mixed 0.1 M H2SO4 + 0.1 M citric acid electrolyte was appropriate for nitinol machining and the polarization results were in superior conformity with WECM results. During Potentiodynamic test, it is evident that localized corrosion is not present under either electrolyte state, but uniform corrosion in the transpassive or oxygen evolution zone may occur. During electrochemical impedance spectroscopy, it is evident from the values of the resistances Rp and Rs that the corrosion resistance of the nitinol sample dissolute in 0.1 M H2SO4 electrolyte is significantly lower than that of the 0.1 M H2SO4 and citric acid electrolyte sample.
- (ii)The machining of nitinol with mixed 0.1 M H2SO4 + 0.1 M citric acid electrolyte have obtained reduced surface roughness with better surface integrity. This specific electrolyte produced surfaces with an average surface roughness (Ra) of 0.0631 μm and the minimum average machined groove width overcut was 18.10 μm in 0.1 M H2SO4 + 0.1 M citric acid at 5 V pulse voltage.
- (iii)It is revealed that the grooves width and depth increases with increase in applied pulse voltage. The overall quality of the machined surface was poor when excessive pulse voltage i.e. 8 V was applied. The deepest machining groove i.e. 93.9 μm has been obtained at 7 V pulse voltage using mixed 0.1 M H2SO4 + 0.1 M citric acid electrolyte. Also, it has been observed that the surface roughness was increased with increase in machined groove depth due to increase in current density and formation of more sludge and dissolved products near machining zone.
- (iv)According to the EDS data, the oxygen concentration was very less with mixed 0.1 M H2SO4 + 0.1 M citric acid electrolyte. It is clear that the thin oxide layer has been formed on machined surface of nitinol which ultimately helps for uniform dissolution during WECM with improvement in corrosion resistance and biocompatibility.
- (v)The micro slit has been fabricated at 5 V pulse voltage, 45% duty ratio and 1.4 μm/s using mixed 0.1 M H2SO4 + 0.1 M citric acid electrolyte shows proper homogeneity with minimum average slit width of 92.234 μm and surface roughness of 0.0691 μm. It shows the capability of WECM for micro-features fabrication without affecting original properties of difficult to cut material i.e. nitinol etc.
The scope of this investigation is to know the effect of mixed strong inorganic acidic electrolyte i.e. H2SO4 with ecofriendly organic acidic electrolyte i.e. citric acid acts as a complexing agent during WECM of nitinol. It has been revealed that the better results in terms of groove width overcut reduction as well as improvement in surface quality. However, further study and research may be needed for further performance enhancement of WECM using different combinations of mixed eco-friendly electrolytes during fabrication of complex micro-features.
Acknowledgments
The Authors appreciate the financial support from SERB, DST, New Delhi for research work.