
Abstract
In this work, molybdenum and tungsten-implanted wafers are analyzed by an innovative technique based upon photoluminescence measurements, with the aim to assess the ability of this technique to detect metal contamination in the near-surface region. Surface Photovoltage (SPV) measurements of carrier diffusion length are compared to the results of photoluminescence measurements. It is shown that molybdenum and tungsten contamination are easily detected by photoluminescence intensity measurements down to about 1010cm−2 contaminant dose. Vice versa, SPV has limited sensitivity to these elements (≥5·1010cm−2), because of their low diffusivity. Therefore, photoluminescence intensity measurement can be a valid alternative to conventional carrier diffusion length measurements for monitoring slow diffuser contamination.
It is well-known that molybdenum and tungsten contamination have detrimental impact on device performances.1–3 As these contaminants are slow diffusers in silicon,4–6 even a small amount per unit area results in a significant concentration in the near-surface silicon volume. Therefore, this sort of contamination can be difficult to catch by surface techniques and still be harmful for devices. In addition, the commonly used techniques based on recombination lifetime measurements frequently fail in detecting these contaminants, because the region analyzed by these techniques is usually much deeper than the region involved in molybdenum and tungsten diffusion.7
In this work, molybdenum and tungsten-implanted wafers were analyzed by an innovative technique based upon photoluminescence measurements, with the aim to assess the ability of this technique to detect metal contamination in the near-surface region. Surface Photovoltage (SPV) measurements of carrier diffusion length were compared to the results of photoluminescence measurements.
Experimental
Sample preparation
P-type, (100), 200 mm diameter, 725 μm thick 10 Ωcm resistivity Magnetic Czochralski (MCZ) wafers and n-type, 5 Ωcm resistivity CZ wafers were used in this study. 400 Å oxide was grown and 65 keV molybdenum or 90 keV tungsten were implanted with doses from 2·1010 cm−2 to 2·1011 cm−2. The implantation energy was chosen so that the oxide-silicon interface was located at the projected range (estimated by SRIM simulation,8), therefore about 50% of the implanted dose was in silicon after implantation. In principle, the implantation damage might impact lifetime data, however in previous experiments we found that the obtained results are specific to the contaminant, irrespective of the mechanical lattice damage.9,10 Indeed, we observed that the results of implanted wafers correlated with the results of wafers contaminated by wet processes. In addition, in experiments about a fast diffuser (nickel) similar results were obtained by implantations at wafer frontside or at wafer back side.11,12 On the other hand, the doses used in this experiment are lower than the typical threshold doses for defect formation.13,14
After the implantation, the wafers were thermally treated by a Rapid Thermal Treatment (RTP) at 1100°C for 3 min in an inert environment. This thermal treatment had the purpose to recover the implantation damage and to allow metal diffusion in silicon. SPV measurements were carried out after RTP. In these samples, the Si-SiO2 interface state density should be as low as possible, otherwise such states would degrade the background of our measurements. For this reason, the wafers were annealed in a forming gas environment (30 min at 430°C in N2:H2).
Experimental techniques
Photoluminescence
The photoluminescence (PL) measurements were carried out using the En-Vision tool of Semilab. The En-Vision is primarily an optical, non-destructive, in-line defectivity monitoring for semiconductor manufacturing process and also process optimization tool. The En-Vision is a microscopic technique that is based on the direct imaging of the band-to-band and defect band photoluminescence light of the defects with an optical resolution of up to 1.1 um at near infrared wavelengths. Fig. 1 is a short description of PL measurement using for En-Vision tool. For further readings on this novel tool we refer to.15
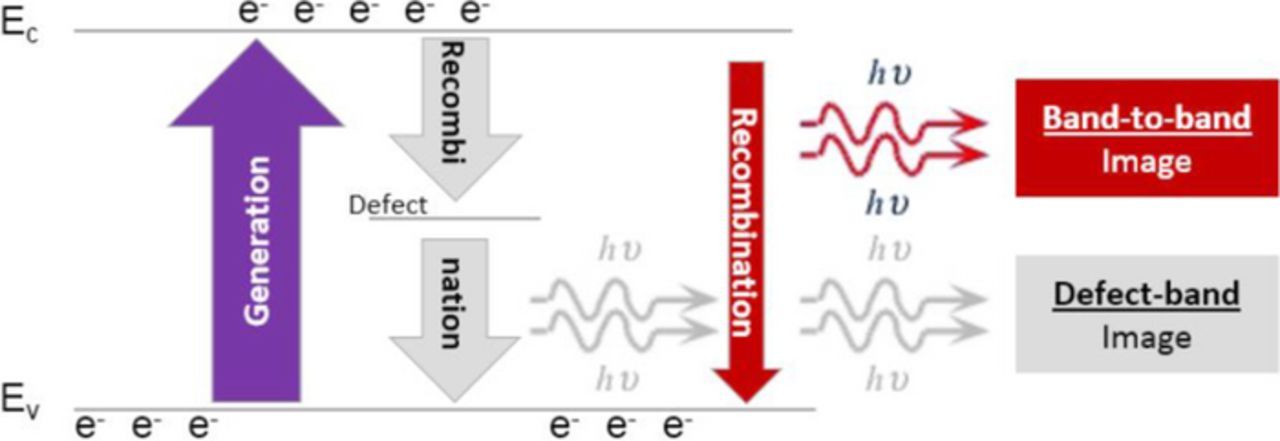
Figure 1. Diagram of silicon PL measurement using En-Vision tool. Step 1: excess carriers are being generated using lights source. Step 2: excess carriers are recombining through different processes including band-to-band and defect band PL. Step 3: PL is collected using camera and recorded as an image. In this study, only band-to-band signal is used.
The band-to-band photoluminescence intensity is obtained by photoexciting the sample with a high-power laser source that operates at above-gap optical wavelengths (532 nm). The recombination of the generated charge carriers produces photoluminescent light at near infrared wavelengths, that corresponds to the silicon bandgap energy of 1.1eV. A laser power of around 1 W is focused on the sample to a spot diameter of about 200 um. Finally, PL images with a minimum field of view of 150 × 175 μm² are acquired.
At these high excitation photon densities, electrically active contaminant in the sample serve as effective recombination centers. So that, the higher the concentration of such traps, the lower the carrier lifetime. The band-to-band PL intensity is directly proportional to the carrier lifetime and thus, it is expected to decay with the increase of the concentration of contaminant.
Nonetheless, the band-to-band intensity offers only a relative comparison for the concentration of active contaminant. This is because of the dependence of the PL signal on the diffusion length and the surface recombination velocity. In particular, different implant, annealing, and oxidation conditions will result in different levels of PL intensities. The band-to-band PL intensity primarily probes a region deeper than the penetration depth of the excitation light, that is 0.8 um, due to the carrier diffusion.
In this work, we tested the band-to-band photoluminescence intensity as a contamination monitor. The defect band photoluminescence is typically weaker and is suitable for extended defect detection.15,16
Surface photovoltage (SPV)
The carrier diffusion length is obtained from SPV measurements by illuminating the sample with light of various wavelengths. The generated minority carriers are collected in the depletion region at the wafer surface and produce a variation in surface potential, which is recorded as a function of light wavelength. SPV measurements of carrier diffusion length are always obtained under very low injection conditions. In the standard SPV technique,17 the diffusion length Ldiff is extracted from these data by assuming that sample thickness is much larger than diffusion length. This hypothesis often fails in present wafers, and the actual wafer thickness must be taken into account. An “enhanced SPV”18 technique is available for this purpose. The enhanced SPV equation is obtained by imposing the correct boundary condition at the wafer back side, i.e. by taking into account back side surface recombination. The surface photovoltage signal ΔV is written as ΔV∝f(z, Ldiff), where f is a function of the light penetration depth z and of the carrier diffusion length. The carrier diffusion length is obtained by a non-linear best-fit procedure to surface photovoltage data. The back side surface recombination velocity sb is also a parameter of the function f(z,Ldiff), but this parameter does not affects the best-fit results provided it is high enough (sb ⩾ 104cm/s,18) In this work, the enhanced SPV method was used in the attempt to detect molybdenum and tungsten contamination, with sb = 104cm/s.
SPV measurements can also be associated with optical activation to quantify iron contamination by dissociation of the iron-boron (FeB) pair.19 In p-type silicon, the equilibrium state of iron at room temperature is the iron-boron pair. This pair can be dissociated by illumination, and the resulting interstitial metal is more effective as a recombination center than the iron-boron pair, so the carrier lifetime after dissociation (τafter) is shorter than before dissociation (τbefore). The quantity 1/τafter-1/τbefore is proportional to the iron concentration in the solid solution, so this method can be used to quantify the iron concentration. Of course, this analysis can be applied to p-type silicon only, because it is based on the dissociation of FeB pairs. The concentration of recombination centers different from iron (the so-called “Other impurities”) can also be estimated by assuming a somehow arbitrary capture cross section for minority carriers. The light intensity needed for FeB pair dissociation is much higher that the intensity used for carrier injection, as SPV is a low injection technique. Therefore, the diffusion length measurement cannot be responsible for any pair dissociation.
The SPV tool in the FAaST SDI system was used for these analyses. This tool is equipped with a set of filters with wavelengths from 800 nm to 1 μm, corresponding to light penetration depths from 11.3 μm to 157 μm. In this tool, the same electron capture cross section as for interstitial iron (σn,Fei≈2·10−14 cm−2, see20,5) is used to estimate the “Other impurity” concentration. In the case of molybdenum, the electron capture cross section is reported to be σn,Mo≈1.6·10−14 cm−2,21,22 not far from the value used to estimate the “Other impurity” concentration, so the use of this capture cross section is expected to yield realistic molybdenum concentrations. No data of minority carrier cross section are available for tungsten to our knowledge.
In the analysis of carrier diffusion length as a function of contaminant dose or concentration, we always use the carrier diffusion length measured before activation, because this is the condition with the minimum effect of the background iron contamination on the measured carrier diffusion length.
Both standard and enhanced SPV are only sensitive to bulk recombination, so SPV cannot detect surface-segregated contaminants. In SPV measurements, the probed region is of the order of light penetration depth 1/α (where α is the absorption coefficient) plus carrier diffusion length. This region typically ranges from about 100 μm to the whole wafer thickness.
Experimental Results
Molybdenum
SPV data
In a previous work (see Ref. 23), we studied the impact of molybdenum and tungsten contamination on SPV measurements of carrier diffusion length and of the “Other impurity” concentration in samples prepared according to the same flow as used for the photo luminescence measurement samples. Here, we report those results to compare them with photoluminescence data. Fig. 2 shows the minority carrier diffusion length Ldiff obtained from the SPV plots in p- and n-type silicon as a function of the molybdenum dose QMo. The carrier diffusion length decreases with the molybdenum dose, and in p-type siliconLdiff∝Q− 1/2Mofor doses higher than 5·1010 cm−2. This is the expected dependence when the diffusion length is limited by molybdenum and all the implanted molybdenum is active as a recombination center in the silicon volume. It can be noted, however, that the measured diffusion length in low dose contaminated samples is within the background range.
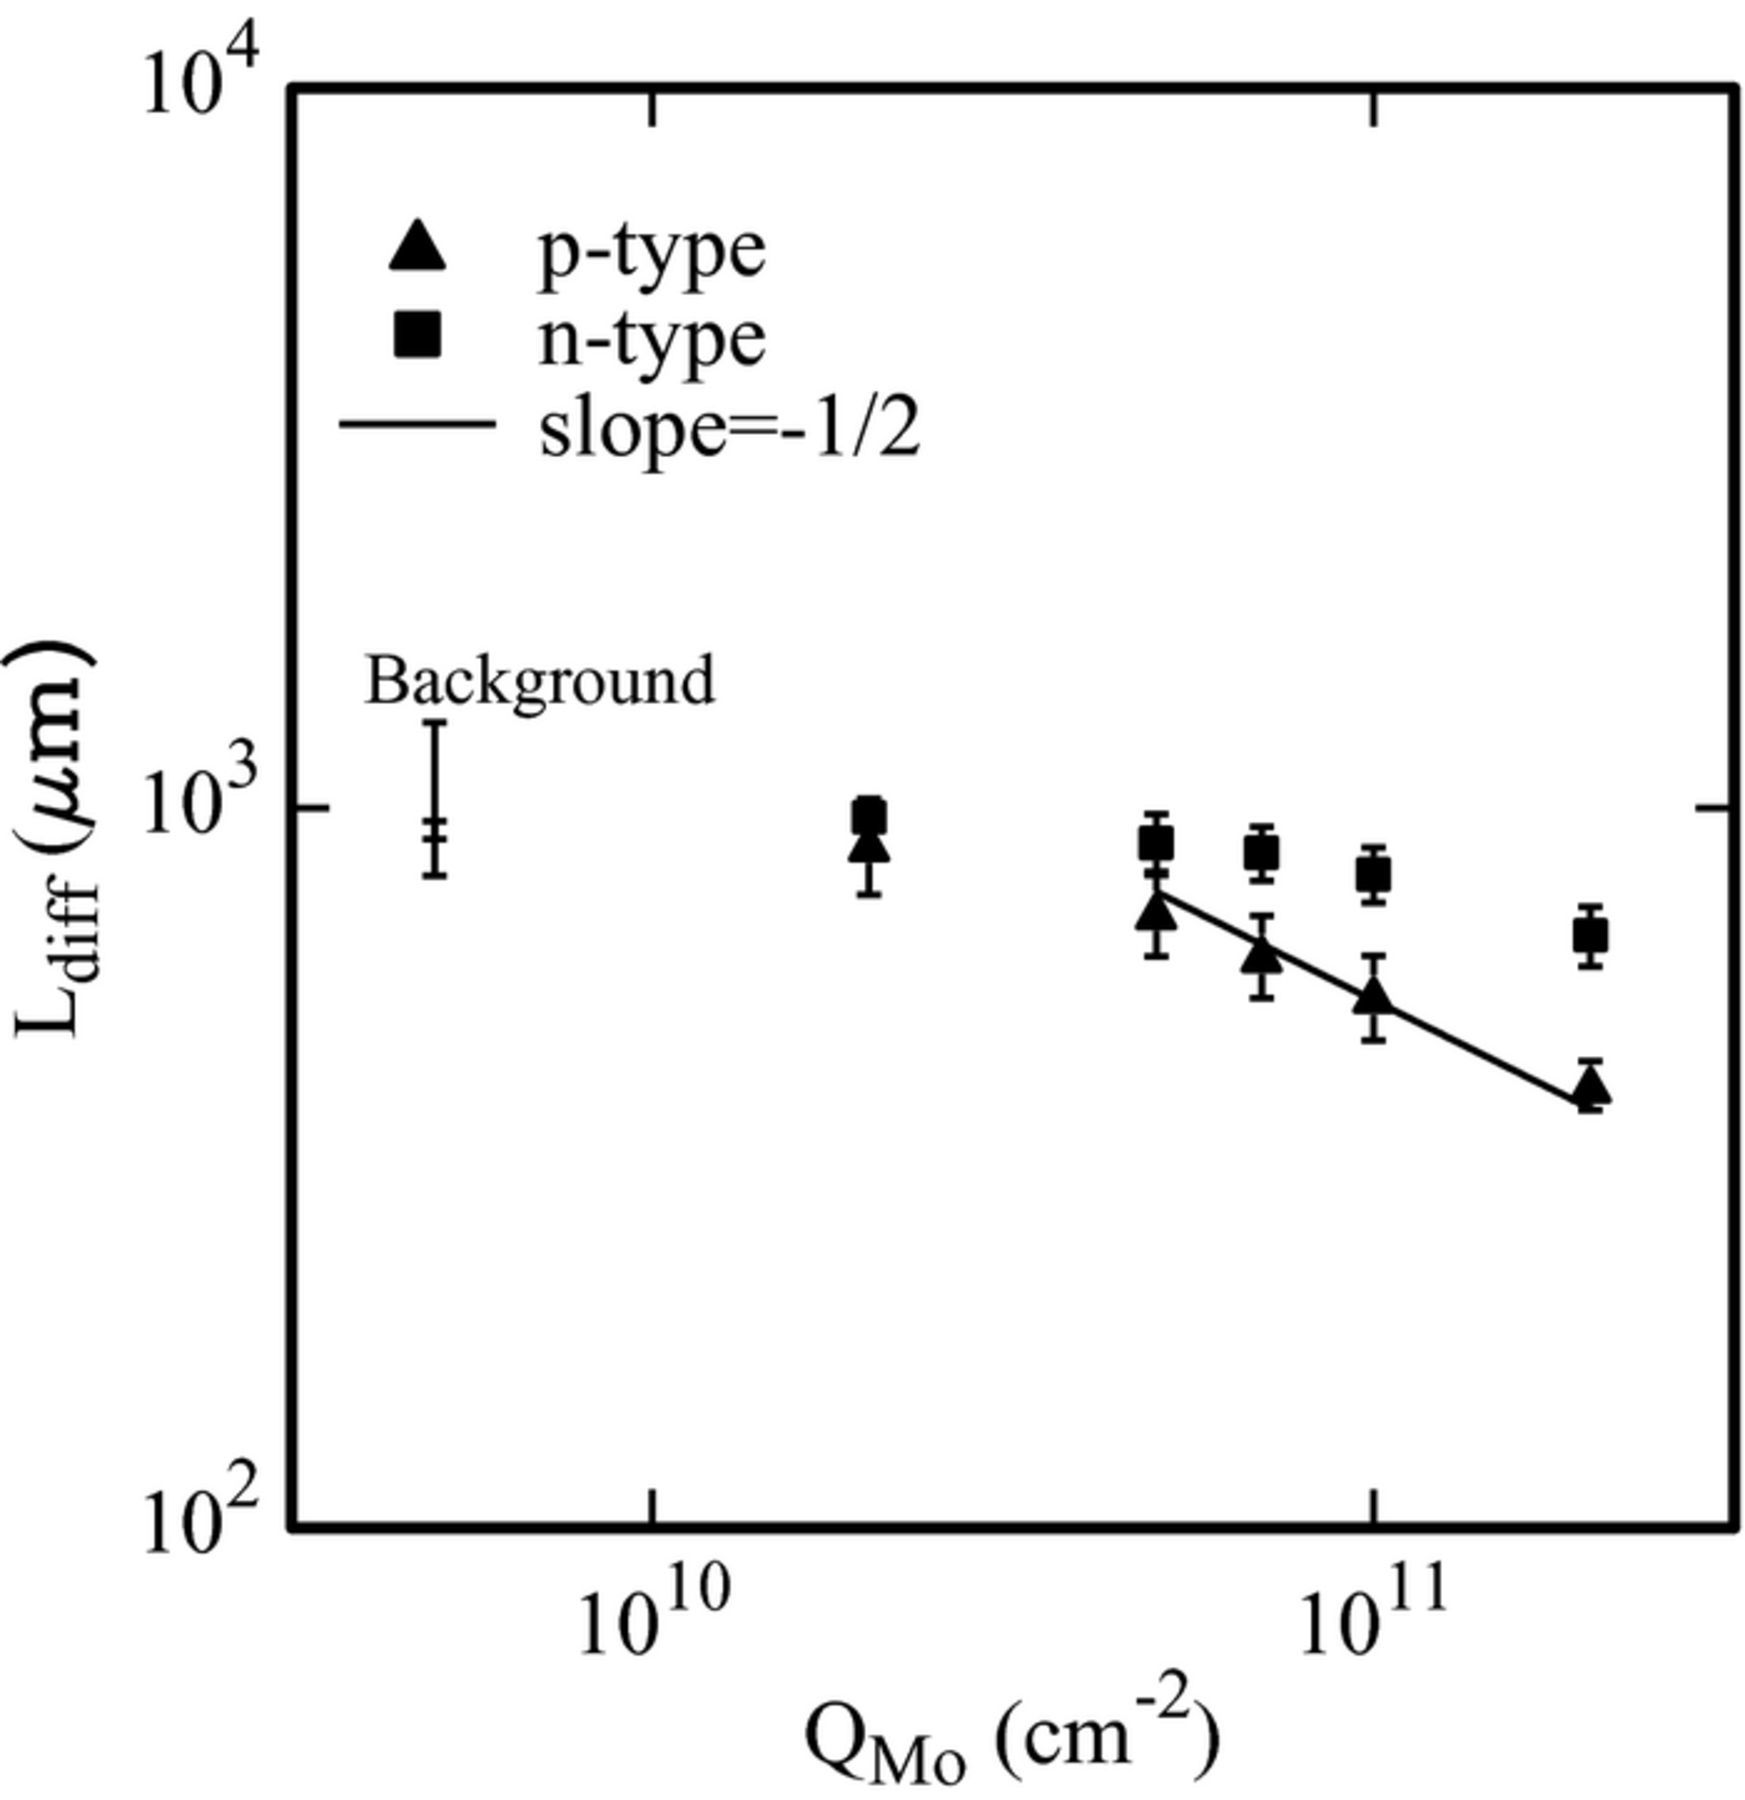
Figure 2. Carrier diffusion length measured by SPV as a function of the molybdenum dose (Ref. 23).
In n-type silicon, some decrease of the diffusion length with the molybdenum dose is observed, but this dependence is weaker than in p-type silicon, indicating that molybdenum is more effective as a recombination center in p-type than in n-type silicon.
In our samples the iron concentration was of the order of 4–5·1010 cm−3, irrespective of the molybdenum dose. No optical activation of molybdenum was observed in p-type wafers, so when calculating the iron concentration from the SPV diffusion length measured before and after the optical activation molybdenum is included among the “Other impurities”, i.e. among the recombination centers whose activity is not modified by illumination. The difference in such “Other impurity” concentration between molybdenum-implanted samples and not implanted reference samples is assumed to be the molybdenum-related “Other impurity” concentration, and is reported in Fig. 3 as a function of the molybdenum dose. Perfect linearity is obtained over the whole implanted dose range. We note, however, that this concentration is rather low if compared for instance with the concentration measured by Deep Level Transient Spectrometry (DLTS) in molybdenum-implanted silicon,24 of the order of 1013 cm−3 in the same dose range. This seeming discrepancy is due to the different probing depth of these techniques. Indeed, the region analyzed by DLTS is the space charge region of a Schottky diode, a few μm thick. The region analyzed by SPV is of the order of the light penetration depth plus the carrier diffusion length, i.e. several hundred μm thick. Molybdenum is known to be a slow diffuser,4 and under our experimental conditions it is estimated to diffuse through about 6 μm. Hence, the thickness of the molybdenum contaminated region is negligible with respect to the thickness of the region analyzed by SPV, whereas it is comparable to the thickness of the region analyzed by DLTS. Unfortunately, the non-uniform in-depth distribution of molybdenum cannot be checked by the deviation from linearity of the standard SPV plot, because in our samples the measured carrier diffusion length is beyond the validity range of the standard SPV method. In addition, even if the standard SPV analysis were possible, in our experimental set-up the expected molybdenum distribution would cause deviation from linearity in one point only of the standard SPV plot, i.e. the point obtained by 800 nm wavelength light, corresponding to 11.3 μm penetration depth, which is the shortest penetration depth in our tool.20
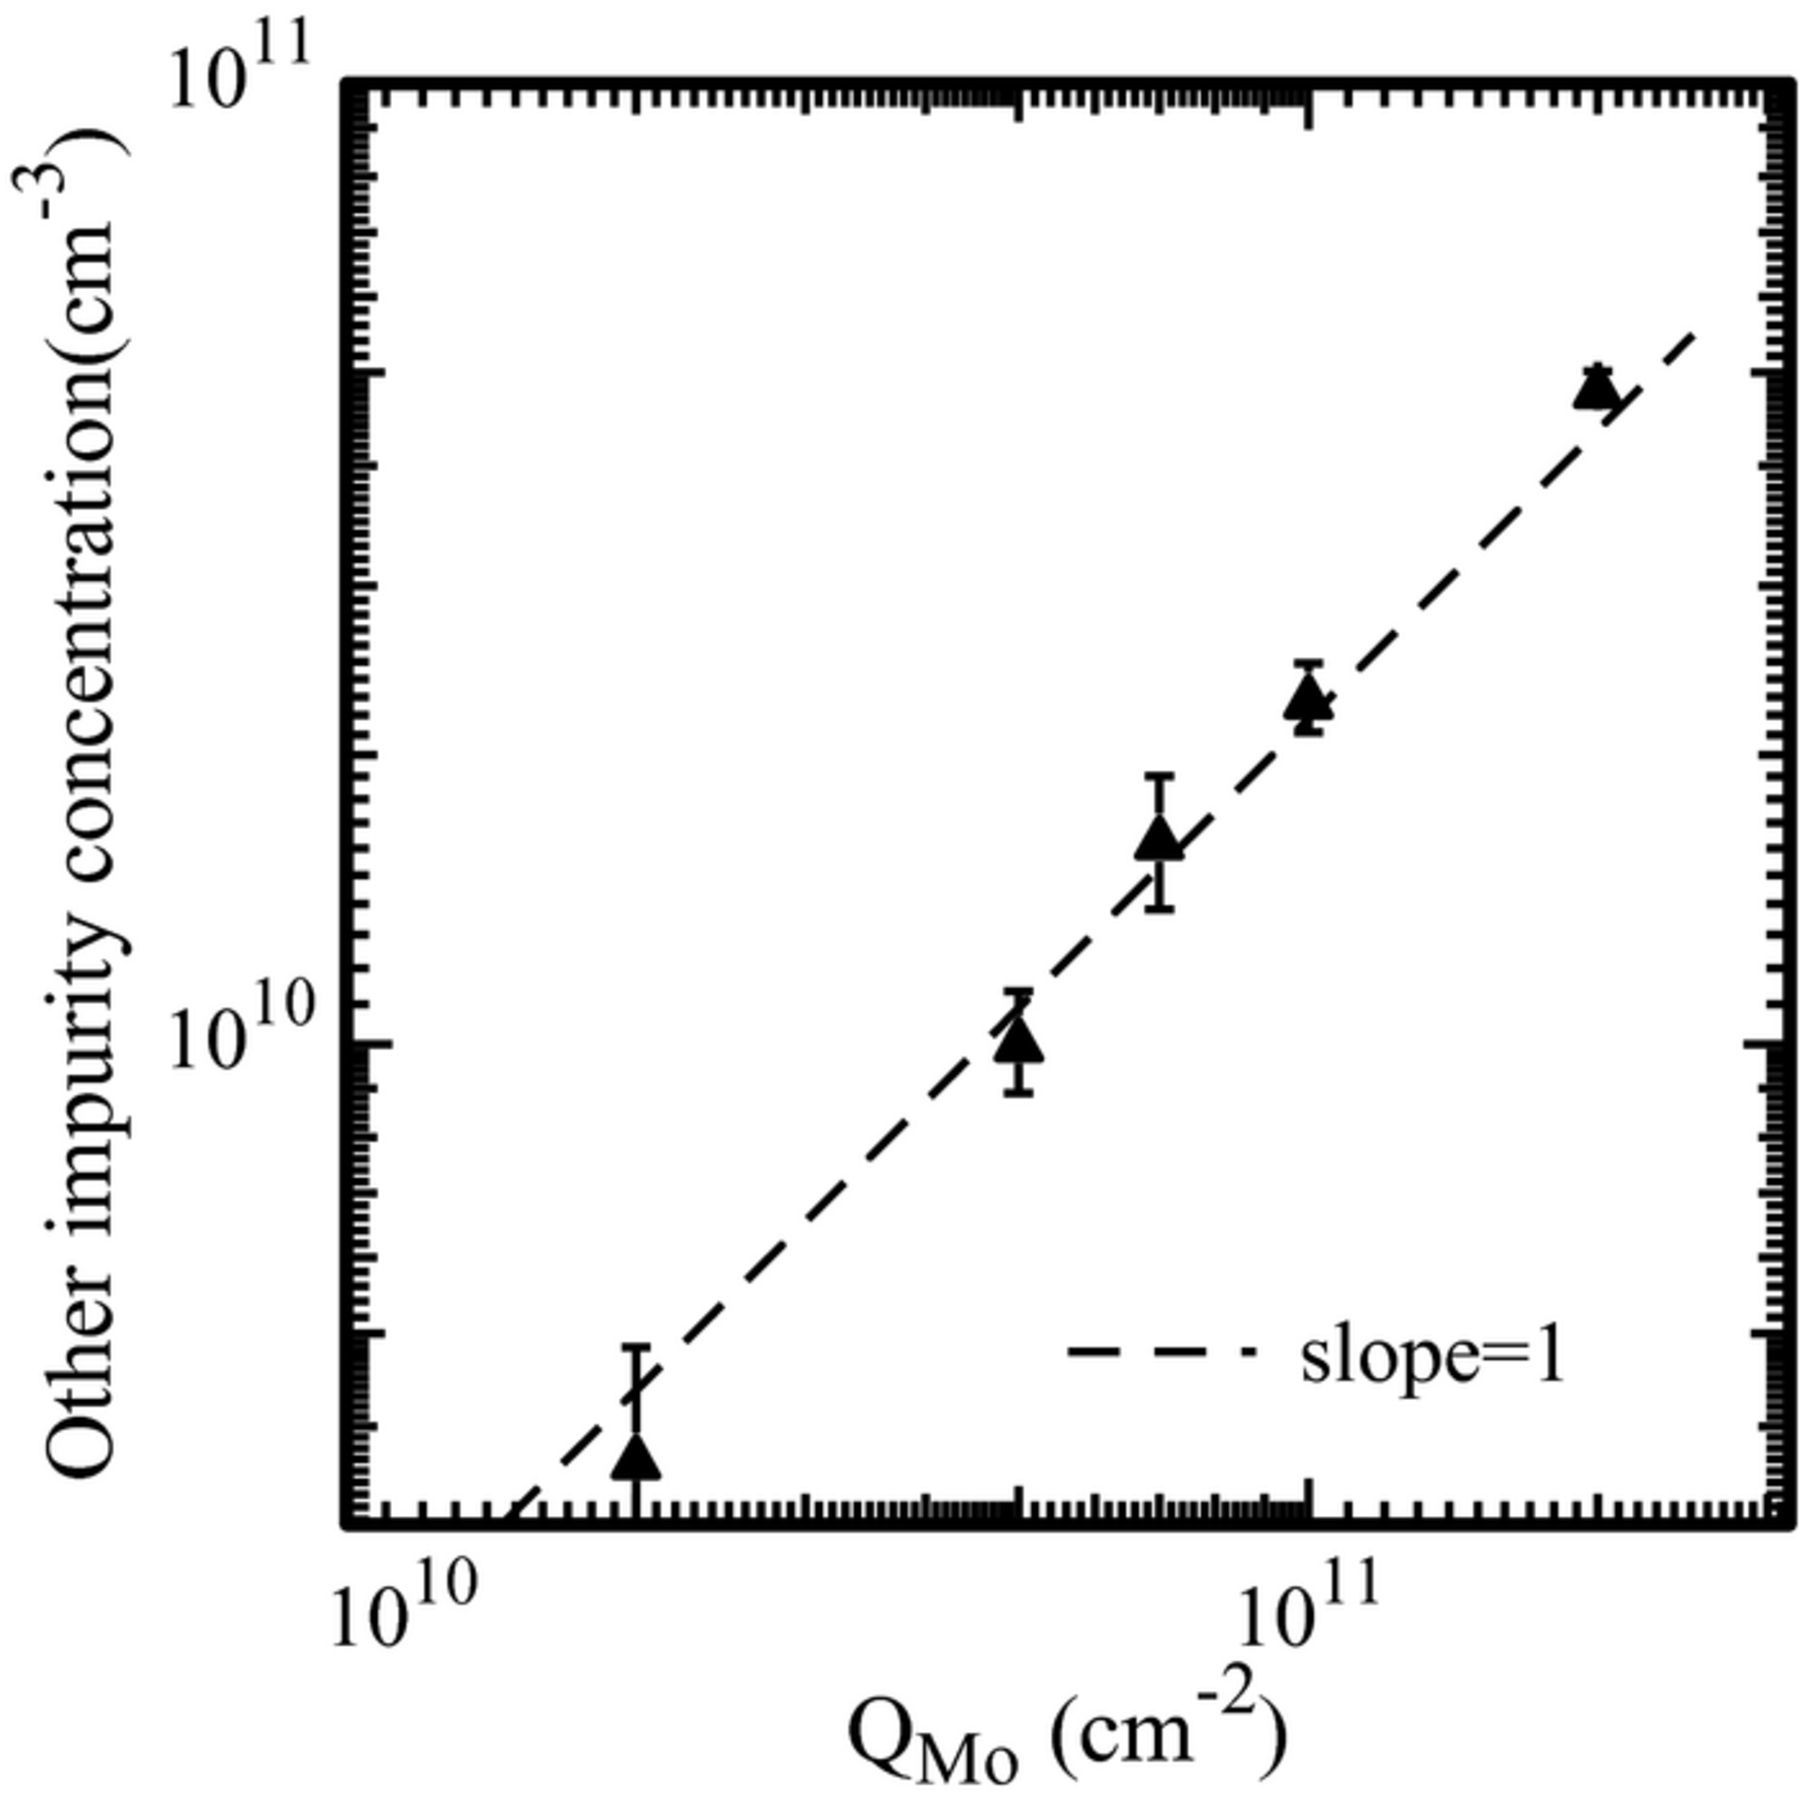
Figure 3. Molybdenum-related concentration of not-activated impurities calculated from SPV measurements before and after activation, as a function of the molybdenum dose (Ref. 23). These data were obtained in p-type silicon wafers.
Photoluminescence intensity
Fig. 4 shows the band-to-band photoluminescence intensity as a function (a) of molybdenum dose, (b) of the molybdenum concentration measured by DLTS in molybdenum-implanted samples annealed with the same thermal treatment as used in this work to prepare molybdenum-contaminated oxidized wafers. In a previous study24 it was shown that the molybdenum concentration in the solid solution in silicon measured by DLTS increases in proportion to the implanted dose in the dose range under study. The implantation conditions were such that in the wafers of the present study the molybdenum dose in silicon was 50% of the total implanted dose (see the Sample Preparation section for details). To take this fact into account, the molybdenum concentration corresponding to 50% of the total implanted dose was reported in Fig. 4b. The concentration measured by DLTS cannot be identified with the concentration in our samples, because of differences in the process flows to prepare Schottky diodes for DLTS24 and to prepare the oxidized wafers for photoluminescence intensity measurements. However it can be assumed that this concentration is proportional to the concentration in the near-surface region of the samples used for the photoluminescence study. The photoluminescence data spread over the wafer surface is of the order of 1–2%, i.e. much lower than the separation between the data of metal-implanted and reference samples. The band-to-band photoluminescence roughly decrease as the inverse implanted dose, or the inverse molybdenum concentration, i.e. this quantity has the same dependence as expected for the carrier lifetime. It can also be noted that photoluminescence intensity data are the same for p- and n-type wafers.
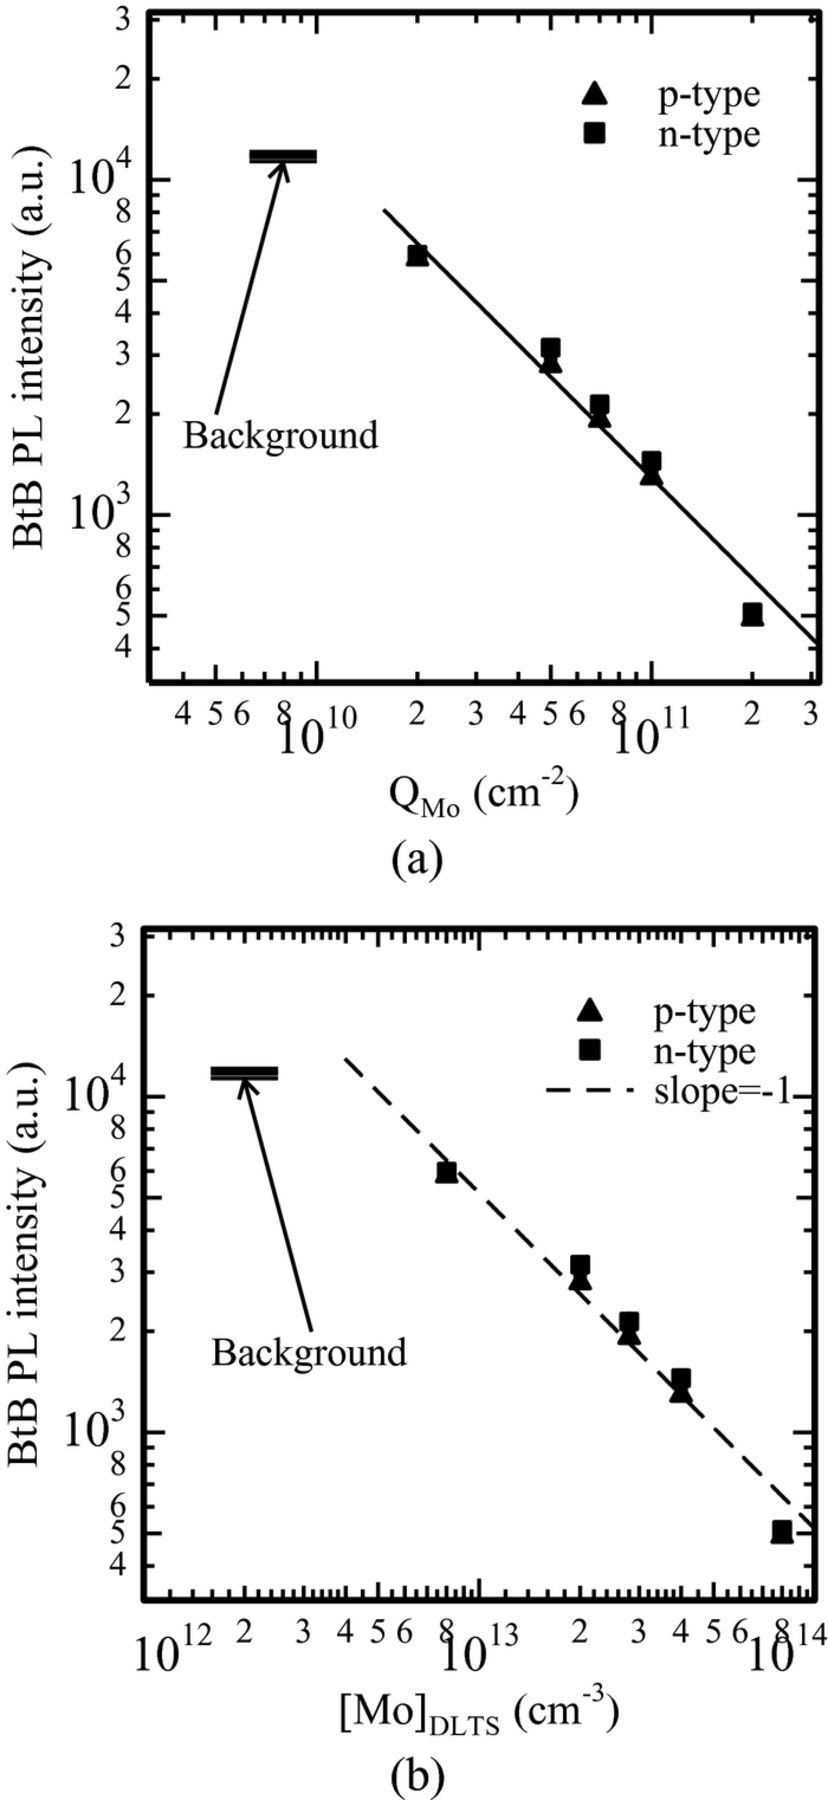
Figure 4. Band-to-band photoluminescence intensity as a function (a) of the molybdenum dose, (b) of the molybdenum concentration measured by DLTS in molybdenum-implanted samples annealed with the same thermal treatment as the samples in this test.
However, a careful inspection of Fig. 4 shows that the band-to-band photoluminescence has a somehow stronger dependence on dose than 1/QMo (or 1/[Mo]DLTS). We do not have any explanation for that.
Tungsten
SPV data
Fig. 5 reports the minority carrier diffusion length measured by SPV in p- type silicon as a function of the tungsten dose QW (see Ref. 23). In tungsten-implanted wafers the carrier diffusion length decreases with the tungsten dose more weakly than in molybdenum-implanted wafers. In addition, an increase of the diffusion length (hence a decrease of the concentration of recombination centers) is observed in the highest dose samples. In n-type wafers the carrier diffusion length is very high (≈1500 μm) irrespective of the tungsten dose, indicating that tungsten is not effective at all as a recombination center in n-type silicon.
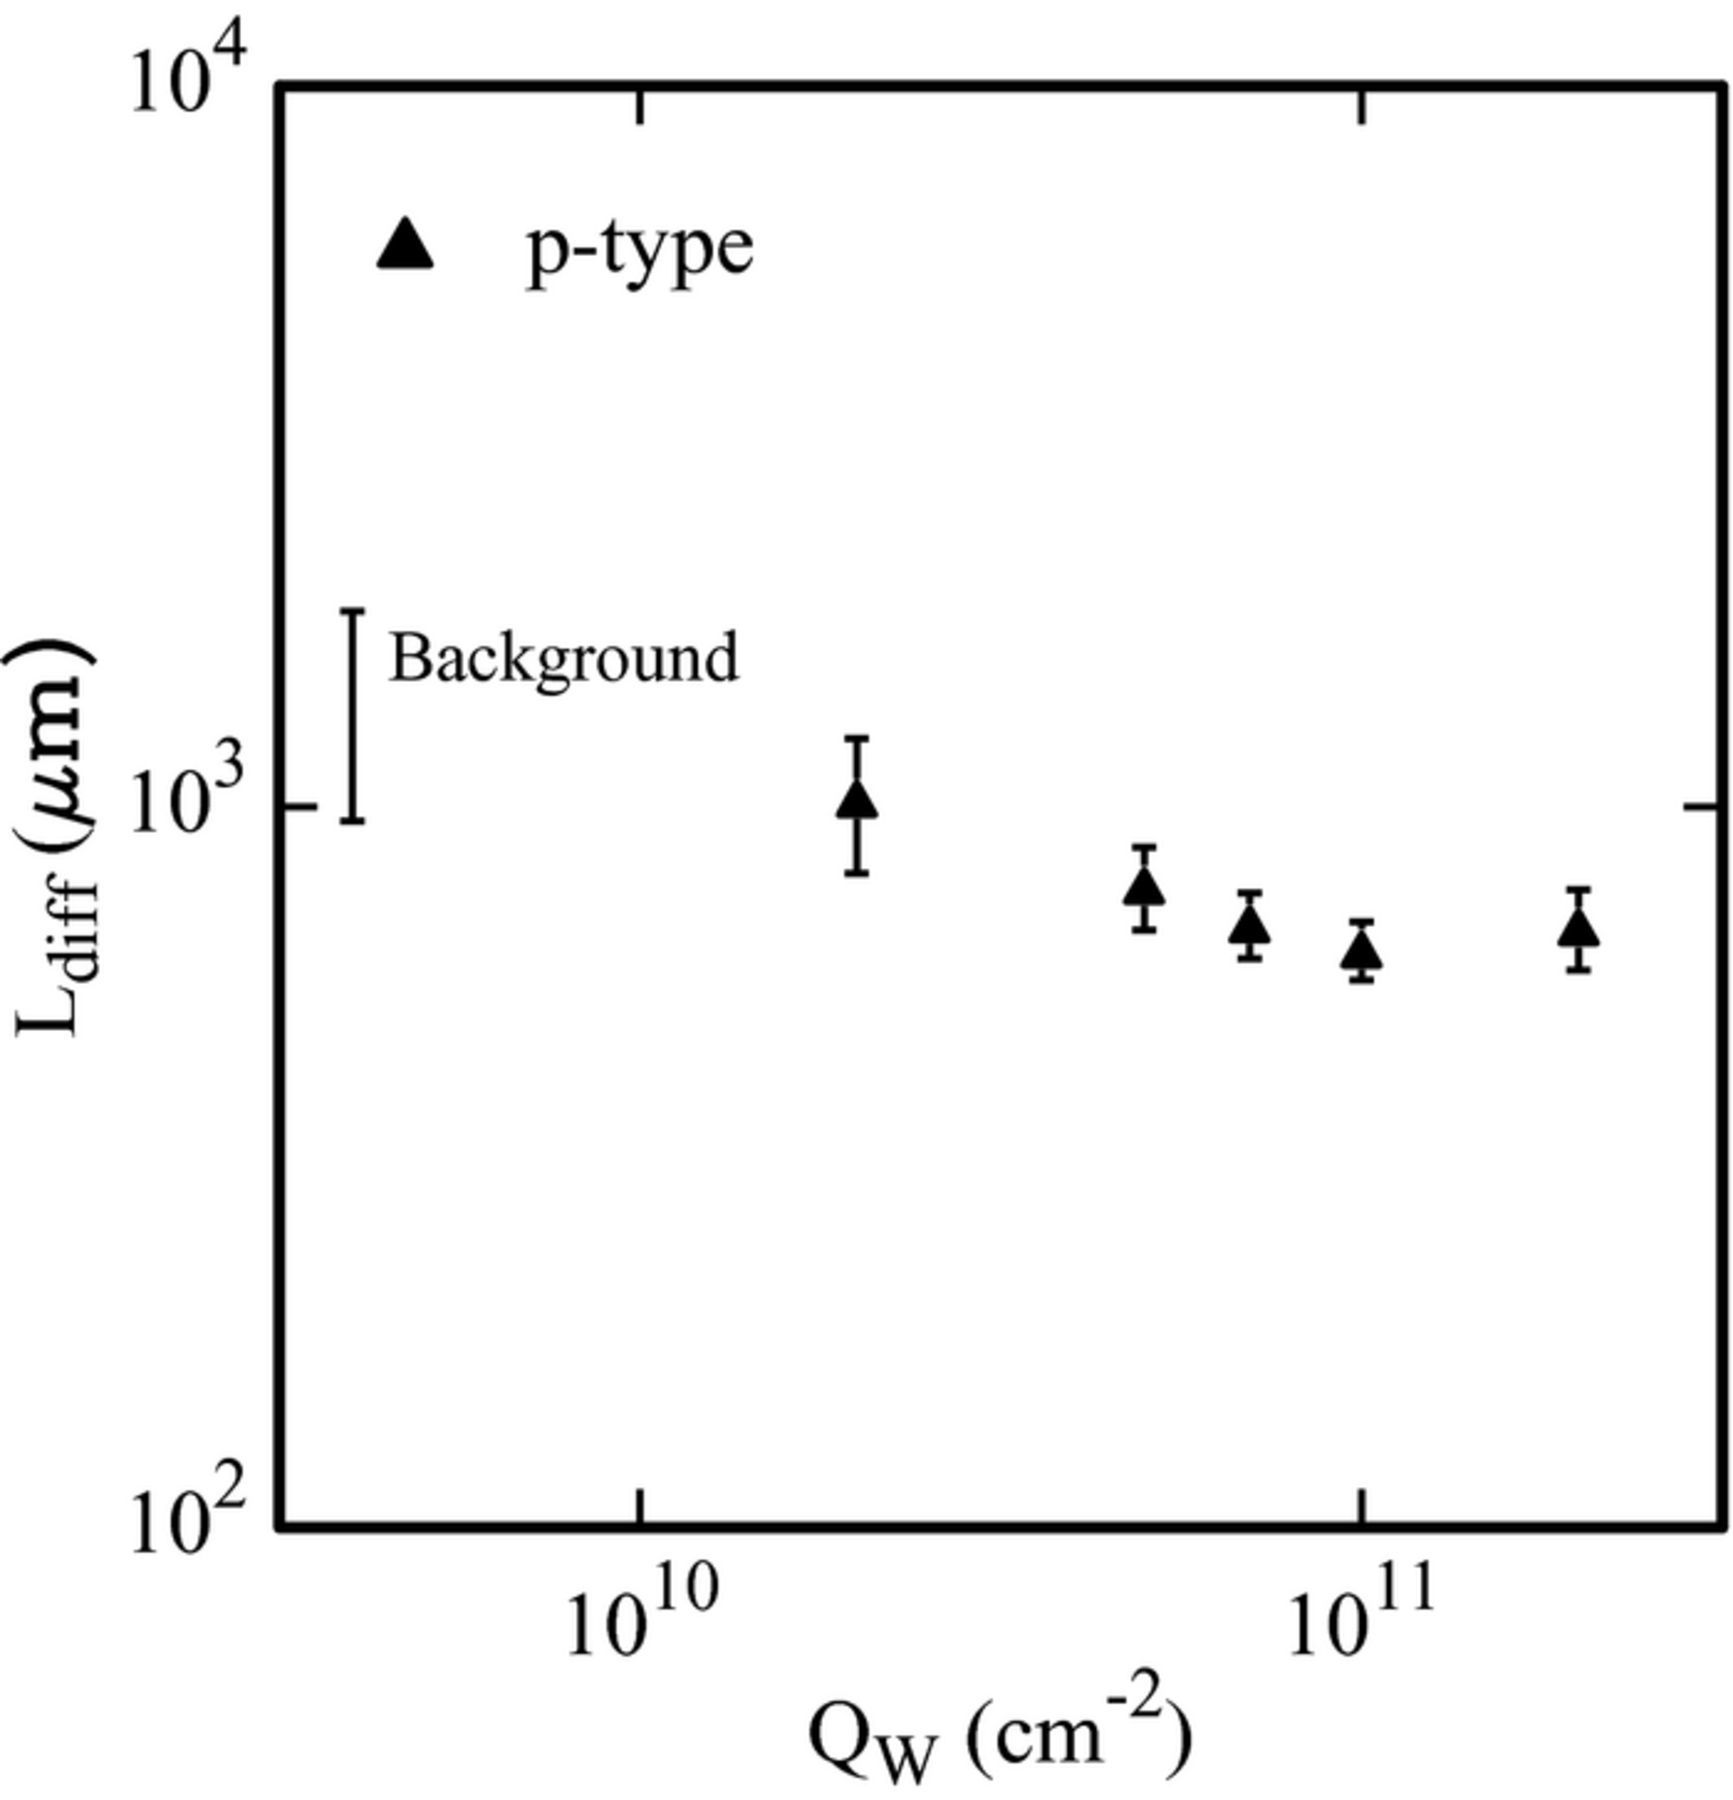
Figure 5. Carrier diffusion length measured by SPV as a function of the tungsten dose in p-type silicon (see Ref. 23).
No optical activation was observed in tungsten-implanted p-type wafers, so tungsten too is included among the “Other impurities” in SPV measurements. Fig. 6 reports the concentration of “Other impurities” as a function of the tungsten dose. The impurity concentration obtained from SPV measurements increases in proportion to the tungsten dose up to 7·1010 cm−2 dose, then saturation and finally decrease of the electrically active impurity concentration is observed. These data indicate that tungsten deactivates starting from very low doses. We also note that SPV detects a very low concentration of active impurities, because of the low tungsten diffusivity.
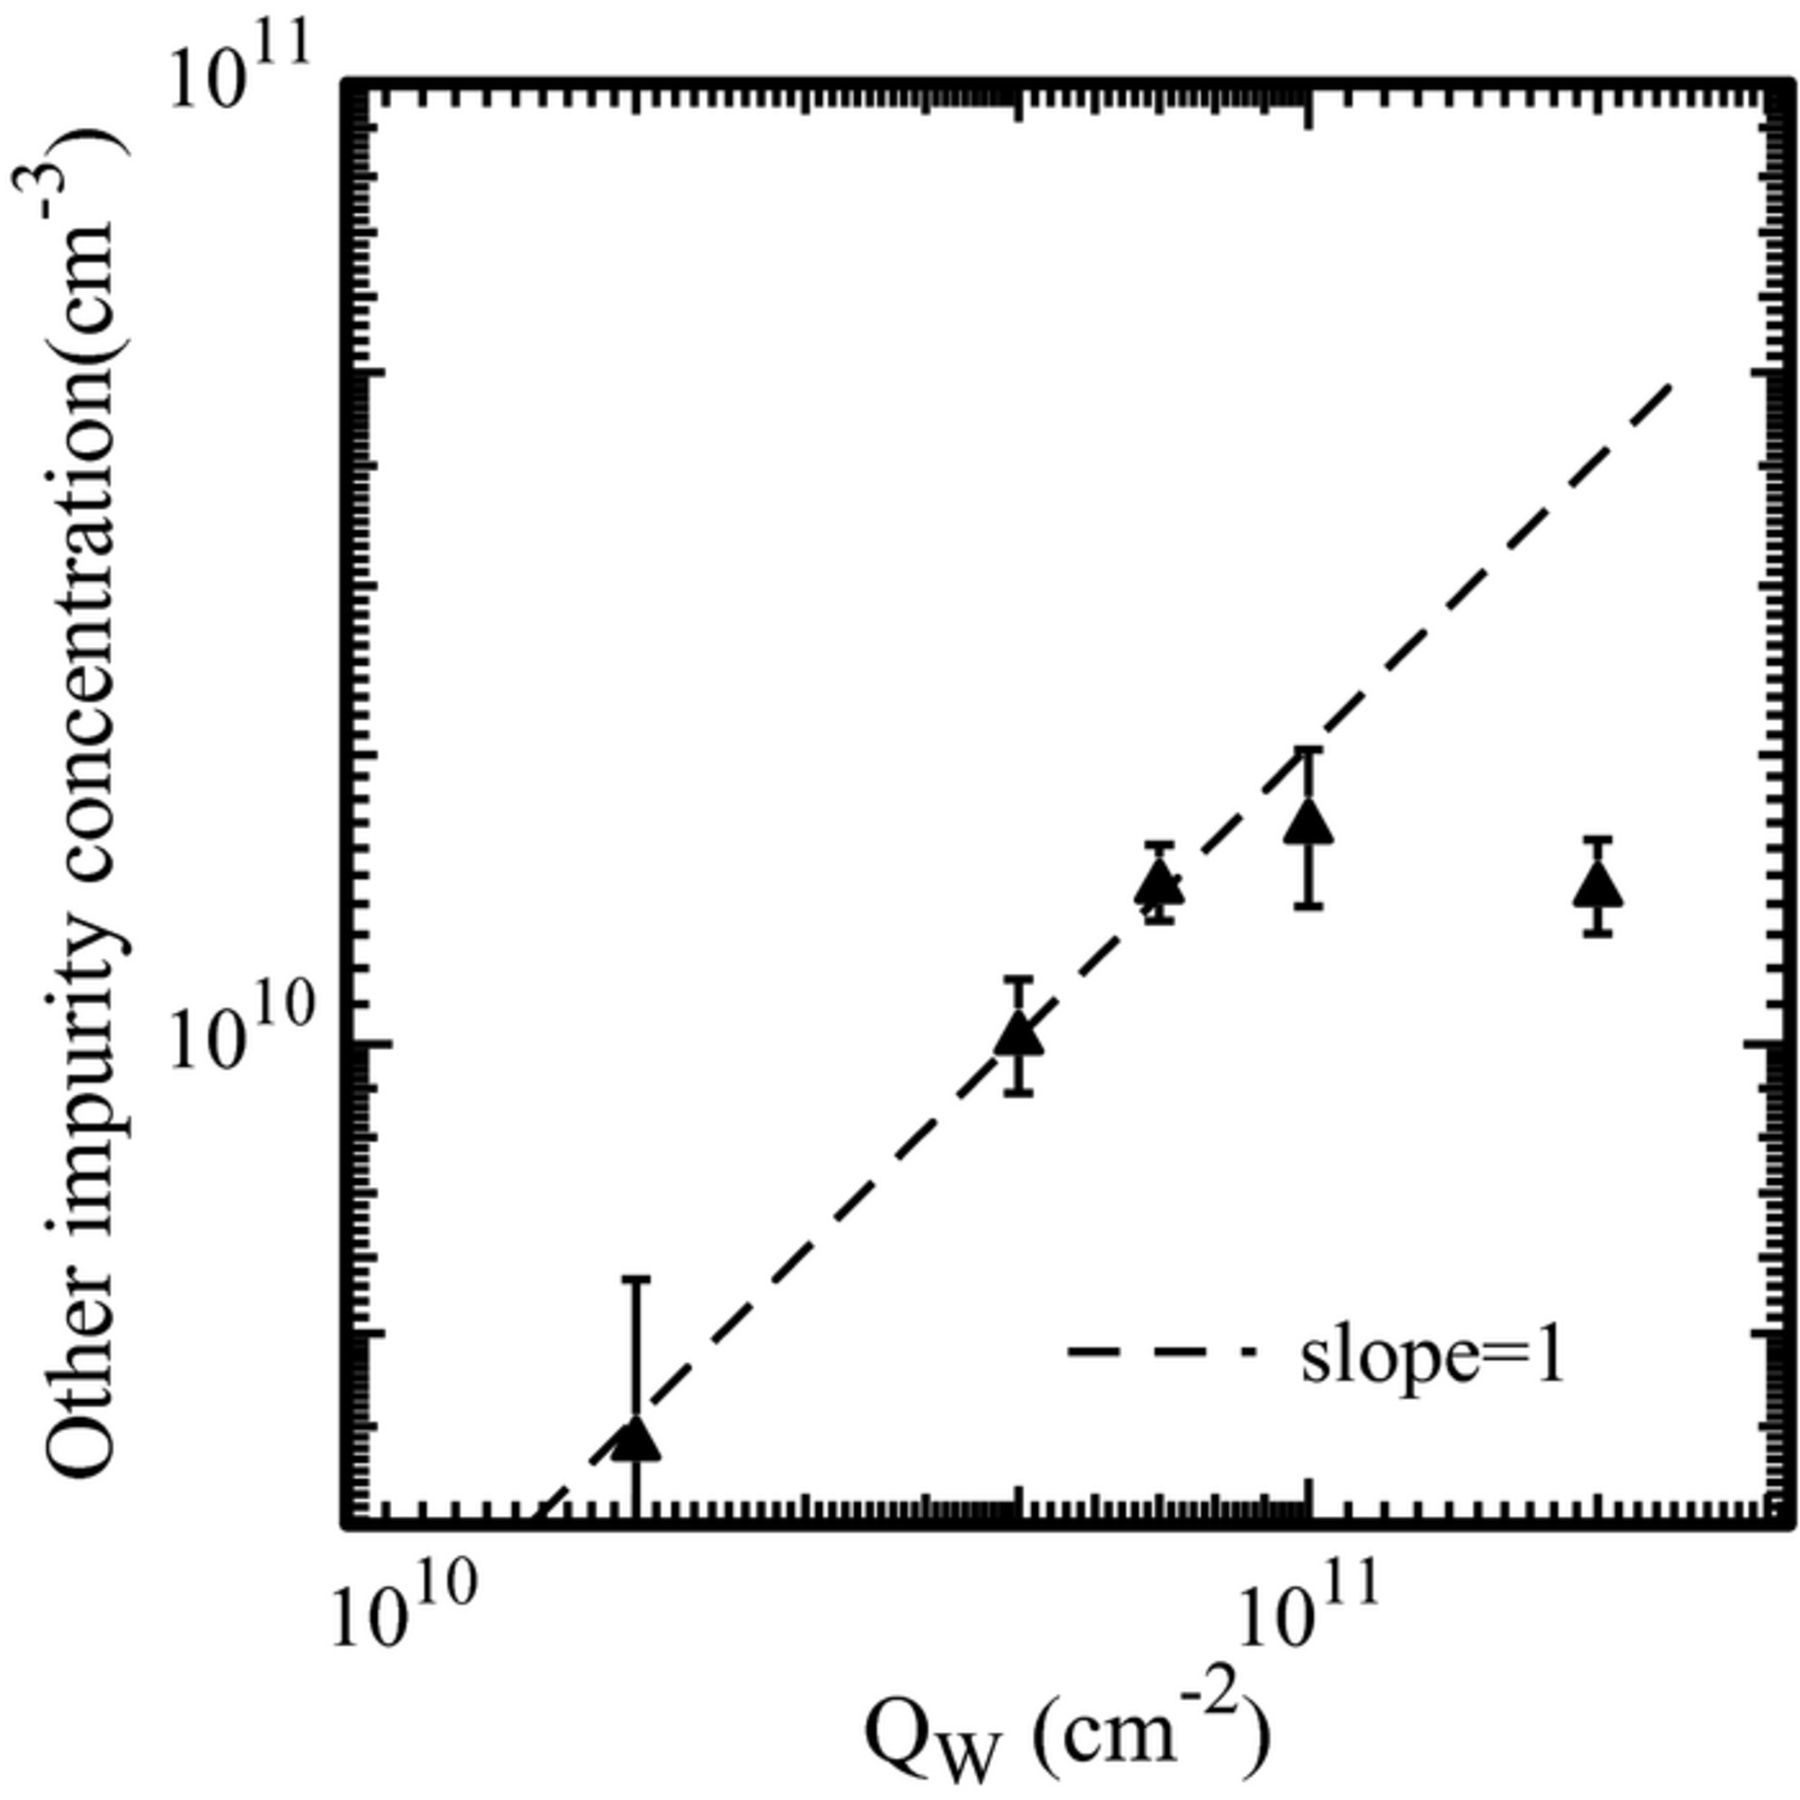
Figure 6. Concentration of not-activated impurities calculated from SPV measurements before and after activation (see Ref. 23), as a function of the tungsten dose. These data were obtained in p-type silicon wafers.
The SPV results are consistent with previous DLTS measurements, showing that tungsten deactivates starting from very low doses (about 7·1010 cm−2,24). In those experiments, the main tungsten level located 0.4 eV above valence band saturates at about 2·1013 cm−3 for 7·1010 cm−2 implanted dose, and decreases if the dose is further increased. No other tungsten-related traps were found to be associated to tungsten deactivation.
Photoluminescence intensity
In Fig. 7 the band-to-band photoluminescence intensity is reported as a function of the tungsten dose (a), and of the concentration in the solid solution as measured by DLTS [W]DLTS. As in the case of molybdenum, in the wafers of the present study the tungsten dose in silicon was 50% of the total implanted dose, and this fact was taken into account when reporting the data in Fig. 7b. The band-to-band photoluminescence intensity roughly decreases as the inverse implanted dose up to 7·1010 cm−2 dose, then saturation is observed. If reported as a function of the tungsten concentration in the solid solution (Fig. 7b), the band-to-band photoluminescence intensity decreases as the inverse tungsten concentration. Because of the previously mentioned tungsten deactivation, the tungsten doses of 1011 cm−2 and 2·1011 cm−2 roughly correspond to the same electrically active tungsten concentration in silicon, and consistently to the same photoluminescence intensity, so the data corresponding to these doses superimpose to each other in Fig. 7b. In tungsten implanted wafers too, photoluminescence intensity data do not depend on the substrate type, with the exception of the data of the samples implanted with 2·1010 cm−2 tungsten dose, where the photoluminescence intensity is sensitively lower in the p-type wafer than in the n-type wafer. By comparing these data with the data of molybdenum-implanted samples in Fig. 4, the datum of the p-type wafer implanted with 2·1010 cm−2 tungsten dose seems to be out-of-trend with respect to the other p-type wafers, and for this reason in this first analysis we consider this datum as an outlier.
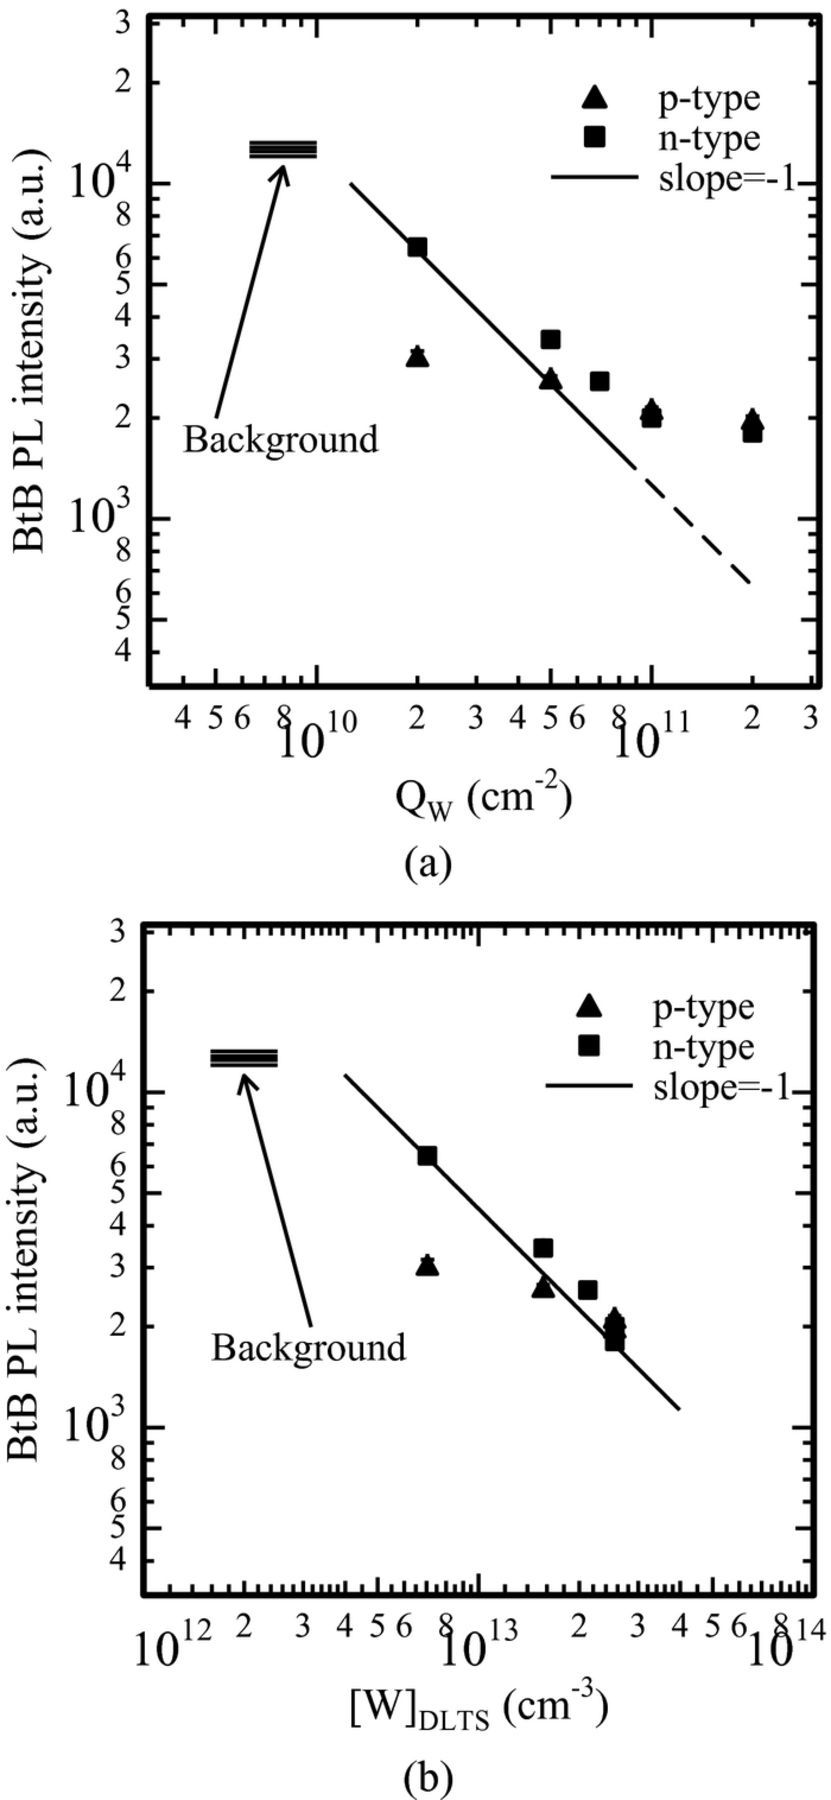
Figure 7. Band-to-band photoluminescence intensity as a function (a) of the tungsten dose, (b) of the tungsten concentration measured by DLTS in tungsten-implanted samples annealed with the same thermal treatment as the samples in this test.
Discussion
In the previous sections it has been shown that SPV data are within the background range up to about 5·1010 cm−2 molybdenum and tungsten dose. As previously mentioned, the region analyzed by SPV is about 100 μm or more, whereas the region contaminated by molybdenum and tungsten is of the order of a few microns, due to the low diffusivity of these elements.4,6 For this reason, SPV has limited sensitivity to these elements. Similar though slightly better results were obtained25 from carrier lifetime data based upon photocurrent measurements by the Elymat technique.26 In a study about molybdenum contamination in indium implantation processes, we showed that SPV failed in detecting such contamination, and Elymat detected it at the highest contamination level only. The Elymat technique is very sensitive to surface recombination27 so it could be expected that this technique is also sensitive to near-surface contaminants. However, in the Elymat technique the probed region can be as large as the whole wafer thickness, so this technique has limited sensitivity to near-surface contaminants. Vice versa, the band-to-band photoluminescence intensity depends on the contaminant concentration as the inverse concentration in the solid solution, i.e. as expected for the carrier lifetime in the ideal case of uniform contaminant distribution. This result suggests that the photoluminescence intensity signal comes from the near-surface region where contaminants are located. This is reasonable because the radiative band-to-band recombination requires high injection conditions, and such conditions are expected in the near-surface region only, because the carrier population rapidly decreases with depth. Of course, numerical simulations of the recombination process would be needed to confirm this interpretation.
The data in Figs. 4b and 7b show that the photoluminescence intensity is roughly the same whether molybdenum or tungsten contamination is considered, and depends on the contaminant concentration in the solid solution only. As the measurement conditions were the same for the two sets of samples, this comparison suggests that the carrier capture cross sections are similar for molybdenum and tungsten. In addition, it can be concluded that the electrically inactive fraction of the contaminant (as in the case of tungsten) does not affect the band-to-band photoluminescence signal, which is therefore sensitive to individual atoms in the solid solution rather than to clusters or precipitation nuclei.
Conclusions
The band-to-band photoluminescence intensity is very sensitive to the near-surface contaminant concentration in the solid solution. Both for molybdenum and for tungsten-contaminated samples photoluminescence intensity data of contaminated samples are well separated from the background level, so contamination is easily detected down to about 1010 cm−2 contaminant dose.
Conventional carrier lifetime measurements (SPV, Elymat) show limited sensitivity to this sort of contamination because of the large probing depth of these techniques.
Therefore, photoluminescence intensity measurement can be a valid alternative to conventional carrier diffusion length measurements for monitoring slow diffuser contamination.
ORCID
M. L. Polignano 0000-0001-5441-1022
