

Abstract
The cycle life and power density of Zn metal batteries depend on the anode electrodeposition morphology, including the formation of metal dendrites, and impedance, respectively. This paper investigates the influence of aqueous ZnSO4 electrolyte convection through a copper mesh anode on Zn electrodeposition morphology and current densities. Electrochemical experiments in a specially designed flow-through cell with a Zn metal cathode reveal that the electrolyte flow from the cathode through the anode improves Zn deposition morphology and reduces impedance at concentrations ranging from 0.01 to 1 mol l−1. Small flow rates at millimeters per second double the current densities. The electrodeposition morphology and current density are positively impacted at Peclet number larger than 1. At these flow rates, the Zn plating is more smooth, compact, uniformly deposited around the wire, and dense than that in the stagnant electrolyte. Zn-Cu asymmetric cell cycling tests at 50 mA cm−2 show that flow-through electrolyte can significantly increase the cell lifespan from 18 cycles in static electrolyte to 1300 cycles at a flow rate of 0.5 mm s−1. Numerical analysis illustrates that the flow-through electrolyte replenishes consumed zinc ions at the electrode surface and suppresses dendrite growth by maintaining a uniform current density distribution.
Export citation and abstract BibTeX RIS

This is an open access article distributed under the terms of the Creative Commons Attribution 4.0 License (CC BY, http://creativecommons.org/licenses/by/4.0/), which permits unrestricted reuse of the work in any medium, provided the original work is properly cited.
Large scale energy storage systems are being developed to address the increasing use of intermittent renewable energy in the grid. 1–3 Many new battery chemistries have been proposed to increase storage capacity 4,5 and extend cycle life. 6,7 Aqueous batteries stand out as an environment-friendly, low cost, safe, and scalable energy storage technology. 8 Zinc, the 24th most abundant element on Earth, has rich reserves, low-toxicity, and relatively high specific capacity (820 mAh g−1) in aqueous solutions. 9,10 However, zinc-based aqueous batteries suffer from dendrite formation on metal anodes during charging that can cause internal short circuits and reduced cycle life. 11,12
Extensive efforts have been made to stabilize surface morphology and suppress dendrite formation in aqueous batteries with Zn metal anodes, including three-dimensional (3D) current collectors, surface modification, and electrolyte additives. 3D current collectors increase surface area to accommodate zinc deposits. A 3D Cu foam electrode can accommodate zinc dendrites, achieve uniform plating and avoid dendrite shorting between electrodes. 13,14 Parker et al. fabricate a Ni-3D zinc electrode that cycles thousands of times without passivation or macroscale dendrite formation. 15
Surface modification is a method to prevent the anode from direct contact with electrolyte, reducing side reactions including corrosion and hydrogen evolution. 16 Zhao et al. demonstrate that a polyamide coating layer on zinc anodes achieves dendrite-free stripping with a 60-fold enhancement in lifetime compared with zinc foils. 17 Xie et al. report that a 3D nanoporous ZnO-coated zinc plate achieves an average 99.55% zinc utilization and 100 cycles. 18
Dendrites grow at the electrode-electrolyte interface, so electrolyte additives which improve zinc-ion adsorption on the anode surface can lead to uniform dendrite-free deposition. Jin et al. report that aqueous zinc batteries with an ion-oligomer coating cycle over 1000 times. 19 In another paper, they regulate zinc electrocrystallization using polymer-salt complexes formed spontaneously in aqueous electrolytes, facilitating zinc deposits with a hexagonal close-packed structure parallel to the electrode surface. 20 Wan et al. add Na2SO4 in the electrolyte, which significantly improves zinc deposition due to an electrostatic shell effect repelling zinc ions from dendrite tips. 21
The effects of flowing electrolyte on metallic electrodeposition have also been investigated. 22,23 Most studies demonstrate a flow-by configuration where the electrolyte flows parallel to the electrode surface. Yu et al. show that parallel flowing electrolyte increases cycling stability of the zinc aqueous batteries, leading to an ultrahigh lifespan of 18000 cycles. 24 Ma et al. show that cross flow reduces dendrite height by up to 99.4%. 25 These studies, however, exhibit low-areal capacities (<1 mAh cm−2), so significant scale-up would be needed for battery applications. Parekh et al. model dendrite growth and show analytically that parallel flow can stabilize electrodeposition, although the flow rates are relatively high. 26
Electrolyte flow perpendicular to the electrode surface, crossing through the cathode, the separator, and the anode, can mitigate ionic diffusion limitations and maintain homogeneous distribution of local current density through enhanced ion transport. Parekh et al. show analytically that flow-through electrolyte can promote stable plating and reduce dendrite growth during zinc electrodeposition, ensuring surface stabilities and preventing ion depletion. 27,28 Gordon et al. build and test a convection battery with normal flow that provides a 5.6-fold increase in ion flux in a lithium-ion cell. 29 Their analytical model indicates that the flowing electrolyte reduces concentration overpotential by 99.9% in lithium iron-phosphate chemistry. 30
In this paper, we investigate the impact of electrolyte flow on high-areal capacity (>15 mAh cm−2) zinc electrodeposition on a copper wire mesh in aqueous electrolytes with different ZnSO4 concentrations. The zinc-plated samples are imaged by scanning electron microscopy (SEM) to characterize the zinc electrodeposition morphology. Linear sweep voltammetry (LSV) and potentiostatic tests explore the diffusion-limited regime at different flow rates and the ion concentration at the electrode surface, respectively. Finally, numerical analysis elucidates the flow-through electrolyte's influence on zinc-ion concentration distribution and current density distribution around the wire circumference.
Conventional redox flow batteries have two separate electrolytes and a separator that prevents mixing. 31 The flow-through electrolyte, in this work, is compatible with most batteries that use a single electrolyte with metal electrodeposition reactions at the anode (Zn-MnO2, Zn-V2O5, etc.). The fluid carries metal ions between the cathode and the anode, alleviating dendrite formation due to ion depletion on the electrode surfaces. 29,30
Experimental
Figure 1 shows that the experimental setup has a 3D-printed reaction chamber with two silicon gaskets and electrolyte ports. The working chamber has a circular cross section with a 6 mm diameter. The distance between the two electrodes is set by the chamber thickness. The two silicone gaskets (EcoflexTM 00–50, Smooth-on, Inc.) are placed between the working chamber and electrolyte ports. During electrodeposition, Zn strips from the 0.5 mm thick and 2 mm wide Zn foil (≥99.9%, VWR) and plates on the Cu wire mesh (100 mesh, TWP Inc.). Electrolytes containing ZnSO4 are prepared using ZnSO4 7H2O (Millipore Sigma) dissolved in deionized water with different concentrations. A syringe pump (Pump 11 Elite, Harvard Apparatus) controls the flow rate from the Zn foil to the Cu wire mesh. The area of the circular section chamber (0.32 cm2) is used for current (mA/cm2) and capacity (mAh/cm2) normalization. Detailed experimental setup is presented in Fig. 1 and Fig. s1.

Figure 1. Schematic of the zinc electrodeposition experiment with flow-through electrolyte.
Download figure:
Standard image High-resolution imageA Landt CT3002AU battery tester (Landt Instruments) powers the galvanostatic and potentiostatic tests. A Solartron 1287 A electrochemical workstation (Solartron Analytical) performs LSV tests. All experiments are conducted at room temperature. The zinc-plated Cu wire meshes are disassembled, rinsed with deionized water, and dried in a vacuum drying oven. The morphology of the dried samples is captured by SEM (Quanta FEG 250, FEI Company).
Diffusion limitations determine the electrodeposition morphology, so we study the effect of electrolyte flow on electrodeposition morphology using the dimensionless Peclet number:

where  is the Reynolds number, and
  is the Schmidt number.
32
Here,
is the Schmidt number.
32
Here,  is the characteristic length scale, u is the flow velocity, v is the kinematic viscosity, and D is the diffusivity of Zn2+. For the mesh anode, the characteristic length is the wire diameter.
33–35
The diffusivity depends on concentration, and we use D = 6.12 × 10⁻¹⁰, 5.90 × 10⁻¹⁰, 3.80 × 10⁻¹⁰, 3.28 × 10⁻¹⁰ m2 s−1 for calculations of 0.01, 0.02, 0.5, and 1 M electrolyte, respectively.
36
is the characteristic length scale, u is the flow velocity, v is the kinematic viscosity, and D is the diffusivity of Zn2+. For the mesh anode, the characteristic length is the wire diameter.
33–35
The diffusivity depends on concentration, and we use D = 6.12 × 10⁻¹⁰, 5.90 × 10⁻¹⁰, 3.80 × 10⁻¹⁰, 3.28 × 10⁻¹⁰ m2 s−1 for calculations of 0.01, 0.02, 0.5, and 1 M electrolyte, respectively.
36
Results and Discussion
Impact of flow-through electrolyte in diffusion-limited regime
In the LSV tests, a platinum (Pt) wire reference electrode (99.95%, Thermo Fisher Scientific) is placed 2 mm away from the Cu wire mesh. The voltage is swept with a 5 mV s−1 scan rate. Figure 2 shows the measured current density versus applied voltage at (a) low, (b) intermediate, and (c) high ZnSO4 concentrations. In the low polarization regime, a linear relationship between applied voltage and current indicates that the electrolyte in the vicinity of the electrode replenishes the consumed zinc ions. When the current density increases to a critical value, the curve slope changes. Further polarization induces hydrodynamic instability indicated by random and irregular current responses.
37
The slopes of current density versus overpotential change at −1.45 V, −1.45 V and −1.65 V versus Pt. in 0.01 M, 0.5 M and 1 M ZnSO4 electrolytes, respectively, indicating that the impedance changes with increased polarization. The changed impedance at large polarization is possibly due to HER and electroconvection.
37
Here, we choose the current density at the transition point of the slopes as the reference current density in stagnant electrolytes ( ). The corresponding (
 ) are 5, 77, and 306 mA cm−2 in 0.01 M, 0.5 M and 1 M electrolytes, respectively. In 0.01 M electrolyte, the reference current densities with flow (
 ) increases to 7 and 10 mA cm−2 at Pe = 2, 4, respectively. Changed slopes of current density versus overpotential are not clearly observed for 0.5 and 1 M electrolyte.
  indicates that flow replenishes zinc ions and delays the onset of electroconvective instability. Flow increases current at the same voltage, so impedance is reduced.

Figure 2. Current-voltage curves of Zn electrodeposition during linear sweep voltammetry tests for (a) 0.01 M electrolyte without flow (black solid), Pe = 2 (yellow dashed), and Pe = 4 (orange dashed-dotted), (b) 0.5 M electrolyte without flow (black solid), Pe = 8 (yellow dashed), and Pe = 20 (orange dashed-dotted), and (c) 1 M electrolyte without flow (black solid), Pe = 8 (yellow dashed), and Pe = 20 (orange dashed-dotted).
Download figure:
Standard image High-resolution imageImpact of flow rates on Zn electrodeposition morphology
The flow velocity distribution is not uniform in the cell, with the highest velocity at the center of the chamber and zero velocity at the chamber walls. This results in different Zn electrodeposition morphology as shown in Fig. s2. To achieve uniform flow across the electrode, a flow distributor (e.g., quartz particles 34 ) or an electrode with a low permeability (e.g., carbon paper 38 or carbon strip 39 ) can be used. Low permeability, however, requires higher pressure and more pumping power, reducing the efficiency of the battery. The trade-off between uniform flow velocity, pressure, and pumping power will be investigated in our future work.
In this work, we examine the center of the wire mesh in stagnant and flowing electrolytes to compare electrodeposition morphology. The center is approximately 0.008 mm2 or 1/36 of the tube cross section, so the flow velocity is relatively uniform. The wire mesh is very porous, so the pressure drop is negligible.
Zn electrodeposition morphology in galvanostatic tests for 0.5 M and 1 M electrolyte are presented in Figs. 3a–3f and 3g–3l, respectively. Two galvanostatic tests are performed at the same current density of 47.4 mA cm−2 for 0.5 ( ) and 1 M (
 ) electrolyte, respectively. Figures 3a and 3g show that, in stagnant electrolytes, the deposited zinc morphology is bulbous and has randomly oriented plate-like structures. Under constant current, the ion concentration gradient near the zinc anode increases with time, enhancing zinc electrodeposition in protruding areas. The accumulated zinc deposits gradually form bulbous clusters that could fill the interelectrode space in a zinc-ion battery, causing short circuits. In contrast, no obvious zinc protrusions are observed in the flow-through electrolyte (Figs. 3d and 3j), indicating that the flowing electrolyte may homogenize ion concentration.
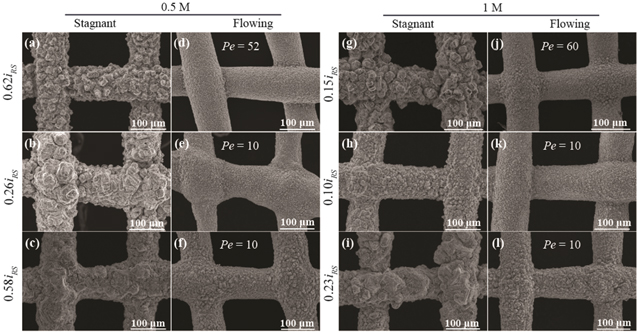
Figure 3. Zinc morphology for different concentrations, current densities, and flow rates (minimum of 15.8 mAh cm−2). (a-c) No flow, 0.5 M: (a) 47.4 mA cm−2, (b) 20.3 mA cm−2, and (c) 45.0 mA cm−2. (d-f) With flow, 0.5 M: (d) 47.4 mA cm−2, 0.79 mm s−1, (e) 20.3 mA cm−2, 0.152 mm s−1, and (f) 45.0 mA cm−2, 0.152 mm s−1. (g)–(i) No flow, 1 M: (g) 47.4 mA cm−2, (h) 32.0 mA cm−2, and (i) 71.1 mA cm−2. (j-l) With flow, 1 M: (j) 47.4 mA cm−2, 0.79 mm s−1, (k) 32.0 mA cm−2, 0.132 mm s−1, and (l) 71.1 mA cm−2, 0.132 mm s−1.
Download figure:
Standard image High-resolution imageTo investigate the impact of flow on morphology below  for 0.5 M electrolyte, we choose 20.3 mA cm−2 (
 ) and 45.0 mA cm−2 (
 ) as applied current densities. The flow rates are based on the critical Peclet number
  at which advective transport rate equals diffusive transport rate at the electrode surface, or
  For flow rates above
  convection controls mass transport. Figures 3b, 3c, 3e, 3f show the positive influence of electrolyte flow on zinc electrodeposition for 0.5 M electrolyte. The bulbous structures in Figs. 3b, 3c under no flow conditions are replaced by smooth deposits with smaller-size clusters in Figs. 3e, 3f. For the same flow rate, bulbous structures can be observed again in high current densities (
 ) in Fig. 3f, suggesting that higher flow rates may be needed for high power. We observe similar phenomenon in 1 M electrolyte where flow improves Zn electrodeposition morphology at 32 mA cm−2 (
 ) in Figs. 3h, 3k and 71.1 mA cm−2 (
 ) in Figs. 3i, 3l. We note that even at relatively high flow rates (e.g.,
  ), the flow velocity is on the order of millimeters per second, easily within range of many low flow rate and compact (e.g., peristaltic) pumps. The power required is also expected to be small because low flow rates will produce small back pressure if the electrodes are sufficiently porous. Optical microscope photos of Zn electrodeposition morphology are shown in Fig. s3.
Table s1 shows that plating current densities and capacities of Zn electrodeposition in ZnSO4 electrolyte with concentrations from 1 M to 3 M mostly range from 1 to 20 mA cm−2 and 1 to 20 mAh cm−2, respectively. Table s2 shows that, in redox flow batteries with different chemistries, the applied current densities of Zn electrodeposition mostly range from 20 to 80 mA cm−2 with capacities from 10 to 320 mAh cm−2. Large electrodeposition capacity (>100 mAh cm−2) may significantly shorten the flow batteries lifespan from hundreds to less than ten cycles. 40 The electrochemical energy is stored in the electrolyte in flow batteries and greatly determined by the volume of the stored electrolyte. The flow-through electrolyte studied in this work is compatible with most conventional batteries with metal where the electrodeposition capacity is mainly determined by the electrodes. Non-dendritic Zn morphology with 71.1 mA cm−2 and 15.8 mAh cm−2 capacity in this work indicates that flow-through electrolyte can improve the surface stability at large polarization and high-areal capacity relative to the state-of-the-art.
Figures 4a–4c show mesh cross sections for 0.5 M stagnant electrolyte, and Figs. 4d–4f exhibit cross-section morphology at Pe = 10. Dendritic structures are observed on the surface closer to the zinc source in the stagnant electrolyte (Fig. 4a), but not in the flowing electrolyte (Fig. 4d). The dendrites formed in stagnant electrolyte are needle-shaped structures with approximately 128.5 μm maximum height in Fig. 4b. In contrast, the electrode shows flat metal deposition at Pe = 10 in Fig. 4e with small, uniform structures. Most zinc deposits at the front side of the wire mesh closer to the zinc source. The deposition thicknesses on the front and back side in Figs. 4c and 4f are presented in Table I. Due to transport limitations, zinc ions preferentially deposit on the front side of the wire mesh with the shortest path to the zinc source, while fewer zinc ions take the long route to the back side. Flow helps distribute Zn plating more uniformly around the wire diameter, enabling the potential for high coulombic efficiency plating and stripping cycles. Theoretical average Zn electrodeposition thickness (h) on wire surface can be calculated as:

where r is the Cu wire radius, VZn is the deposited Zn volume based on deposition capacity, and Lwire is the effective length of wires in the wire mesh anode. The Zn plating deposition thickness is affected by many factors including plating capacity, porosity, flow condition and applied current density. For comparison, uniform distribution of Zn plating over the entire mesh surface area would produce an 11 μm thick coating for capacity of 19 mAh cm−2, while flow produces a 32 μm average thickness in 0.5 M ZnSO4 electrolyte at Pe = 10 (0.0152 mm s−1). Thus, the Zn plating is nonuniform and/or porous. Compared with stagnant electrolytes, the flow increases the compactness of Zn plating and uniformity of the deposition thickness by decreasing the ratio of the average deposition to the theoretical thickness, improving the potential for high cycle life.
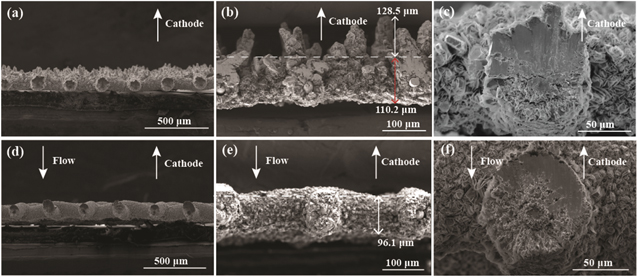
Figure 4. Cross sections of Zn-deposited Cu wire mesh with 19 mAh cm−2 capacity in 0.5 M electrolyte: (a-c) 45 mA cm−2 (0.58iRS ), no flow. (d-f) 45 mA cm−2, 0.152 mm s−1 (Pe = 10).
Download figure:
Standard image High-resolution imageTable I. Deposition thickness for 0.5 M electrolyte.
| No flow | Pe = 10 | |
|---|---|---|
| Front side (μm) | 70.9 | 39.4 |
| Back side (μm) | 19.5 | 25.1 |
| Average thickness (μm) | 45.2 | 32.3 |
| Average/theoretical thickness | 4.1 | 3.0 |
Flow influence on impedance and electrolyte concentration at the electrode surface
Potentiostatic tests are performed on a Zn strip and a Cu wire mesh separated by a 2 mm gap using 0.01 and 0.02 M electrolytes held at constant 1.2 V for 1 min while the current density is recorded. These tests investigate the influence of flow on deposition morphology around overlimiting conditions. We choose dilute solutions because tests of higher molarity electrolytes produce too much gas at the voltages needed for overlimiting conditions. The Sand's time (time of minimum current) is:

where z is the electron number, F is the Faraday constant, c is the concentration of Zn2+, j is the current density, and t+
is the cation transference number.
37
The Sand's time is the characteristic time that indicates the salt concentration at the electrode surface approaches zero.
41
Figure 5 shows that the current density initially grows and then drops to a minimum, indicating diffusion-limited conditions associated with ion concentration reaching zero at the anode surface. The increased current after reaching the minimum possibly results from the electroconvective flux to the electrode surface due to unstable convective fluid motions driven by the electric field and the initiation of gassing. Using the diffusivity values above, the calculated Sand's time of 0.01 M and 0.02 M are 18 s and 11 s, respectively, comparable to the experiential values of 26 s and 19 s. In 0.01 M electrolyte, a small flow rate (Pe = 0.4) slightly changes the shape of the current response and increases minimum current density from 2.3 mA cm−2 without flow to 2.9 mA cm−2. For  the current density increases monotonically, so overlimiting conditions are not observed. The current density also increases with flow rates. Similar phenomena are observed for 0.02 M electrolyte in Fig. 5b. Figure 5c shows SEM photos of the Zn deposition at 1.2 V after 10 min in 0.01 M stagnant electrolyte. The dendritic structures are more pronounced in the stagnant dilute solution than in the previous results for moderate (0.5 M) and concentrated (1 M) solutions. Dendrites are suppressed by electrolyte flow at Pe = 2 (Fig. 5d). Similar morphological improvements for 0.02 M electrolyte are observed in Figs. 5e, 5f.

Figure 5. Current profiles in potentiostatic tests on Zn electrodeposition in (a) 0.01 M electrolyte without flow (black solid), Pe = 0.4 (blue dashed-dotted), Pe = 1 (orange dashed), and Pe = 2 (yellow dotted), and (b) 0.02 M electrolyte without flow (black solid), Pe = 0.4 (blue dashed-dotted), Pe = 1 (orange dashed), and Pe = 2 (yellow dotted). SEM images of Zn electrodeposition morphology at 1.2 V for 10 min in (c) 0.01 M electrolyte without flow, (d) 0.01 M electrolyte with Pe = 2, (e) 0.02 M electrolyte without flow, and (f) 0.02 M electrolyte with Pe = 2.
Download figure:
Standard image High-resolution imageFlow influence on the reversibility of Zn-Cu asymmetric cells
In Fig. 6, cycling tests are performed on a Zn-Cu asymmetric cell consisting of a zinc strip and copper wire mesh placed 2 mm apart in 0.5 M ZnSO4 electrolyte at a current density of 50 mA cm−2 ( ). The copper wire mesh is plated for 3 min and stripped to a cutoff voltage of −0.5 V for four cycles, followed by a full strip to cutoff voltage of −0.7 V. Figure 6 shows that in stagnant electrolyte, the cell exhibits higher polarization and short circuits after 18 cycles. At Pe = 33, however, the cell cycles for over 1300 cycles at a Coulombic Efficiency (CE) of over 80% in the first 400 cycles. Electrochemical Impedance Spectroscopy (EIS) tests in Fig. s4 show that impedance is improved by increasing flow velocity in 0.5 M ZnSO4 electrolyte.
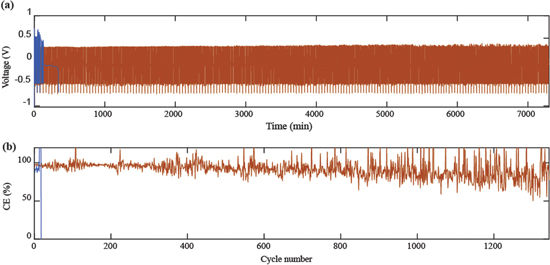
Figure 6. (a) Voltage profiles and (b) CE of Zn-Cu asymmetric cell cycling tests at a current density of 50 mA cm−2 ( ) in 0.5 M ZnSO4 electrolyte: no flow - blue line. Pe = 33 (v = 0.5 mm s−1) - red line.
Download figure:
Standard image High-resolution imageIon concentration and current density distribution
A two-dimensional (2D) model in COMSOL Multiphysics (COMSOL Inc.) provides the flow field, concentration and current density distributions at various flow rates. A detailed investigation of the influence on metal electrodeposition by flow-through and flow-by electrolytes have been reported by Parekh et al. 26–28,42 We choose a single wire to represent the wire mesh due to its repetition and symmetry. Figure 7a shows the simulation geometry and flow field at Pe = 1. Normal inflow velocities are applied to the inlet, and no pressure boundary condition is set on the outlet. Symmetry boundary conditions on the left and right model the periodic array of wires in the mesh. The 30 μm diameter half circle represents the half cross section of a wire in the mesh electrode, and this surface is assumed to have uniform potential and to sink the entire current with the surface distribution calculated by COMSOL. The flow velocity at the wire surface is zero determined by no-slip boundary condition. The streamlines converge and flow rate accelerates between wires in the mesh. Modules of laminar flow, transport of dilute species and secondary current distribution are coupled to elucidate the flow and ion transport throughout the 2D domain. The model parameters are shown in Table II. The governing equations and boundary conditions are listed in supplementary materials.

Figure 7. (a) Simulation geometry and flow field with velocity streamline included at Pe = 1. Zinc-ion concentration distribution for galvanostatic Zn electrodeposition in 0.01 M electrolyte at (b) no flow, (c) Pe = 0.1, and (d) Pe = 1.
Download figure:
Standard image High-resolution imageTable II. Simulation parameters 32,36 .
| Parameter | Value |
|---|---|
| Wire spacing | 0.071 mm |
| Cell height | 0.24 mm |
| Wire diameter | 0.015 mm |
| Zinc density | 7.13 g cm−3 |
| Zinc molar mass | 65.4 g mol−1 |
| Electrolyte concentration | 0.01 mol dm−3 |
| Electrolyte density | 1001.7 kg m−3 |
| Electrolyte conductivity | 0.1 S m−1 |
| Electrolyte viscosity | 8.2 × 10⁻⁴ Pa·s |
| Exchange current density | 0.012 mA cm−2 |
| Dendrite height | 0.01 mm |
| Dendrite top width | 0.001 mm |
| Dendrite bottom width | 0.014 mm |
| Diffusion coefficient of Zn2+ | 6.12 × 10⁻¹⁰ m2/s |
| Electrolyte flow rate (Pe = 0.1) | 0.00246 mm s−1 |
| Electrolyte flow rate (Pe = 1) | 0.0246 mm s−1 |
| Applied current density (no dendrite) | 1.20 mA cm−2 |
| Applied current density (with dendrite) | 1.55 mA cm−2 |
Figures 7b–7d show how 0.01 M flowing electrolyte affects the ion concentration distribution under a current density of 1.2 mA cm−2 applied uniformly across the inlet. The average current density normalized by the wire surface is approximately 1.8 mA cm−2. In the stagnant electrolyte shown in Fig. 7b, the concentration is almost zero (0.3 mol m−3) at the bottom of the wire, close to limiting conditions. Flow-through electrolyte (Pe = 0.1) decreases the concentration gradient with a minimum of 1.91 mol m−3 at the bottom of the wire. At 0.0246 mm s−1 (Pe = 1), the concentration distribution is more uniform with 7 mol m−3 minimum concentration across the domain. The uniformity of concentration at Pe = 1 shows how flow mitigates concentration polarization by replenishing zinc ions to the electrode surface.
Figure 8 shows the current distribution around the wire. The origin of the arc length coordinate is the bottom of the wire, and the arc length increases in the clockwise direction. In Fig. 8a, the maximum and minimum current densities are (2.0 and 1.6 mA cm−2) and (1.9 and 1.8 mA cm−2) at Pe = 0.1 and Pe = 1, respectively. In contrast, the local current density in stagnant electrolyte ranges from 0.8 to 2.4 mA cm−2 due to uneven ion concentration distribution. The extremums are located at the top and the bottom of the wire, consistent with the experimentally measured zinc thickness distribution for 0.5 M electrolyte (Fig. 4c).

Figure 8. Local current density distribution along (a) the wire circumference without flow (black solid), Pe = 0.1 (yellow dashed), and Pe = 1 (orange dashed-dotted), and (b) the wire circumference with a needle-shaped dendrite without flow (black solid), Pe = 0.1 (yellow dashed), and Pe = 1 (orange dashed-dotted) for 0.01 M electrolyte.
Download figure:
Standard image High-resolution image
A needle-shaped dendritic structure is included at the top of the wire for the results in Fig. 8b. With a 10 μm dendrite (1/3 of the wire diameter), the concentration variation around the wire increases the local current density difference (Fig. 8b). The current density at the dendrite tip (3.0 mA cm−2) is approximately 3 times the current density at the wire bottom (1.1 mA cm−2), indicating preferential plating on dendrite tips. For Pe = 1, dendrite tip's current density (2 mA cm−2) is only slightly larger than the minimum (1.8 mA cm−2) at the wire bottom, indicating the mitigation of dendrite growth. This illustrates that flow-through electrolyte can suppress dendrite growth by maintaining a homogeneous current distribution.
Conclusions
Electrolyte flow through a copper wire mesh anode improves zinc metal electrodeposition morphology and impedance over a wide range of electrolyte concentrations. With flowing electrolytes, the onset of electroconvective instability is delayed, and the reference current density for 0.01 M electrolyte increases from 5 to 10 mA cm−2 at Pe = 4. In dilute solutions (0.01 and 0.02 M), the elevated current density in potentiostatic tests with flowing electrolyte demonstrates reduced impedance, indicating that flow replenishes consumed zinc ions and maintains nonzero concentration at the electrode surface. Numerical analysis and EIS tests confirm this hypothesis, showing that flow significantly reduces ion concentration polarization and suppresses dendrite growth by maintaining homogeneous current density distribution on the wire electrode. The Zn-Cu asymmetric cell cycling results show that in stagnant electrolyte, the cell experiences larger polarization due to high impedance and suffers from internal shorting after 18 cycles. At a flow rate of 0.5 mm s−1, the flow-assisted cell demonstrates a significantly improved lifespan of 1300 cycles, increasing the cell lifespan by more than a factor of 70. SEM images show that electrolyte flow at  improves plating morphology at concentrations ranging from 0.01 to 1 M under galvanostatic and potentiostatic conditions.
Acknowledgments
We would like to thank Dr. Feifei Shi (Department of Energy and Mineral Engineering, Penn State University) for her advice on the experiments.
Supplementary data (1 MB PDF)