
Abstract
The time-dependent corrosion behavior of pure aluminum (Al) in a chloride-containing environment was investigated using various electrochemical and characterization techniques for up to 336 h. Transmission electron microscopic and secondary ion mass spectroscopic analysis revealed the continuous dissolution of the surface film over the immersion time. In the meantime, the increasing passive oxide thickness resulted in the surface film resistance enhancement over the immersion time, as indicated by the electrochemical impedance spectroscopic analysis. The electrochemical noise measurements showed an increase in the corrosion kinetics with immersion time until 60 h because of the accelerated localized corrosion in the early stage of immersion. However, an inhibition in corrosion kinetics occurred after longer immersion times due to corrosion product deposition inside the pit.
Export citation and abstract BibTeX RIS

This is an open access article distributed under the terms of the Creative Commons Attribution 4.0 License (CC BY, http://creativecommons.org/licenses/by/4.0/), which permits unrestricted reuse of the work in any medium, provided the original work is properly cited.
Aluminum is one of the essential metals for industrial applications due to its high corrosion resistance and lightweight. 1 Since Al alloys have been used in many industries such as aerospace, automobile, and marine applications, 2 understanding the corrosion of Al became a great merit. Therefore, corrosion of light metals, majorly Al, has been studied since 1930. 3 Pitting corrosion is one of the primary forms of corrosion for Al alloys. Various mechanisms for pitting corrosion are proposed, among which the following two concepts have been debated for a long time: 4
The first concept argued that the passivity breakdown and pit initiation occur when the Al substrate is exposed to an aggressive environment such as chloride ions. 5–7 The proposed mechanisms consist of three distinct stages: 5,8–10 (i) the attraction of chloride ions from the electrolyte, (ii) penetration of chloride through the oxide film, and (iii) nucleation of pits. The attraction of chloride ions to the passive film is explained using coulombic, electrostatic induction of substrate, and Van der Waals forces. 5 Moreover, it is believed that Al is positively charged at the oxide film/electrolyte interface and attracts negatively charged chloride ions when the pH of the electrolyte is lower than ∼9. 11 This phenomenon was further explained using the pH of zero charge model. 5,12,13 The attracted chloride ion penetration through the passive film was investigated using different characterization techniques. 5,7 Based on the experimental observations, several mechanisms have been proposed for the absorption of chloride ions into the passive film. 5,7 In addition, the interaction of chloride ions with the oxide film also plays a critical role in the corrosion initiation of Al. Several studies revealed that the chloride ions caused structural changes in the oxide, which resulted in the deterioration of the protective film. 7,14,15 For example, Liu et al. simulated the passivity breakdown and metastable pit initiation using density functional theory. 14 The results showed that the passivity breakdown and metastable pit initiation begin once the passive film reaches the critical chloride ion concentration. If the chloride ion concentration is below the critical value, instead of the passivity breakdown and metastable pit initiation, the passive film stability is decreased because of the increased Al-O bond length. Even though various mechanisms have been proposed for chloride ion penetration and passivity breakdown, most of them are still not conclusively validated, mainly due to the resolution limit of the existing instruments. Besides, several hypothetical models have been proposed to explain the passivity breakdown in metallic materials. For example, Macdonald et al. proposed a point defect model (PDM) to explain the chloride ion penetration through the passive film and the local breakdown of passivity in metallic materials. 16–19 According to the PDM, the dissolution of the passive film at the film/solution interface is responsible for generating the cation vacancies. At the same time, the formation of oxygen vacancies at the metal/film interface caused the chloride ion penetration through the passive film. On the other hand, the diffusion of cation vacancies through the passive film results in their accumulation at the metal/film interface, causing the pit initiation. Moreover, Natishan and McCafferty have shown that the pit nucleation in Al occurs once the electrolyte reaches the metal/film interface, resulting in hydrogen gas evolution and blisters formation. 20 The growth of formed blisters causes stress on the passive film, which results in localized cracking of the passive film due to blister rupture. 21 Furthermore, Zavadil et al. argued about precursor structures, which are chemically or physically distinct to result in oxide breakdown and the nucleation of pits. 22 It has been shown that such structures may form and grow as nanoscopic voids at the metal/film interface below the stable pitting potential and independently of the metal microstructure. The formation of voids was a function of polarization, with a similar observation also made by Huang et al. 23 The void origin was assigned to cation and anion vacancy saturation at the metal/film interface, resulting from the ionic transport properties in the oxide. However, it was concluded that the void attributes were not consistent with the vacancy condensation postulated in the PDM. Overall, the first concept uses hypothetical models to describe the chloride ion penetration mechanisms through the passive film. However, most of them are not entirely validated through the experiments. Therefore, the mechanisms for the chloride ion penetration through the passive film are still unknown for certain.
The second concept for pitting corrosion states that the effect of passivity breakdown is insignificant in causing pitting corrosion. Therefore, stable pit formation was considered the main criterion to assess the pitting susceptibility of the materials. The frequency of metastable pitting events, pit growth kinetics, and stabilization were hypothesized to be critical steps in pitting corrosion.
24–27
Pride et al. explored factors influencing the transition of metastable pitting events in high-purity Al.
28
According to the study, a higher pit growth rate for the stable pits than that in metastable pits was detected in their study. Maintaining the minimum pit chemistry due to the pit current increment over time, which resulted in  re-entrant pit geometry or re-initiation of pits within the repassivated sites have been proposed for this faster growth rate of stable pits. Additionally, Frankel et al. proposed that the critical current density and the repassivation potential are the determining factors for pitting in Al thin films.
29
re-entrant pit geometry or re-initiation of pits within the repassivated sites have been proposed for this faster growth rate of stable pits. Additionally, Frankel et al. proposed that the critical current density and the repassivation potential are the determining factors for pitting in Al thin films.
29
Electrochemical impedance spectroscopy 30,31 and electrochemical noise measurements 32–34 are powerful techniques to understand the pitting corrosion of Al and its evaluation over time. However, the long-term corrosion behavior of Al in a chloride-containing environment has rarely been investigated, 35,36 which happens to unresolve the following phenomena extensively:
- I.The structural evolution of the passive film, mainly due to the influence of aggressive anion.
- II.The mechanisms for the chloride ions and water molecules penetration through the passive film.
- III.The corrosion kinetics evaluation.
Understanding the above-mentioned events regarding the corrosion of Al is beneficial to alloy design and predicting life. Thus, this study investigates the time-dependent corrosion behavior of pure Al to address the structural modification of the passive film and corrosion kinetics evolution over the immersion time using various advanced electrochemical and characterization techniques.
Experimental
Characterization
Sample preparation
The pure Al pellets (Sigma-Aldrich chemical) with 3–12 mm diameter and 99.99% purity (other element contents ≤150.0 PPM) were utilized in this work. The sample preparation for the scanning electron microscopic (SEM) analysis, transmission electron microscopic (TEM), and secondary ion mass spectroscopic (SIMS) involved grinding of pure Al using SiC sandpapers from P400 to P1200. Then the specimen was polished up to 0.05 μm surface roughness using a colloidal silica suspension and ultrasonicated for 10 min in ethanol.
Scanning electron microscopy
The polished samples were immersed in 0.01 M NaCl for 30 min and 336 h of immersion prior to SEM. The SEM was performed using a Verios 460 L FESEM with a 20 kV accelerating voltage. Backscattered electron (BSE) mode with energy dispersive X-ray spectroscopy (EDXS) was used to characterize the microstructure.
Transmission electron microscopy
The cross-section of pure Al specimens was analyzed using ThermoFisher Talos F200X S/TEM after 30 min and 168 h of immersion in 0.01 M NaCl solution. The TEM specimens were prepared using a focused ion beam (FIB) technique—ThermoFisher Quanta 3D FEG. The region of interest within the immersed surface was identified and initially protected by platinum deposition of 300 nm using a 2 keV electron beam to minimize the ion beam damage of the region of interest. An additional 2 μm Pt-cap was deposited using a high ion beam to protect the surface during milling. Then, the prepared cross-sectional window was removed from the bulk sample using an in situ manipulator and placed on a Cu-TEM grid for thinning down to electron transparency. In TEM mode, bright field (BF) images and high-resolution (HR) TEM micrographs of the surface film were captured. In scanning transmission electron microscopy (STEM) mode, high-angle annular dark-field (HAADF) images and elemental X-ray mapping of near-surface regions were acquired to investigate passive film and the pit initiation.
Secondary ions mass spectroscopy
The elemental distribution of the surface of pure Al was analyzed using the time-of-flight secondary mass ion spectrometry (ToF-SIMS) after 30 min, 168, and 336 h of immersion in 0.01 M NaCl solution. The instrument was operated on a high mass resolution mode, and the pressure was maintained below 5 × 10⁻⁹ mbar. A pulsed Bi3 + primary ion source with 25 keV and 0.38 pA of target current was rastered over 50 × 50 μm2. Depth profiling was conducted by sputtering the surface using Cs+ ion beam with 3 keV and 2 nA target current over a 150 × 150 μm2 area. The negative ion profiles of Al2‾ (53.9636 amu) and AlO2‾ (58.9719 amu) correspond to metallic Al and Al oxide, respectively,18O− (17.9997 amu) corresponds to oxygen characteristics, OH− (17.0033 amu) represents hydroxide, and Cl‾ (34.9694 amu) indicates chloride ion.
Electrochemical tests
Cyclic potentiodynamic polarization (CPP), electrochemical impedance spectroscopy (EIS), and electrochemical noise measurements (ECN) tests were performed on pure Al in 0.01 M NaCl (pH ∼ 5.9) using VMP-300 potentiostat (Biologic) with the help of the EC-lab software. The sample preparation for the electrochemical tests involved mounting in epoxy and grounding to 1200 grit using SiC paper finish, followed by ultrasonication in ethanol for 10 min. An adhesive polymeric tape was used to avoid crevice corrosion and maintain the required exposed area. The exposed area for CPP and EIS tests was 0.178 cm2, while it was 0.079 cm2 for the ECN test. The electrochemical tests were conducted using a classical three-electrode flat cell with a Pt mech counter electrode. In addition, a saturated calomel reference electrode (SCE) was utilized as a reference electrode for all the electrochemical tests. At least three tests were performed on each condition to assure reproducibility.
Cyclic potentiodynamic polarization tests
The open-circuit potential (OCP) of the Al specimen was measured for 30 min and 14 d in 0.01 M NaCl. After that, the polarization was performed with a sweep rate of 0.167 mV.s−1 towards the more noble potential direction starting from 50 mVSCE below the OCP until the current density reached 200 μA.cm−2. Then the scanning direction was reversed until the potential reached 100 mVSCE below the OCP.
Electrochemical impedance spectroscopy
The time-dependent corrosion performance of pure Al was investigated using EIS. The sample was immersed in 0.01 M NaCl for 30 min, followed by measurements using an AC sinusoidal voltage signal with 10 mV amplitude with respect to OCP. The test frequency range was varied from 100 kHz to 1 mHz, and ten data points were acquired in each frequency decade. The EIS tests were performed every 12 h until 336 h of immersion.
Electrochemical noise measurements
Electrochemical noise measurements were conducted on a pure Al specimen after 30 min of immersion in 0.01 M NaCl. The current and potential noise were recorded for 1024 s at a 1 Hz frequency. After the initial scan, the ECN data were collected every 12 h for 336 h of immersion. The sample preparation for the ECN involved mounting two samples (not in contact) in an epoxy rod with the same exposed area. Two specimens were electrically interconnected using the working electrode and counter electrode terminals. The working electrode potential was recorded with respect to the SCE reference electrode, and the current pulse between the samples was recorded using the zero-resistance ammeter mode in the potentiostat. The power spectral density (PSD) of potential and current was used to estimate the noise resistance (Rn), and the procedure for the Rn estimation is described in Refs. 33, 37.
Results and Discussion
Localized corrosion characterization using the scanning electron microscope, and energy-dispersive X-ray spectroscopy
SEM and EDXS elemental maps of pure Al after 30 min and 336 h of immersion in 0.01 M NaCl are shown in Figs. 1 and 2, respectively. Pits were formed in both samples (Figs. 1a and 2a). After 30 min of immersion, the average pit diameter and pit area fraction were (2.3 ± 0.5) μm and 0.23%, respectively. However, both the parameters were increased over the immersion, reaching (6.1 ± 3.0) μm average pit size and 1.2% pit area fraction after 336 h of immersion. Figures 1b and 2b revealed the presence of cracks along the edge of the pit. EDXS elemental mapping exhibited Fe-Si-rich and Si-rich particles after 30 min and 336 h of immersion, respectively. Interestingly, the EDXS elemental mapping after 336 h of immersion (Fig. 2) revealed the absence of elemental Fe. This could be attributed to the corrosion products deposition on the Fe-rich particles over the immersion time, which hindered the Fe detection during EDXS analysis. The presence of the above-mentioned Fe-Si-rich and Si-rich particles facilitate the pit initiation due to the galvanic interaction. 38 Apart from the pits around heterogeneous sites, tiny pits were observed throughout the surface (Fig. 2a).
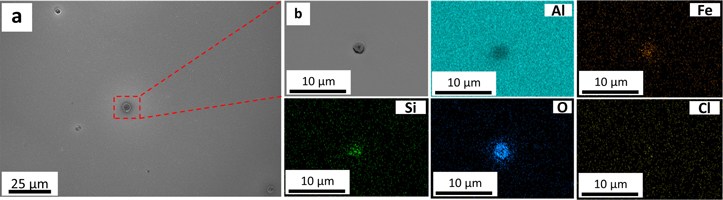
Figure 1. SEM images of pure Al after 30 min of immersion in 0.01 M NaCl: (a) low magnification image, showing pits, (b) zoomed-in region of Fig. 1a, and EDXS elemental mapping.
Download figure:
Standard image High-resolution image
Figure 2. SEM images of pure Al after 336 h of immersion in 0.01 M NaCl: (a) low magnification image, showing the distribution of pits and EDXS elemental mapping, and (b) a selected zoomed-in region from Fig. 2a, showing a pit and EDXS elemental mapping.
Download figure:
Standard image High-resolution imageTime-dependent corrosion behavior using cyclic potentiodynamic polarization, electrochemical impedance spectroscopy, and electrochemical noise measurements
Representative CPP curves for pure Al after 30 min and 336 h of immersion in 0.01 M NaCl are shown in Fig. 3. The average OCP, average passive current density 30 mVSCE below pitting potential, and the average pitting potential (Epit) of each condition are presented in Table I. The average OCP was nobler in 30 min of immersion than that in 336 h of immersion. The average passive current density 30 mVSCE below pitting potential was ∼(0.9 ± 0.7) μA.cm−2 after 336 h of immersion, which is 4.5 times higher than that in 30 min. The active OCP and increased passive current density in 336 h of immersion indicate accelerated corrosion over the immersion time. The breakdown potentials were –554 mVSCE and –542 mVSCE after 30 min and 336 h of immersion, respectively.
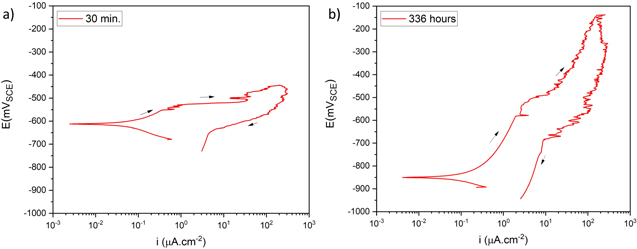
Figure 3. Representative cyclic potentiodynamic polarization curves for pure Al in 0.01 M NaCl: (a) after 30 min of immersion and (b) after 336 h of immersion.
Download figure:
Standard image High-resolution imageTable I. The average electrochemical parameters for pure Al are estimated from Fig. 3.
| Immersion time (hours) | OCP (mVSCE) | i (30 mVSCE below Epit )(μA.cm−2) | Epit (mVSCE) |
|---|---|---|---|
| 0.5 |

|

|

|
| 336 |

|

|

|
Electrochemical impedance spectroscopic analysis of pure Al for 336 h of immersion in 0.01 M NaCl is shown in Fig. 4. During the EIS test, the current passes through the passive film in two different ways for Al and its alloys depending on the applied frequency of the wave: At high frequencies, the current flows through the passive film, while at lower frequencies, localized corrosion regions such as pits are the current paths, where the passive film becomes an insulator. 39–42 Therefore, passive film and localized corrosion are characterized using various frequencies in EIS. The EIS results were fitted using Zview software, as shown in Table II. The solution resistance (Rs), constant phase element of the film (CPEfilm), and film resistance (Rfilm) were estimated using a high-frequency region. While the double layer constant phase element (CPEdl) and the charge transfer resistance (Rct) were measured at a lower frequency region. A constant phase element was used to represent the ideal capacitor deviation.
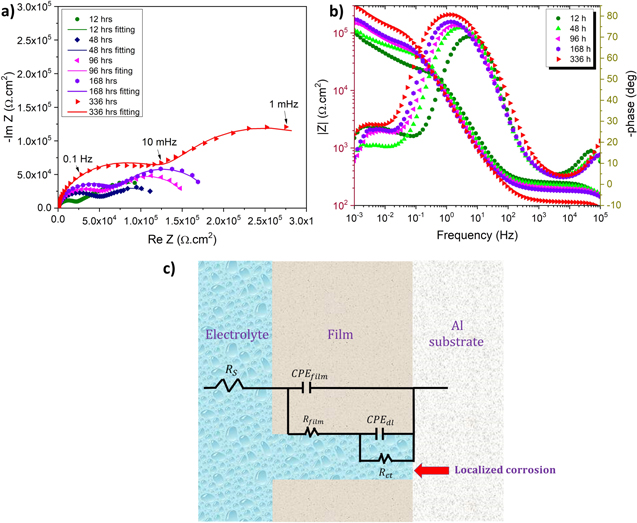
Figure 4. EIS curves for pure Al at OCP for 336 h of immersion in 0.01 M NaCl: (a) Nyquist diagram, (b) Bode plot, (c) the equivalent circuit diagram used for EIS data fitting.
Download figure:
Standard image High-resolution imageTable II. EIS fitting results for the EIS data presented in Fig. 4 for pure Al.
| Immersion time (hours) | Rs (Ω.cm2) | CPEfilm (μF.cm−2) | CPEfilm-p | Rfilm (kΩ.cm2) | CPEdl (μF.cm−2) | CPEdl-p | Rct (kΩ.cm2) | Chi-Squared (χ 10−2) |
|---|---|---|---|---|---|---|---|---|
| 12 | 257 ± 4 | 18 ± 2.3 | 0.9 ± 0 | 23 ± 1 | 252 ± 21.6 | 0.8 ± 0.1 | 115 ± 9 | 0.2 ± 0 |
| 24 | 246 ± 7 | 21 ± 2.4 | 0.9 ± 0 | 31.6 ± 3 | 284 ± 33.2 | 0.8 ± 0.1 | 87 ± 8 | 0.2 ± 0 |
| 36 | 247 ± 7 | 23 ± 3.6 | 0.8 ± 0 | 43.6 ± 3 | 448 ± 24.4 | 0.9 ± 0.1 | 74 ± 1 | 0.2±0 |
| 48 | 237 ± 2 | 24.6 ± 4 | 0.8 ± 0.1 | 53.7 ± 0 | 545 ± 27.2 | 0.9 ± 0.1 | 72 ± 1 | 0.3 ± 0 |
| 60 | 224 ± 9 | 26 ± 3.9 | 0.8 ± 0.1 | 56 ± 6 | 522 ± 35.7 | 0.9 ± 0 | 58 ± 4 | 0.4 ± 0 |
| 72 | 216 ± 4 | 26 ± 3.8 | 0.8 ± 0.1 | 67.7 ± 6 | 502 ± 13.4 | 0.9 ± 0 | 80 ± 5 | 0.4 ± 0 |
| 96 | 211 ± 2 | 27 ± 3.7 | 0.8 ± 0.1 | 81 ± 8 | 525 ± 39.2 | 0.9 ± 0 | 94 ± 3 | 0.4 ± 0 |
| 168 | 199 ± 7 | 31 ± 3.2 | 0.8 ± 0.1 | 94.2 ± 6 | 485 ± 25.1 | 0.9 ± 0 | 112 ± 9 | 0.5 ± 0.1 |
| 336 | 132 ± 7 | 29 ± 3.8 | 0.8 ± 0.1 | 101.3 ± 6 | 345 ± 28.3 | 0.8 ± 0.1 | 259 ± 20 | 0.6 ± 0.1 |
Figure 4a shows the Nyquist plot for pure Al at different immersion times. The Bode plot (Fig. 4b) revealed an increment of total impedance (|Z|) in pure Al over the immersion time until 336 h. The surface film formed on the Al substrate was characterized by two primary time constants: one was at high frequencies while the other one was at low frequencies. Additionally, a time constant has been observed at around 105 Hz. This high-frequency response could be attributed to artifacts of the cell. After 12 h of immersion, Rfilm was 23 kΩ.cm2 and increased gradually over the immersion time and reached its highest value (101 kΩ.cm2) after 336 h of immersion. This increment could be attributed to the surface film growth over the immersion time. Rct was 115 kΩ.cm2 after 12 h and decreased to 58 kΩ.cm2 after 60 h of immersion, possibly due to the accelerated localized dissolution of pure Al. Then, Rct was increased slowly over the immersion time and reached its highest value (259 kΩ.cm2) after 336 h of immersion. This Rct enhancement could be attributed to the deposition of corrosion products inside the pit, which could act as a barrier for ion transportation between electrolyte and substrate. 21 The highest CPEfilm (29 μF.cm−2) was noted after 336 h of immersion, starting with a gradual increment from 18 μF.cm−2 (after 12 h of immersion). This indicates that the surface film's hydration effect due to the various ions penetration is more dominant than the influence of surface film growth over the immersion time. 43 CPEdl was 252 μF.cm−2 after 12 h of immersion and fluctuated over the immersion time before reaching its highest value (545 μF.cm−2) after 48 h.
Electrochemical noise measurements of pure Al for different immersion times in 0.01 M NaCl are presented in Fig. 5a. The potential noise fluctuated significantly after 30 min of immersion and reached better stabilization over the immersion. The magnitude of the current transients and the average current density increased over the immersion time and reached the highest current transition after 168 h of immersion. This indicates the increment of localized corrosion activities, such as the initiation of metastable pits and the propagation of stable pits over the immersion time. The continuous corrosion inside of a stable pit compared to that of a metastable pit, which repassivates results in larger radii pits. 28 In 336 h, magnitude, and the average current density dropped and were closer to those values in 30 min of immersion. The lifetimes of an arbitrarily selected current noise after 30 min and 336 h of immersion are presented in Figs. 5c and 5d, respectively. A formed current noise quickly disappeared after 30 min of immersion than that in 336 h, revealing the reduction of the repassivation tendency of the localized activities over the immersion. 44 Figure 5b shows the Rn fluctuation over the immersion time. The highest magnitude and average Rn were 932 kΩ.cm2 and 60 kΩ.cm2, respectively, observed after 30 min of immersion. However, a gradual reduction of the average Rn (Table III) was observed until 60 h of immersion, reaching the lowest Rn (36 kΩ.cm2) followed by a slight increase for the rest of the immersion time.

Figure 5. Representative ECN curves for pure Al at various immersion times in 0.01 M NaCl: (a) current and potential noise over the immersion time, (b) noise resistance, (c) a selected zoomed-in region of 30 min of immersion plot shown in Figs. 5a, and (d) selected zoomed-in region of 336 h of immersion plot shown in Fig. 5a.
Download figure:
Standard image High-resolution imageTable III. The average noise resistance of pure Al is extrapolated from Fig. 5b.
| Immersion time (hours) | Rn(kΩ.cm2) |
|---|---|
| 0.5 | 60 ± 5.1 |
| 12 | 59 ± 4.3 |
| 24 | 51 ± 7.2 |
| 48 | 47 ± 6.5 |
| 60 | 36 ± 6.1 |
| 72 | 43 ± 4.6 |
| 168 | 39 ± 4.7 |
| 336 | 38 ± 5.2 |
Corrosion characterization using transmission electron microscope and secondary ion mass spectrometry
Transmission electron microscopic analysis was performed on the cross-section of pure Al after 30 min of immersion in 0.01 M NaCl, as shown in Fig. 6. Low magnification bright field image (Fig. 6a) of the cross-section revealed the presence of several grains. Figure 6b shows the passive film at the distinct grains and grain boundaries. A zoomed-in region of a grain boundary was captured (Fig. 6b) and exhibited the formation of a non-uniform passive film on top of the surface. The formed passive film on both grains was amorphous in nature (Fig. 6c). The average passive film thickness formed on grain 1 was (2.3 ± 0.7) nm, while it was (5.0 ± 0.8) nm for grain 2, indicating the influence of the grain orientation on passivation. Figures 6d–6f exhibit the Al metal/film interface. Figure 6f exhibits a distinguished interface of the film/metal, revealing the crystalline Al substrate and the amorphous oxide film.

Figure 6. TEM analysis of a cross-section of pure Al after 30 min of immersion in 0.01 M NaCl: (a) low magnification BF image of FIB lift-out, showing different grains, (b) a zoomed-in region from Fig. 6a, revealing the passivation on the top of two different grains and (c) HR-TEM image with two different grain orientation and the formation of the amorphous passive film, (d),(e) and (f) HR-TEM image of the amorphous passive film and the metal/film interface.
Download figure:
Standard image High-resolution imageFigure 7 shows the STEM images of the cross-section of pure Al after 168 h of immersion in 0.01 M NaCl. The deposition of a non-uniform corrosion products layer throughout the surface was observed in Fig. 7a. This could be attributed to the continuous dissolution of the surface film, which increased the number of new pitting sites over the immersion time. The low-magnification image (Fig. 7a) shows several pit formations within grains and grain boundaries. A cross-section of a pit shown in red square in Fig. 7a is presented in Fig. 7b. The EDXS elemental map of Fig. 7b is shown in Figs. 7c–7f, which reveals the distribution of Al, O, C, Cl, and Pt. The O elemental map exhibited significant corrosion product deposition inside the pit. This deposition could cause the prevention of ion transportation between the pit and the bulk electrolyte. 21
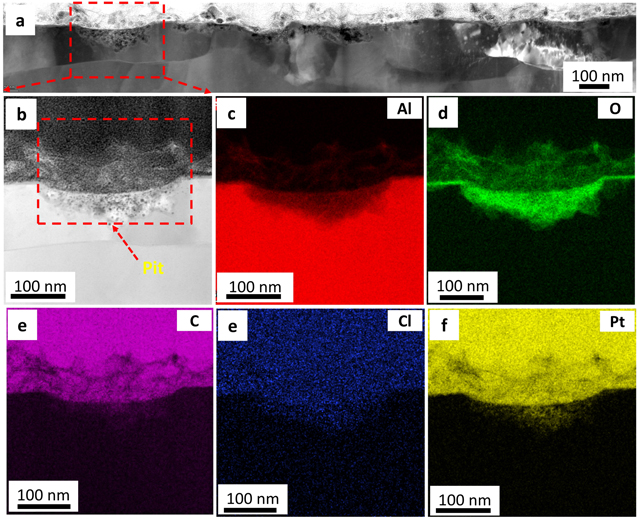
Figure 7. STEM analysis of a cross-sectional of pure Al. The top surface was exposed to 0.01 M NaCl for 168 h: (a) low magnification HAADF image of the FIB lift-out across the passive film and topmost surface, (b) a zoomed-in region of a selected pit from Figs. 7a, 7c–7f EDXS area map of Fig. 7b, revealing the elemental distribution of Al, O, C Cl, and Pt.
Download figure:
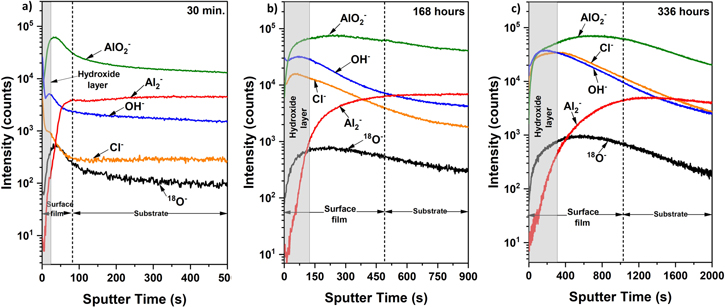
Standard image High-resolution imageThe depth profile of pure Al was analyzed using secondary ion mass spectroscopy after 30 min, 168 h, and 336 h of immersion in 0.01 M NaCl and is presented in Fig. 8. Al2‾, AlO2‾, and 18O2‾ in the curves represent metallic Al, oxidized Al, and oxide, respectively. Two regions were defined as surface film and substrate, where the metallic Al intensity became steady, and oxide ions of AlO2‾ and 18O2‾ signals dropped. 45,46 However, Al2‾ ion count was used to define the surface film/substrate interface as oxide ions of AlO2 − and 18O− signals do not drop instantly with the sputtering time in 168 h and 336 h of immersion. The intensity of Al2‾ was steady after ∼82 s, 490 s, and 1024 s sputtering time after 30 min, 168 h, and 336 h of immersion, respectively. This reveals the surface film growth over the immersion time and could be attributed to the surface film resistance improvement, as indicated in the EIS analysis. The outermost surface film (gray shaded area) shows the presence of OH‾ and Cl‾ ions, indicating the presence of hydroxide formation. The thickness of this hydroxide layer increased over the immersion time from ∼22 s (30 min.) to ∼325 s (336 h). Moving towards the metal surface, the AlO2‾ ion indicates the formation of the passive oxide layer. After 30 min of immersion, the OH‾ and Cl‾ ions showed a sudden drop as the AlO2‾ ion spiked up, indicating an effective barrier due to the passive film and preventing chloride ions penetration. With the increase in immersion time (i.e., 168 and 336 h), the progression of the Cl‾ ion signal within the oxide region reveals the successful penetration of chloride through the passive film, which gradually dropped with the sputtering time. Meanwhile, the progression of OH‾ ion shows the formation of corrosion product over the passive film. The gradual penetration of Cl‾ ion through the passive film with the immersion time could have reduced passive film stability.
Figure 8. ToF-SIMS negative ion depth profiles of pure Al in 0.01 M NaCl after: (a) 30 min, (b) 168 h, and (c) 336 h of immersion. The gray shaded area and the dotted line indicate the hydroxide layer and surface film/substrate interface, respectively.
Download figure:
Standard image High-resolution image
Discussion
Passive film evaluation over the immersion
SIMS analysis revealed the chloride penetration through the surface film once the sample is exposed to a chloride-containing environment. This chloride penetration could be ascribed to the oxygen vacancies in the passive film, as widely accepted in the literature. 5,7,19,47,48 As a result, the surface film stability reduces, allowing the transportation of water molecules through the surface film. 5 High OH‾ intensity at the top surface showed that the surface film dissolution occurs at the film/solution interface. The hydrating passive film involves the reaction between Al-O-Al bonds and water molecules to generate Al-OH bonds. 49 Each water molecule consumption results in the formation of two Al-OH bonds. Additionally, hydrolysis could lead to lattice modification and changing bond lengths. 49 Such a structural modification in the passive film increases the passive film's corrosion susceptibility, leading to the surface film's continuous dissolution over the immersion time. The chloride penetration increased significantly over the immersion time. This could have resulted in the continuous dissolution of the surface film over the exposure time, as evidenced by the increased intensity of OH‾ ions over the immersion in SIMS analysis. The continuous dissolution would lead to the enhanced conductivity of the surface film, which resulted in the surface film capacitance increments over the immersion time in the EIS analysis.
Pit initiation and pitting corrosion kinetics over the immersion
It has been widely accepted that the pitting initiation takes place near the metal film interface in Al, resulting in the formation of nanoscopic voids and/or blisters within occulled cell. 5,22,50 The localized dissolution of formed Al3+ within the pitting site causes localized acidification. Therefore, chloride ion transportation takes place toward the pit to maintain charge neutrality inside the pit. 51 The formation of a critical pit environment causes pit growth, resulting in localized cracking of the passive film and direct exposure between the pit and the electrolyte. Once the pit has been exposed to the electrolyte, the pitting kinetics has been accelerated. To support that, a considerably decreased charge transfer and noise resistance within 12–60 h of immersion has been observed (Tables II and III), which indicates increased localized corrosion kinetics over the immersion time until 60 h. In addition, a significant increase in the double-layer CPE was detected between 12–48 h of immersion. The faster dissolution of Al from the matrix could lead to excess Al3+ ions at the outermost part of the surface film. This phenomenon possibly caused strong charge separation between the outmost surface at localized dissolution points and the electrolyte, resulting in a higher double-layer CPE. The stability of these formed pits is mainly determined by the sustainability of the pit critical pit solution, which prevents the repassivation inside the pit. 51 It has been reported that the chloride ion concentration also plays a critical role in pit current increment because it helps to maintain the acidic environment inside the pits. 5 However, ion transportation between the electrolyte and the pit solution is the key to enhanced corrosion kinetics over time. Interestingly, the deposition of corrosion products within the pits was observed in the cross-sectional analysis of the pit over the immersion time (Figs. 7b and 7d). This deposition could act as a barrier to ion transportation between the electrolyte and the substrate. 21 Thus, it can be proposed that the deposition of corrosion products inside the stable pits resulted in an increase in the charge transfer resistance, which controlled localized corrosion kinetics after 60 h of immersion. Although the continuous dissolution of the surface film resulted in the increment of overall corrosion kinetics of pure Al with the increase in the immersion time, as indicated by the passive current density increment in Table I and ECN resistance reduction (Table III).
Conclusions
The time-dependent corrosion behavior of pure Al was investigated using various characterization and electrochemical tools. The following conclusions regarding the evolution of passive film and corrosion kinetics over the immersion were developed based on the experimental results:
- The initial charge transfer resistance, as indicated by the electrochemical impedance spectroscopic analysis and noise resistance extrapolated by the electrochemical noise resistance, reached the minimum value after 60 h of immersion due to the increased localized corrosion rate between 12–60 h. However, the corrosion product deposition inside the stable pits resulted in a reduction in the corrosion kinetics after 60 h.
- Transmission electron microscopic analysis revealed a formation of a non-uniform amorphous surface film on the Al substrate. In addition, the surface film thickness varied depending on the grain orientation.
- As indicated by secondary ion mass spectroscopic analysis, Cl− ion penetration depth was increased over the immersion time. This resulted in accelerated surface film dissolution at the film/solution interface and the deposition of the corrosion products on the outermost surface. This deposition caused the surface film resistance to increase as indicated by electrochemical impedance spectroscopic analysis.
Acknowledgments
The financial support from the National Science Foundation (NSF-CMMI 2131440) under the direction of Dr. Alexis Lewis is highly acknowledged. In addition, the authors acknowledge the Analytical Instrument Facility (AIF) at North Carolina State University for facilitating the SEM. The TEM work was performed at the AIF, which is supported by the State of North Carolina and the National Science Foundation (No. ECCS-1542015).