
Abstract
Cylindrical formats for high energy lithium-ion batteries shifted from 18650 to 21700 types offering higher volumetric energy density and lower manufacturing costs. Bigger formats such as 26650 may be of benefit as well, but longer electrodes and increased heat accumulation due to larger cell diameters are challenging for the batterys design and performance. An experimental review of state-of-the-art cylindrical lithium-ion batteries implies a delayed development of high energy 26650 cells. Optimized and prospective tab designs are discussed for high energy 18650, 21700 and 26650 formats using an experimentally-validated multi-dimensional multiphysics model of a silicon-graphite/nickel-rich lithium-ion battery. The model incorporates several 1D electrochemical models combined with a 2D electrical and a 3D thermal model. Novel in- and through-plane voltage-drop analysis reveals a dominant influence of the tab design on the cells total polarization, where a multi-tab instead of a single-tab design can improve the fast charging efficiency by up to +23% SoC. Fast charging profiles are adapted to tab design and cylindrical format, which prevent overheatings and the local onset of lithium plating across the active electrode area. Multi-tab design is recommended for high energy 26650 cells, but imbalances in SoC and temperature suggest alternative formats at slightly reduced cell diameters.
Export citation and abstract BibTeX RIS

This is an open access article distributed under the terms of the Creative Commons Attribution 4.0 License (CC BY, http://creativecommons.org/licenses/by/4.0/), which permits unrestricted reuse of the work in any medium, provided the original work is properly cited.
The expanding global market penetration of electric vehicles (EVs)1 poses performance challenges for the necessary electrical energy storage system incorporating lithium-ion batteries (LIBs) in form of prolonged lifetime, improved safety, enhanced power capability, and higher energy density on battery pack, module, and cell level. Forecasts2,3 assume a tremendous increase of the required battery production volumes to serve the market demand, which comes with significant pressure on cell price, and thus the need to reduce manufacturing costs of battery cells which cause around 70% of the total costs for a battery pack.2 The design of high-performance yet low-cost cells is a field of research and development which recently gains substantial attention4–6 ranging from improving manufacturing processes7–9 to enhancing overall cell design.10 On a microscopic scale, cell modifications aim for novel active materials,11,12 efficient insertion of passive components such as binder,13,14 modification of liquid electrolytes,15–17 resilient and fail-safe separators,17,18 or sophisticated design of electrode coating.19,20 Macroscopic design modifications focus on electrode geometry such as length and height,21,22 current collector tab design,23,24 and final outer cell format (i.e. pouch-type, cylindrical, and prismatic) incorporating either stacked, z-folded, or spirally-wound electrode-pairs.25,26 In this work, we focus on the macroscopic design aspects, especially on the cylindrical cell format coming with a spirally-wound electrode stack/jelly roll of different sizes and tab designs. Maximizing the volumetric energy density on cell and module level comes with losses in cooling performance compared to pouch-type and prismatic cell formats.10 In that respect, cylindrical formats such as the 21700 cells offer the highest potential for further development with the expected, lowest manufacturing costs until 2025.10 Further reduction of the manufacturing costs could possibly be achieved via increasing the cylindrical cell size,27 which most likely causes safety issues due to a further increased heat generation and accumulation as well as decreased cooling performance. A change from the standard 18650 to the 20700/21700 cylindrical format was observed in the last years28,29 and the question comes up, if the cylindrical format is suitable for a further dimensional expansion incorporating state-of-the-art and future high-compressed electrodes with high-capacitive active materials. In this matter, macroscopic design aspects such as the electrode length and height as well as the tab design have most likely significant influence on the safety, power capability, and lifetime performance.24,25,30,31
In this work, we reflect the state-of-the-art design of cylindrical cell formats via post-mortem analysis and experimental measurements of full and half cell characteristics. Using a multi-dimensional, multiphysics modelling framework (MuDiMod), the presented simulation based work deals with the analysis of power capability, energy efficiency, and safety characteristics under various cooling conditions as well as lifetime predictions of state-of-the-art cylindrical high energy cell formats such as 18650 and 21700 as well as a possibly larger 26650 LIB including five different tab designs.
Experimental and Simulation based Analysis of Cylindrical Battery Behaviour
A battery cell's voltage defined by the potential difference between its terminals/tabs resulting from a certain applied current flow as well as the surface temperature of a battery cell are easy to access. Therefore, it's common practice to measure them when evaluating a battery's rate capability,32 energy density,29 safety characteristics,33 and lifetime.34 However, these global observations as the cell's voltage, current, and temperature are somewhat misleading in case a considerable variance in spatial distribution of these measures prevails. Therefore, local gradients in electrical potential and current flow,35 lithium-ion concentration,36 and temperature37 within a battery cell need to be considered either via experimental approaches (e.g. local or even in situ sensor placement) or via simulation based methods (e.g. higher dimensional multiphysics models).
The experimental modification of 2.5 Ah 26650 G/LFP cell revealed a direct correlation between the variance in electrical potential along the current collectors35,38 to local gradients in current density and state of charge (SoC) across the electrodes. This is based on electronic and ionic transport processes which are dominated by the shape of the half cell's open-circuit potential (OCP) vs Li/Li+ as well as local differences in electrode kinetics during constant current (CC) discharge up to 2C. A correlation between decreasing the number of tabs and the temperature increase within the jelly roll is shown for the same cell.23 The temperature distribution in 18650 and 26650 formats using multiple embedded micro thermocouples23,39,40 or optical fiber sensors41–43 revealed around 5 K of temperature spread between the core and the surface during a 2.2C-CC charging operation for a 3 Ah 18650 cell.41 Using an optical glass as the upper cap of a modified 18650 cell together with infra-red thermography, a 2D, radial temperature analysis37 shows a similar spread around 5 K at 3C-CC discharge. Using unmodified cells, neutron powder diffraction36,44 enables for visualizing the distribution of lithiation degrees in graphite and the cell's SoC in common 3.2 Ah 18650 cells, which shows spreads of up to 7% in the fully charged state.36 As the different modifications cannot exclude a certain impact on the cell's overall behavior and some experimental efforts are expensive and time-intensive, simulation based studies provide a fast and easily accessible alternative for local state analysis without modifying the actual cell. In the overall battery development process these studies are invaluable especially during the early stages of battery design focusing on novel design concepts.
Multi-dimensional multiphysics modelling frameworks describe local battery states along their physical meaningful length scales. In detail, the solid and liquid potentials and concentrations are solved along the thickness tstack of the electrode stack consisting of anode, separator, and cathode.45 The electrical potentials are defined along the spirally-wound electrode length wele and height hele, and the temperature within the jelly roll and the cell's housing (i.e.  ). An overview of published model frameworks in the research field is shown in Table I focusing on cylindrical cell formats. Regarding the most recent work, a 20 Ah cylindrical cell shows accelerated ageing caused by the substantial electrical heating within the current collector foils and poor intrinsic heat dissipation.24 Additionally, the local gradients show a strong correlation with the electric path determined by the tab design. It is recommended that the tab design must be optimized for the cylindrical format/electrode size, which is one focus of this work. As shown in Table I, high-capacitive cell chemistries (e.g. SiC/NMC-811) and high volumetric loadings of beyond 150 mAh cm−3 are far to little investigated. Considering the aforementioned need of high energy LIBs, our MuDiMod framework21,25,31,38,46,47 is used in this work with the experimentally validated parametrization from our previous works,31,48 which describes a SiC/NMC-811 LIB at an volumetric loading of 261 mAh cm−3 with respect to the volume of the jelly roll.
Table I. Overview of multi-dimensional multiphysics modelling frameworks focusing on cylindrical cell formats.
| Reference | Formata) | Chemistry | Volumetric loadingb) | Model approach | ||
|---|---|---|---|---|---|---|
| /mAh cm−3 | tstack | wele × hele |

|
|||
| 49 | 26–700 | G/LMO | 57.2c) | p2D18 | 2DE | 1DT |
| 52–1400 | 48.4c) | |||||
| 50 | 46–1350 | G/NCA | 102 | 3D-Continuum | ||
| 30 | 32–1150 | G/LFP | 73c) | p2D720 | 2DE | 3DT |
| 51 | 20–550c) | G/LMO | 33 | p2D56 | 3DE | 3DT |
| 52 | 18–650 | G/LMO | 13 | ESPMn.a. | 2DE | 3DT |
| 53 | 18–650 | G/NCA | 80 | ECMn.a. | 2DE | 3DT |
| 54 | 26–650 | G/LFP | 84 | p2D1 | n.a. | 3DT |
| 38 | 26–650 | G/LFP | 86 | p2D19 | 2DE | 3DT |
| 55–57 | 26–650 | G/LFP | 81 | p2D7 | n.a. | 1DT |
| 31 | 18–650 | SiC/NMC-811 | 261 | p2D197 | 2DE | 3DT |
| 58 | 44–1155 | G/NMC-532 | 127 | 3D-Continuum | ||
| 25 | 26–650 | G/NMC-111 | 99 | p2D12 | 2DE | 3DT |
| 37–910 | p2D36 | 2DE | 3DT | |||
| 53–1290 | p2D108 | 2DE | 3DT | |||
 Pseudo-two-dimensional/(Extended-)Single-Particle-/Equivalent-Circuit-Model for the electrode-stack thickness used in a total number of x.
In terms of safety, lifetime, and power capability, the suitability for fast-charging has become a key feature for current and prospective LIB technologies59,60 and will be addressed in this work via analyzing the impact of the cell's format, its tab design, and the prevailing cooling conditions on the local temperature maximum and spread across the electrodes, the overall likeliness of lithium plating, and the charging efficiency.
Multi-Dimensional Multiphysics Modelling Framework
Regarding Fig. 1 our MuDiMod framework incorporates several pseudo-two dimensional (p2D)45 models to solve for the mass balances of lithium-ions in the electrolyte cl and the active material particles cs, the solid Φl and liquid Φs potentials, and the charge balance ( ) along the thickness of the electrode stack described by the x-coordinate and separated into Anode (A), Separator (SEP), and Cathode (C) domain. The pseudo active particle domain described by the r-coordinate is coupled to the x-domain via electrode kinetics in form of the pore-wall flux jn. To account for the in-plane polarization along the current collectors' length and height, a single p2D model per finite element method (FEM) node is connected in parallel over the 2D electrical model described by the x' and y' coordinates, where the electrical potentials
  and
and  are solved under the applied current flow I. A charge balance constraint31 assures identical current flow between the p2Ds and the 2D model. A coordinate mapping from 2D to the 3D model31 enables for an numerical efficient exchange of the cumulative heat generation rate qp2D from the p2Ds and
  from the 2D model. The temperature T is then calculated at the x'', y'', and z'' coordinate in the 3D thermal model and transferred backwards. In this work, we focus on a 18560 ("blue"), 21700 ("green"), and 26650 ("red") format which requires a coordinate mapping as shown in Fig. 1. The resulting differential algebraic equation system is shown in Table VII together with the SiC/NMC-811 parameterization in Tables VIII and IX (see Appendix). Numerical details such as the numerical discretization are discussed in the supplementary material (is available online at stacks.iop.org/JES/167/130505/mmedia). The parametrization of the MuDiMod framework is experimentally validated for the 18650#1 cell as shown in our previous works.31,48 In this work, we extend our MuDiMod framework in terms of the polarization analysis according to the work of Nyman et al.61 in order to analyze and evaluate the through-plane polarization
  through the electrode stack, caused by mass and charge transport as well as reaction kinetics.25 Voltage drops caused by diffusion, ohmic losses and Butler-Volmer reaction overpotentials are calculated in each p2D model as shown in Table X (see Appendix) and depicted in Fig. 1. Via the parallel connection in the 2D model, a linear interpolation scheme between the FEM nodes46 allows calculation of the polarization through the electrode stack at every point along the electrode length and height. The in-plane polarization
  along the current collectors is derived from the variance of the 2D electrical potential field. The differentiation of in- and through-plane polarization within the current collectors and the electrode stack is only possible via using this extended modelling framework, which helps to understand and evaluate the impact of tab design and cylindrical format on the charging performance of the cell.

Figure 1. Overview of the MuDiMod framework incorporating several parallel connected p2D models, which are embedded in the 2D electrical model shown for the charging case. The coupling of each p2D is set via the adjacent solid potentials in a single FEM node to each current collector, where the temperature, heat generation, and current flow are exchanged as well. The cumulative heat generation from the p2D and the 2D model are transferred via the coordinate mapping function for cylindrical cells to the 3D thermal model, where the temperature is calculated and transferred backwards.
Download figure:
Standard image High-resolution imageState-of-the-art of Cylindrical Cell Formats
Two 18650, a single 20700, four 21700, and three 26650 cylindrical LIBs from well-known cell manufacturers are investigated to review the state-of-the-art of commercial cylindrical cell design. Performance tests applied to three cells of each cylindrical LIB comprise a capacity check-up cycle, a rate-capability test and an open-circuit voltage (OCV) characterization including differential voltage analysis (DVA) at 10 °C, 25 °C, and 40 °C together with an electrochemical impedance spectroscopy (EIS) at 25 °C using a climate chamber (VT 4021, Vötsch Industrietechnik GmbH) together with a battery cycler (CTS, Basytec) and a potentiostat (VMP3, BioLogic Science Instruments). The measurement procedures are summarized in Table XI (see Appendix). The cell design is examined via opening of the cells in an argon-filled glove box (H2O, O2 < 0.1 ppm, M.Braun Inertgas-Systeme GmbH) at a discharged state. Using scanning electron microscopy (SEM, JCM-600 JEOL Ltd.), a micrometer calliper (Micromar 40 EWV, Mahr GmbH) and rulers, the in- and through-plane geometry such as thickness, length, and height of the electrode stack are determined together with the weight (Quintix 224-1S, Sartorius Mechatronics) of the entire cell and the dismantled jelly roll. The analyzed tab designs are denoted as "number of positive tabs × number of negative tabs" within this work, which translates "1 × 1" to a single tab at each current collector. Anode and cathode samples are extracted (⊘14 mm, Hohsen Corporation) to manufacture coin cells (CR2032-type, Hohsen Corporation) vs pure lithium metal (⊘15.6 mm × 250 μm, MTI Corporation) with two glass fiber separators (⊘16 mm × 250 μm), two stainless steel spacers (⊘16 mm × 0.5 mm and 1 mm), and 90μl of 1 M LiPF6 in ethylene-carbonate (EC)/ethyl-methyl-carbonate (EMC) electrolyte (3:7 by weight, Solvionic). The anode and cathode coin cells are cycled at 10 °C, 25 °C, and 40 °C in a climate chamber (KT115, Binder) using a cycler (CTS, Basytec) at 80 μA (0.015C) CC-charge and -discharge both with a constant voltage (CV) phase and a cutoff at 0.001C between either 0.01 V and 1.5 V or 3 V and 4.3 V. Using DVA on the gained open-circuit data of full and half cells, the electrode balancing, anode- and cathode specific peaks are analyzed, which help to compare the different cylindrical formats. Finally, energy-dispersive X-ray (EDX) spectroscopy is applied to the extracted anode and cathode samples to determine the incorporated active material types, which is partly referenced to inductively coupled plasma-optical emission spectroscopy (ICP-OES, Varian 7XX-ES ICP-OES Spectrometer, Agilent Technologies) results.
Cylindrical Formats and Effective Electrode Length
As shown in Fig. 2 five different tab designs are applied to three different cylindrical formats. Each configuration is shown in Table II, which represents a single MuDiMod case. Referring to the total dimensions of a 18650, 21700, and 26650 format, the electrode length wele and height hele are calculated31 assuming a central void/mandrel-space of ⊘ 1 mm, a minimum of 5 mm additional height for the top-cap incorporating the safety vent, and 0.2 mm of thickness for the can.29 The calculated values refer to the overlap of anode and cathode and represent the active area of one electrode pair in the jelly roll.48 The five tab designs are derived from the designs of the opened cells. The dimensions of the positive and negative tab are set to 4 mm and 6 mm of length and height in accordance with the results from the opened cells. The applied tab designs result in the effective electrode lengths shown in Table II, which refer to the maximum effective distance a tab addresses within the current collectors. In general, ohmic losses within the current collectors decrease with decreasing effective length due to shorter current pathways along the electrodes. Using the effective electrode lengths facilitates the comparison between different cell formats and tab designs.
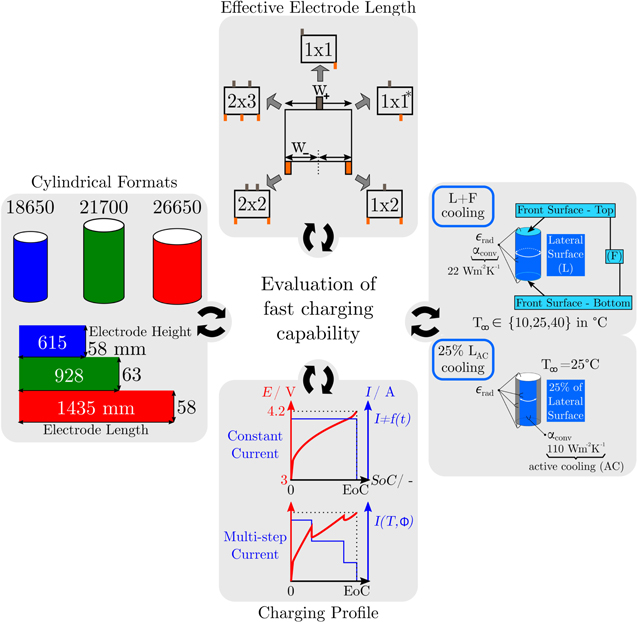
Figure 2. Overview of the simulated MuDiMod cases incorporating three differently sized, cylindrical cell formats (18650, 21700, and 26650) with the related electrode lengths and heights. Each format is applied with five different tab designs resulting in different effective electrode lengths in the 2D electrical model. Two different cooling cases are simulated. First, the ideal cooling scenario "L + F" applies convective heat transfer at 22 Wm−2 K−1 and heat radiation at the entire surface consisting of the front and bottom surface (F) as well as the lateral surface (L). Three different ambient temperatures (10 °C, 25 °C, 40 °C) are applied within the simulation studies. Second, the active cooling case applies convective heat transfer at 110 Wm−2 K−1 to 25% of the lateral surface to emulate application near cooling conditions.62 The heat radiation applies to the entire surface and the ambient temperature is set to 25 °C. The charging scenarios comprise CC and multi-step current profiles, where the latter is set to avoid overheating beyond 60 °C and lithium plating as shown in the last chapter of this work.
Download figure:
Standard image High-resolution imageTable II. Electrode dimensions and tab design of the MuDiMod frameworks for the 18650, 21700 and 26650 cylindrical formats.
| Format | Electrode sizea) | Number of tabs | Position of tabs | Effective lengths | ||||
|---|---|---|---|---|---|---|---|---|
| Length | Height | +b) | −c) | + | − | + | − | |
| wele/cm | hele/cm | w+/cm | w−/cm | |||||
| 18650d) | ||||||||
| 18650_1 × 1 | 61.5 | 5.8 | 1 | 1 |

|

|
61.5 | 61.5 |
| 18650_1 × 1* | 1 | 1 |

|

|
41 | 41 | ||
| 18650_1 × 2 | 1 | 2 |

|

|
30.8 | 30.8 | ||
| 18650_2 × 2 | 2 | 2 |

|

|
20.5 | 30.8 | ||
| 18650_2 × 3 | 2 | 3 |

|

|
20.5 | 15.6 | ||
| 21700 | ||||||||
| 1700_1 × 1 | 92.8 | 6.3 | 1 | 1 |

|

|
92.8 | 92.8 |
| 21700_1 × 1* | 1 | 1 |

|

|
61.9 | 61.9 | ||
| 21700_1 × 2 | 1 | 2 |

|

|
46.4 | 46.4 | ||
| 21700_2 × 2 | 2 | 2 |

|

|
30.9 | 46.4 | ||
| 21700_2 × 3 | 2 | 3 |

|

|
30.9 | 23.2 | ||
| 26650 | ||||||||
| 26650_1 × 1 | 143.5 | 5.8 | 1 | 1 |

|

|
143.5 | 143.5 |
| 26650_1 × 1* | 1 | 1 |

|

|
95.7 | 95.7 | ||
| 26650_1 × 2 | 1 | 2 |

|

|
71.8 | 71.8 | ||
| 26650_2 × 2 | 2 | 2 |

|

|
47.8 | 71.8 | ||
| 26650_2 × 3 | 2 | 3 |

|

|
47.8 | 35.9 | ||
a)Corresponds to the size of the active area (Aact). b)Position at y' = h. c)Position at y' = 0. d)18-650 = ⊘18 mm and 650 mm of height for the cylindrical format, incorporating a minimum of 5 mm29 additional height for the top-cap on the jelly roll and 0.2 mm29 for the housing thickness. Same assumptions are applied for the 21700 and the 26650 format.
The presented simulation study covering the different cell formats and tab designs is used to derive, which configuration is the most favourable in terms of power capability, energy density, avoidance of unwanted side reactions leading to accelerated ageing, and thermal safety. To do so, the rate capability, the gained energy efficiency, and the maximum/minimum temperature rise are evaluated. In terms of lifetime evaluation, the potential drop between the electrolyte and the active material particles at the anode/separator interface describes the likeliness of lithium plating. This potential drop is denoted as anode potential within this work. Integrated over the active area dimensions and analyzed over the charging time,31 the areal likeliness of lithium plating can be evaluated and enables a quantitative comparison between different formats and tab designs as:

Simulation Cases of Cylindrical Cell Formats
Figure 2 summarizes the MuDiMod cases as shown in Table II and shows the simulated electrical and thermal operation conditions.
First, the tab design study focusses on CC charging conditions ( ) from 1C to 4C at 25 °C. The cooling operates at the complete lateral and the two front surfaces, which is denoted as "L + F" case. A convective coefficient of 22 Wm−2 K−131 is applied at the surface of the jelly roll. The ratio between the jelly roll's surface to the housing's surface is used here to correct the smaller cooling surface of the jelly roll. The ratio is complex to be estimated and not sufficiently determined in literature, as it depends on the manufacturing tolerances, redundant separator windings, and the mechanical swelling of the cell, but is of negligible significance for this work as different formats and tab designs are compared to each other under the same thermal assumptions. The CC charging studies range from 3 V to 4.2 V and the performance is evaluated via the gained energy density, rate capability, likeliness of lithium plating, and the temperature rise. Especially the 18650 format is investigated toward in- and through-plane polarization to evaluate the influence of the effective electrode length. Next, only 25% of the cell's lateral surface are applied with an active cooling coefficient of 110 Wm−2 K−1 to emulate field-like conditions.62 The so called "25%LAC" case is used to evaluate temperature rise and spread in the jelly roll and gained energy density under a multi-step charging scenario (I(T, Φ)), which avoids overheating and critical anode potentials. In all cases heat radiation at an emissivity of 0.7548 is incorporated at the complete surface and heat dissipation of the tabs in the form of heat conduction to the ambience is neglected.
Results and Discussion
State-of-the-art of experimentally characterized cylindrical cell formats
Correlating the measured capacity C to the thickness of the electrode stack tstack and the active area Aact, the areal Cact and volumetric Cstack capacity can be compared for the different cylindrical cells and the results are shown in Table III. The maximum areal capacity appears for the 21700#2 cell with 4.74 mAh cm−2 and the maximum volumetric capacity for the 18650#1 cell with 261 mAh cm−3, which is caused by the 49 μm thicker electrode stack of the 21700#2 cell. The moderately-loaded 26650 cells reveal around 3.3 mAh cm−2 and nearly 200 mAh cm−3. The remaining cells are of high energy type such as the 18650#1 cell showing capacities of 4 mAh cm−2 and 230 mAh cm−3 or more. Only cell 21700#3 reveals a lower value around 3.49 mAh cm−2, which can be correlated to more than 10 cm longer electrodes compared to the remaining 21700 cells. The highest gravimetric energy density appears for the 18650#1 cell with 261 Wh kg−1, whereas the highest volumetric energy appears for the 21700#4 cell at 727 Wh l−1. The difference can be correlated to a higher mean cell voltage of the 21700#4 cell. The ratio of the total weight of the cell and the jelly roll is used to derive the share of passive components such as housing, safety vent, insulation plates etc.., which should be considered in terms of comparing the gravimetric energy. As a result, the lowest contribution can be observed for the 18650 cells around 15 wt.-% to 16 wt.-%, which implies that the bigger the cells, the higher the share of passive components gets with up to 18 wt.-% and 22 wt.-% for the 21700 and 26650 format, respectively. This is somewhat counter-intuitive as the general perception in lithium-ion battery research and development is that the share of passive components should decrease with increasing cell size. However, this only holds for energy optimized cells with a similar configuration of the electrode stack. The studied 18650 cells offer the maximum of capacity per cell weight, the investigated 21700 formats reveal a slightly better volumetric energy density, and the exemplary 26650 formats show a roughly 19% lower volumetric energy density due to the highest amount of passive components. The results suggest, that the 26650 format is still not fully optimized compared to the more frequently used 18650 and 21700 formats for high energy applications. A small number of 26650 samples is investigated here and to draw a more profound conclusion, future work could investigate much more 26650 high energy cells.
Table III. Experimental analysis of state-of-the-art cylindrical LIBs.
| Format | Number | Capacity | Passive | Energy densitya) | Tab designd) | Impedance | Balancing | ||||||
|---|---|---|---|---|---|---|---|---|---|---|---|---|---|
| Symbol | Ca) | Aact | Cact | Cstack | wpasb) | ξwc) | ξv | + | − |
 e) e) |
 f) f) |
 g) g) |
|
| Unit | mAh | cm2 | mAh cm−2 | mAh cm−3 | wt.-% | Wh kg−1 | Wh l−1 | mΩ |

|

|
|||
| 18650 | #1 | 3374 | 722 | 4.67 | 261 | 15 | 261 | 678 | 10 | 11 | 29.8 | 0.94 | 1.05 |
| #2 | 3322 | 726 | 4.58 | 248 | 16 | 258 | 689 | 10.33 | 11 | 25 | 0.90 | 1.06 | |
| 20700 | 4086 | 970 | 4.21 | 242 | 18 | 238 | 642 | 10.33 | 20,1 | 14.8 | 0.93 | 1.06 | |
| 21700 | #1 | 4823 | 1192 | 4.05 | 242 | 18 | 254 | 690 | 10.33 | 10.33 | 11.5 | 0.96 | 1.07 |
| #2 | 4826 | 1019 | 4.74 | 232 | 17 | 251 | 674 | 10.33 | 11 | 22.1 | 0.98 | 1.06 | |
| #3 | 4677 | 1342 | 3.49 | 234 | 17 | 249 | 696 | 10.33 | 10.33 | 12.4 | 0.99 | 1.06 | |
| #4 | 4903 | 1161 | 4.2 | 249 | 17 | 258 | 727 | 10.33 | 10.33 | 11.9 | 0.95 | 1.05 | |
| 26650 | #1 | 5138 | 1550 | 3.31 | 198 | 22 | 193 | 536 | 10.33 | 20,1 | 17.9 | 0.97 | 1.03 |
| #2 | 5340 | 1636 | 3.26 | 201 | 21 | 203 | 547 | 20.33,0.66 | 20,1 | 13.6 | n.a. | 1.09 | |
| #3 | 5400 | 1625 | 3.32 | 198 | 20 | 204 | 542 | 20.33,0.66 | 20,1 | 13.6 | n.a. | 1.09 | |
a)Measured in the last CCDCH check-up cycle at 0.5C and 25 °C (see Table XI).
b)Derived from the weight ratio of the total cell and the jelly roll.
c)Per total weight of the cell.
d)The term "20.33,0.66 × 20,1" translates to two positive tabs at the position of 0.33 and 0.66 · wcc,+ and two negative tabs at the position of 0 and 1 · wcc,−.
e)At 50% SoC, 25 °C, and  .
f)Derived from full and half cell DVA using the calculated anode Ca and cathode Cc capacity.
g)Derived from measured, geometrical sizes of the coated anode Aa and cathode Ac area.
.
f)Derived from full and half cell DVA using the calculated anode Ca and cathode Cc capacity.
g)Derived from measured, geometrical sizes of the coated anode Aa and cathode Ac area.
Various tab designs ranging from 1 × 1 to 2 × 2 (e.g. "2 × 2" incorporates 2 tabs at each electrode) appear and are summarized in the column "Tab design" of Table III. An example of the electrode stack design from the dismantled, unrolled jelly roll of cell 21700#2 is shown in the supplementary material together with an overview of all measured anode and cathode geometries including the tab design at the current collectors foils. Most commonly, a 1 × 1 tab pattern appears for the 18650 and 21700 formats, where the positive tab is either in the center (18650#1) or approximately at a third of the electrode length (18650#2 , 21700#1-4), whereas the negative tab is either at the outer end (18650#1-2, 21700#2) or also approximately at a third of the electrode length. At a maximum, a single tab operates at the entire electrode length of cell 18650#1, which provokes higher, in-plane ohmic losses represented by the highest impedance value of 29.8 mΩ as shown in Table III. Reducing the effective lengths via shifting the position of the tabs either at the cathode (18650#2 and 21700#2), the anode, or both (21700#1 , #3, and #4), consequently reduces the in-plane ohmic losses, which contribute to the measured, lower impedances. Beside, the number of tabs can also be increased leading to a similar effect as mentioned before. The 20700 and the 26650#1 cell show a 1 × 2 design, whereas the remaining 26650 cells show a configuration of 2 × 2. Comparing the performance in the rate test at 25 °C (see supplementary material), the charged capacity at 1C-CC ranges from 65% SoC for the 20700 cell to 87% SoC for the 26650#3 cell. The 26650 and the 21700 cells reach more than 81% SoC except for the 21700#2 cell revealing 75% SoC, whereas a lower performance appears for the 18650 cells with 74% SoC (18650#1) and 78% SoC (18650#2). The observed minimum for the 20700 cell can be explained by increasing rate-limiting effects which can be observed for increasing C-rates. The maximum temperature rise ranges from 3.6 K for the 18650#2 cell to 11.2 K for the 18650#1 cell during 1C-CC charge at 25 °C under free convective cooling. All 21700 cells show an increase between 5 K and 6 K, similar to the 26650 cells. Interestingly, the maximum and minimum in temperature rise can be observed for the 18650 formats and a further increase in C-rate up to 1.7C-CC discharge (maximum range of cycler) show severe overheating of up to 22.6 K for the 18650#1, whereas the 18650#2 cell shows a more than four times lower temperature increase.
Considering the observed differences in the impedance behavior, the capacity gain, and the temperature rise among the cylindrical cells, this work investigates to which extent the current collector design affects the overall cell performance. In order to do so, the properties of the electrode stack are set identically to the parametrization of cell 18650#1 in the modelling framework. A brief summary compares the properties of the analyzed electrode stacks in the following.
Analyzing the EDX results nickel-rich active materials such as NMC-811 (18650#1 and 21700#2) and NCA (20700 and 21700#1 , #3, and #4) are most likely incorporated in the cathode. Single digit wt.-% for the contents of silicon (e.g. 3.5 wt.% for 18650#1) can be estimated in a graphite host-lattice for the anode, which is well in line with supplier information and literature data.63–65 Compared to pure graphite the presence of silicon in a graphite host-lattice increases the electrochemical potential of the composite electrode vs Li/Li+66,67 as well as its gravimetric capacity. The analyzed 26650#1 cell suggests a silicon-free graphite anode and a NMC-532 cathode with moderate contents of nickel. The analysis of SEM images reveals anodic flake-like and cathodic spherical shapes of comparable sizes to the 18650#1 cell. A more detailed summary of the measured electrode stack thickness is shown in the supplementary material together with the detailed analysis of the SEM, EDX and DVA results of the half cells. The capacity balancing  of anode and cathode is calculated from the DVA of full and half cells, which similarly reveal an oversized cathode for all cells—ranging from 10% for the 20700 to 1% for the 21700#3 cell as shown in Table III. As an example, the detailed DVA analysis is shown for cell 21700#2 in the supplementary material. To compensate the capacity mismatch and prevent unwanted side reaction at the anode such as lithium plating,68 a geometrical overhang of the anode is chosen for all cells represented by the areal balancing
  in Table III, which ranges from 36 cm2 to 147 cm2 for the 18650#2 and 26650#2 cell.
To sum up, electrode compositions of graphite anodes without or with low silicon contents and transition metal oxide cathodes with moderate to high nickel contents and comparable electrode thickness for the composite coatings and current collector foils appear. Similar electrode morphologies as particle size and shape can be observed for all high energy type cylindrical cells, which facilitates the use of one representative set of parameters (e.g. the 18650#1 cell) within this work.
Finally, a brief overview of the carried out OCV measurements, DVA, and thermal analysis is shown in Fig. 3. As shown in Fig. 3a, the OCV levels differ between the high energy 18650, 20700, and 21700 and the rather moderately-loaded 26650 cells underlining a different choice of electrode chemistry for the latter. At the beginning of the discharge operation, a plateau appears around 5% depth of discharge (DoD), which is magnified in Fig. 3b and is characteristic for nickel-rich, cathodic host-lattices69 and is absent for the 26650 cells. The higher voltages of the high energy cells from 5% to 60% DoD are caused mainly by the cathode OCP (see supplementary material), whereas the shift afterwards is caused both by lower potential values of the cathode due to the nickel-rich type and higher potentials of the anode because of the content of silicon in graphite. The differential potential  in Fig. 3c underlines the difference between G/NMC-type and SiC/nickel-rich cells. Looking into the anodic peaks in Fig. 3d between 82% and 93% DoD, a significant divergence appears, which results in higher slopes for the silicon-containing cells. Similar observations can be observed in the differential capacity
  vs the cell voltage E in Fig. 3e, where especially the large peak at approximately 4.08 V (see magnification 3f) is also characteristic for nickel-rich cathodes.69 The thermal analysis focusing on the cell's overall temperature coefficient is shown in Fig. 3g and again underlines a significant difference between cells with a moderate and higher energy density between 82% and 93% DoD.
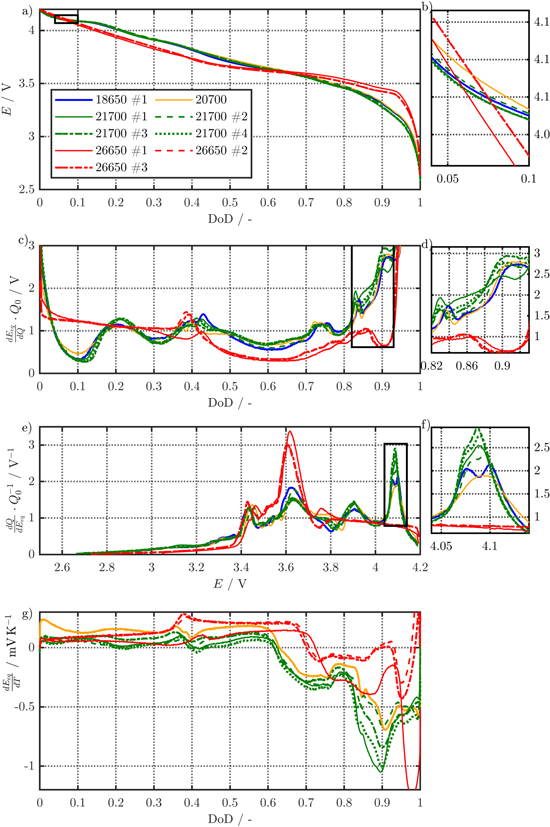
Figure 3. Averaged results from 0.01C-CC charge and discharge OCV measurements at 25 °C for the cell voltage (a), its 1st derivative (c), the differential capacity (e), and the temperature coefficient (g) linearized from measurements at 10 °C, 25 °C, and 40 °C. The magnified subplots (b), (d), and (f) highlight either anode (d) or cathode (b) and (f) specific characteristics.
Download figure:
Standard image High-resolution imageCommercial state-of-the-art high energy LIBs are available in 18650, 20700, and 21700 cylindrical formats, whereas the larger sized 26650 cells can be mostly found in a rather moderately-loaded configuration. This raises the question, if a high energy 26650 type is favourable or if the geometrical configuration causes issues in terms of power, energy, safety, and lifetime performance despite possible savings in manufacturing costs. Silicon-graphite/nickel-rich chemistries can be often found for high energy LIBs. With the aid of simulation studies, the practicability of 26650 formats comprising such a combination of high energy electrode chemistries is examined. As the 18650#1 cell reveals the maximum energy density in the electrode stack among the exemplary studied cells its parametrization31,48 is used in the MuDiMod cases. The results of the simulation based work are presented in the following.
Impact of tab design on in- and through-plane polarization as well as current density distribution
Moderate charging under various ambient temperature conditions
Simulation results of both in- and through-plane polarization during 1C-CC charging whilst applying a convective cooling on all cell surfaces (L+F) at 25 °C is exemplary discussed for both the 1 × 1 and 2 × 3 tab designs of the 18650 format, which are shown in Fig. 4. The remaining 1 × 1*, 1 × 2, and 2 × 2 simulation results lie in between the maximum (1 × 1) and minimum (2 × 3) electrical polarization—in the specified, descending order. The maximum observed temperature in all simulations is well below 60 °C. As the height of the electrode is far smaller than the length of the electrodes, its impact on in-plane polarization is comparably low and almost negligible.
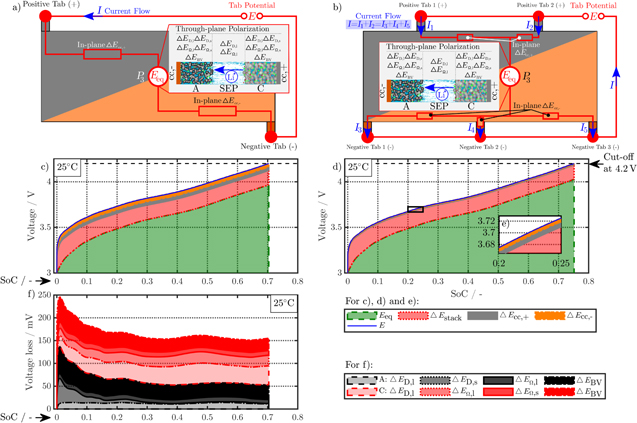
Figure 4. Simulation results at 1C-CC charging (I) from 3 to 4.2 V under L + F cooling at 25 °C for the 18650_1 × 1 and 18650_2 × 3 cell. Subplot (a) and (b) show the schematic composition of the tab potential E composed of in-plane  polarization within both current collectors, through-plane
  polarization in the electrode stack, and the underlying open-circuit potential Eeq composed of anode and cathode equilibrium potential. The related electrical potential and polarization profiles are shown in subplot (c) and (d). As a reference point, position P3 is shown, which carries the lowest current density throughout the charging process. The magnified area in (e) shows the in-plane polarization parts of the 18650_2 × 3 tab design between 20% and 25% SoC. Subplot (f) shows the overall contribution of the dominant through-plane voltage losses at P3 for the 1 × 1 tab design study.
Download figure:
Standard image High-resolution imageFigures 4a and 4b show a schematic composition of the tab potential E at position P3, which incorporates the in-plane polarization  within each current collector, the through-plane polarization
  within anode, separator, and cathode domain, and the voltage source Eeq composed of anode and cathode equilibrium potentials. The simulated tab potential and its composition under the applied charging condition I is shown in Figs. 4c and 4d at the position P3 of the minimum current load for the respective tab design. Evaluating the composition of the tab potential on average regarding the entire charging process, a higher tab potential of 3.849 V appears for the 1 × 1 design compared to the 2 × 3 design as 3.817 V, which consists of 93.6%/95.1% equilibrium potential, 4.4%/4.5% through- and 1%/0.2% in-plane polarization for the 1 × 1/2 × 3 design. The in-plane polarization decreases by a factor of five within both current collectors, when the 2 × 3 design is applied. As the overall polarization for the 2 × 3 design decreases, the contribution of the equilibrium potential slightly increases by 1.5% and +5% SoC at the EoC can be achieved. No significant difference is observed in the through-plane polarization, which is why its composition is shown in Fig. 4f only for the 1 × 1 design. The most relevant parts of the averaged 167 mV on voltage loss compose of 22.7% cathode liquid diffusion limitations
  as well as 21.2% anode and 19% cathode reaction kinetics
  . The higher ohmic losses within the electrolyte
  for the cathode (12.8%) compared to the anode (5.8%) are most likely caused by the lower cathode porosity (
 ), which results also in lower liquid diffusion overvoltage within the anode (7.6%). Due to the three orders of magnitude lower solid electrical conductivity70 in the nickel-rich host-lattice, the solid ohmic polarization
  accounts for 6.4%, whereas the corresponding voltage loss in the anode is almost negligible. The solid diffusion coefficient in the cathode's active material particles is about one order of magnitude higher than in the anode70–72 (see Table VIII) and together with nearly half the size of the anode's particles (Rp,D50: 6.1 μm vs 3.8 μm), the solid diffusion overvoltage
  of 4.4% in the cathode is almost negligible compared to the anode. The voltage loss through the separator
  and
and  revealed a negligible impact.
Similar simulation studies are carried out at 10 °C and 40 °C ambient temperature to examine the impact of temperature. Referring to P3, a decrease of 2% in the mean cell voltage can be observed for a temperature rise from 10 °C to 40 °C for both tab designs. The share of the equilibrium potential reveals a marginal increase of around 1% (18650_1 × 1) and 2% (18560_2 × 3), whereas the through-plane polarization decreased nearly by a factor of two in both cases. The through-plane polarization composition in the anode decreases around 35% ( ), 37% (
 ), 45% (
 ), and 55% (
 ). Similar decreases appear within the cathode. This observation is fundamentally based on overall enhanced ionic transport properties within both solid and liquid components as well as an increased reactivity within both electrodes with rising temperatures. In contrast, the in-plane polarization rises about 14% and 11% for the positive and negative current collector, which is well in line with the negative temperature coefficient in the electrical conductivity of copper and aluminum.
Neglecting the local evaluation at P3 and proceed to a more global analysis, the maximum polarizations across the active area for the yet discussed results are averaged over the charging time. The results are shown in Table IV including the mean deviation to indicate their variance in time. The transient profiles are shown in the supplementary material. The total polarization  of the 2 × 3 design reveals a slightly higher decrease caused by temperature of 12% from 10 °C to 40 °C compared to the 1 × 1 design, where the through-plane polarization prevails over the in-plane polarization in both cases. For both designs, the through-plane polarization significantly decreases with elevating temperatures, whilst the in-plane polarization increases. Looking into the difference between the 1 × 1 and 2 × 3 tab design in Table IV, can be reduced by 22.1% and 36.5% at 10 °C and 40 °C respectively by choosing a 2 × 3 tab design instead of a 1 × 1 tab design. This is mainly caused by a reduced in-plane polarization of 80.3% to 85% for the positive and negative electrode of the 2 × 3 tab design based on a reduced effective electrode length. The through-plane polarization is marginally reduced by the choice of tab design by 2.3% to 3% from 10 °C to 40 °C. The in-plane polarization is dominated by the tab design and has a significant impact on the mean tab potential and the related charging efficiency. The through-plane polarization is less sensitive to the tab design, but can nearly double with falling temperatures due to being severely affected by temperature-dependent electrode kinetics and the mass transport in the electrolyte. Overall, the maximum, total polarization can be reduced at least by 22% and at most by 36% from 10 °C to 40 °C at 1C-CC charging, when a 2 × 3 tab design is used instead of a 1 × 1 design. The general correlation between the tab designs of the 18650 format may most likely be transferable to 21700 and 26650, as the effective lengths increase due to the longer/higher electrodes, but the relative proportion between the tabs remain the same. Consequently, increased in- and through-plane polarizations are expected. The difference in the thermal behavior between the three formats becomes more significant at higher C-rates beyond 1C and non-ideal cooling conditions such as the 25% LAC case, which is both discussed in the multi-step charging section of this work.
Table IV. Maximum time-averaged polarization results of the 18650_1 × 1 and the 18650_2 × 3 simulated total cell polarization at 1C-CC and L + F cooling for 10 °C, 25 °C, and 40 °C.
| Total | Through-plane | In-plane | ||
|---|---|---|---|---|
| Symbol |

|

|

|

|
| Unit | mV | % | % | % |
| 18650_1 × 1 | ||||
| 10 °C | 343 ± 26.7a) | 75.2 ± 7.3 | 12.9 ± 0.3 | 11.9 ± 0.3 |
| 25 °C | 266 ± 25.7 | 66.3 ± 9.0 | 17.7 ± 0.4 | 16.1 ± 0.3 |
| 40 °C | 226 ± 20.9 | 57.9 ± 8.4 | 22.2 ± 0.4 | 19.9 ± 0.4 |
| 18650_2 × 3 | ||||
| 10 °C | 267 ± 23.4 | 94.5 ± 8.7 | 3.3 ± 0.1 | 2.3 ± 0.0 |
| 25 °C | 188 ± 21.6 | 91.7 ± 11.3 | 4.9 ± 0.1 | 3.4 ± 0.1 |
| 40 °C | 143 ± 16.9 | 88.4 ± 11.6 | 6.9 ± 0.1 | 4.7 ± 0.1 |
| Relative decrease from 10 °C to 40 °C/% | ||||
| 18650_1 × 1 | −34 | −49 | +14 | +11 |
| 18650_2 × 3 | −46 | −50 | +13 | +11 |
| Relative decrease from 18650_1 × 1 to 18650_2 × 3/% | ||||
| 10 °C | −22.1 | −2.3 |

|

|
| 25 °C | −29.4 | −2.4 | −80.3b) | −85b) |
| 40 °C | −36.5 | −3.0 |

|

|
a)Mean deviation. b)Negligible impact of the temperature between the 10 °C, 25 °C, and 40 °C case.
Fast charging and variance of local polarization
Not only an overall increased polarization but also a more inhomogeneous distribution across the active electrode area can be expected at higher C-rates such as 3C-CC charging, which is presented in the following for the 18650_1 × 1 and 18650_2 × 3 studies at 25 °C and L + F cooling. For some cases, a local overheating beyond 60 °C can be observed for 3C-CC charging due to insufficient cooling, which is addressed in the last two sections of this work. The simulation results of the maximum-polarizing tab design—the 1 × 1 design—are shown in Fig. 5, which shows a schematic overview of the composition of tab potential at the appearing minimum of current load at P3, as well as close to the maximum current load near the positive tab at P1 and the negative tab at P2. The composition of the tab potential mainly differs in the contribution of in-plane polarization effects along current collectors. Near the positive tab at P1, 3.3% of the total polarization are based on the negative current collector, whilst only 0.8% arise from the positive current collector. Near the negative tab at P2 this contribution is almost inverted with the positive current collector dominating the negative current collector. At P3, a rather balanced contribution of 3% and 2.8% appears for the negative and positive current collector respectively. Considering all three positions, the contributions of equilibrium potential (84.9%, 84.8%, and 84.3%) and through-plane polarization (11%, 10.9%, and 10%) slightly differ, which reveals an increased utilization. This is caused by the higher current density leading to faster lithiation/delithiation and hence increased in- and through-plane polarization effects near the current collector tabs. Regarding Figs. 5g to 5i, no significant difference in the composition of the through-plane polarization appears, but overall the total polarization rises in the vicinity of the current collector tabs. For example, 435 mV and 429 mV of total, time-averaged polarization appear at P1 and P2, compared to 393 mV at P3. Similar trends appear for the 18650_2 × 3 design, only at lower polarizations around 385 mV, 387 mV, and 379 mV at the 1st positive tab, the 2nd negative tab, and at the minimum in current load at P3. In general, the mean tab potential of the 1 × 1 design accounts to 4.038 V and exceeds the 2 × 3 design by 2%, which results in reduced utilization of −23% SoC.
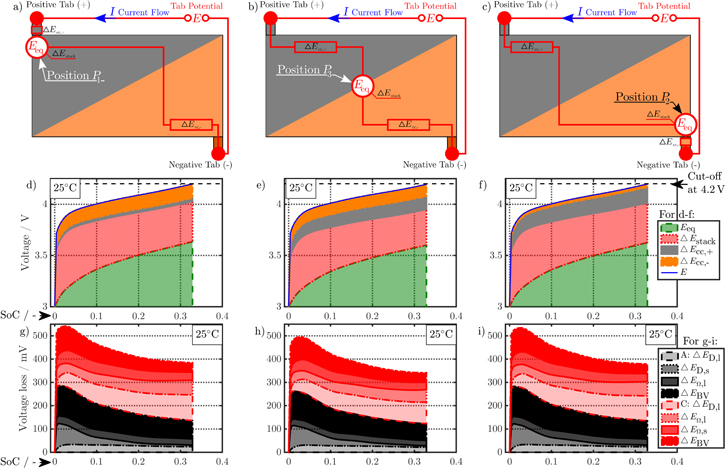
Figure 5. Simulation results at 3C-CC charging (I) from 3 to 4.2 V applying L + F cooling at 25 °C for the 18650_1 × 1 design. Subplot (a) to (c) show the schematic composition of the tab potential E at three different positions: P1 near the positive tab (a), (d), (g), P2 near the negative tab (c), (f), (i), and P3 in the center of the active area (b), (e), (h). The composition of the tab potential is shown in subplot (d) to (f), which is composed of both in-plane  and through-plane
  voltage losses as well as underlying open-circuit potentials Eeq of anode and cathode. The subplots (g) to (i) show the dominating through-plane polarization effects resulting in the overall through-plane voltage loss.
Download figure:
Standard image High-resolution imageFor both studies, the increase from 1C to 3C evokes an increase of the mean tab potential of ≈5%, where the through-plane polarization increases by a factor of more than two and the in-plane polarizations by a factor of three. The composition of the through-plane polarization for the 1 × 1 design revealed a general increase by at least a factor of two, whereas especially the anode solid diffusion  and the cathode solid ohmic overvoltage
  increase by a factor of four. As a result, initial onsets of partial rate limitations in the form of anode particle diffusion and cathode electron transport are indicated. Similar trends can be observed for the 2 × 3 design.
A general comparison summarizing the C-rate effect on the 1 × 1 and 2 × 3 tab design is shown in Table V. The maximum total polarizations averaged over time at 3C-CC charge account to 723 mV and 446 mV are caused to nearly 40% by the in-plane polarization for the 1 × 1 study, whereas only 11% appear for the 2 × 3 study. From 1C to 3C, a similar increase by a factor of 2.7 (18650_1 × 1) and 2.4 (18650_2 × 3) in total appear. Again, an overall lower polarization by 29.4% and 38.3% appear at 1 and 3C for the 2 × 3 tab design. This translates to 2.4%/11.1% lower through-plane, and at least 80.3%/79.7% lower in-plane polarizations at 1C/3C. Regarding the remaining tab design studies for the 18650 format, the polarizations lie in between the two presented cases in the same order as discussed in the section before. The local variance of the through-plane polarization is about five times lower for the 18560_2 × 3 compared to the 18650_1 × 1 study. Around 40% of the total polarization are caused by the ohmic losses along the current collectors at 3C-CC charging for the 1 × 1 study, which lowers by a factor of four in case of the 2 × 3 study. At a maximum, a 38.3% lower polarization can be achieved at 3C using the 2 × 3 tab design which translates to a higher utilization/charge efficiency of +23% SoC at EoC. Again, a transfer of the results to the 21700 and 26650 formats is suitable under the constraint that the increased heat generation due to the higher C-rate may have a more significant impact on the long-term thermal behavior, which is addressed in the last two sections.
Table V. Maximum time-averaged polarization results of the 18650_1 × 1 and the 18650_2 × 3 simulated total cell polarization under 1C-CC and 3C-CC charging at 25 °C and L + F cooling.
| Total | Through-plane | In-plane | ||
|---|---|---|---|---|
| Symbol |

|

|

|

|
| Unit | mV | % | % | % |
| 18650_1 × 1 | ||||
| 1C-CC | 266 ± 25.7a) | 66.3 ± 9.0 | 17.7 ± 0.4 | 16.1 ± 0.3 |
| 3C-CC | 723 ± 105.3 | 61.6 ± 10.1 | 20.2 ± 2.4 | 18.2 ± 2.1 |
| 18650_2 × 3 | ||||
| 1C-CC | 188 ± 21.6 | 91.7 ± 11.3 | 4.9 ± 0.1 | 3.4 ± 0.1 |
| 3C-CC | 446 ± 64.6 | 88.9 ± 13.5 | 6.6 ± 0.6 | 4.5 ± 0.4 |
| Relative factor of increase from 1C- to 3C-CC/− | ||||
| 18650_1 × 1 | 2.7 | 2.5 | 3.1 | 3.1 |
| 18650_2 × 3 | 2.4 | 2.3 | 3.2 | 3.1 |
| Relative decrease from 18650_1 × 1 to 18650_2 × 3/% | ||||
| 1C-CC | −29.4 | −2.4 | −80.3 | −85.0 |
| 3C-CC | −38.3 | −11.1 | −79.7 | −84.7 |
Local and time-dependent variance of the current load
The ohmic drop across the current collector foils has a major impact21 on the distribution of the current density across the active area. In this matter, it can be distinguished between an instantaneous and a long-term distribution, which refers to the initial state or to the entire charging process. The initial distribution is dominated by the current collector design such as its geometrical dimensions and the tab design. The temperature rise, possible restraints or enhancements of mass transports and alteration of electrode kinetics such as OCP shifts due to the ongoing lithiation/delithiation21 are crucial on the long-term.
The instantaneous potential drop across the current collector foils is correlated to a local variation of the through-plane potential drop ( at P(x', y')) and defines the local distribution of the current density ip2D across the active area. The instantaneous equilibrium potential level is approximately identical for all analyzed cases, which allows the correlation of the through-plane potential difference (
 ) to the current density. At 1C-CC charging under L + F cooling and 25 °C, the instantaneous tab potential E calculates to 3.264 V in the 18650_1 × 1 study, which is correlated to a 52 mV, 55 mV, and 74 mV lower potential difference at the positions P1, P2, and P3. The local current density appears to be 5.23 mA cm−2, 5.13 mA cm−2, and 4.56 mA cm−2, which reveals a variation of +11%, +9%, and −3% compared to the areal-averaged current density of 4.69 mA cm−2. With rising temperatures from 10 °C to 40 °C, the spread between the maximum and minimum of the current density increases from 10.4% to 15.1%, which is mainly caused by an increased ohmic resistance within the current collectors albeit enhanced electrode kinetics and mass transport properties. With increasing C-rate from 1C to 3C, an increase in the spread between minimum and maximum current density from 8.5% to 11.5% appears due to the evoked higher in-plane ohmic losses, which directly scale with the applied current. Lower in-plane ohmic losses in the 18650_2 × 3 design appear with lower through-plane potential differences of 12 mV and 11 mV near the tabs accompanied with a lower mean tab potential E of 3.209 V and lead to a significantly lower spread in the current density of 2.1% compared to 14% for the 18650_1 × 1 design at 1C-CC charging and 25 °C.
On the long-term, the mean variation in current density appears to be 3.1% between the three positions during a 1C-CC charge for the 18650_1 × 1 study, which indicates a balancing effect across the active area with ongoing charging operation compared to the initial 14% offset. Increasing the ambient temperature from 10 °C to 40 °C causes decreasing mean tab potential E from 3.885 to 3.821 V, which comes with an overall reduction of −1% for the spread in current density. Similarly to other works,21 higher peaks and amplified local fluctuations of the current density appear at 40 °C compared to 10 °C, but result in a lower, mean current load across the active area. Regarding the C-rate increase, the spread increases from 3.1% at 1C to 11.4% at 3C.
In sum, higher C-rates, longer effective electrode lengths, and higher temperatures increase the instantaneous and long-term spread of the current density, which generally evokes amplified fluctuations across the active area. The instantaneous results are most likely transferable to the 21700 and 26650 formats, where especially long-term, thermal effects are negligible. The higher effective electrode lengths most likely cause an increased spread between the maximum and minimum local current density for the 18650 designs.
Rate capability and local onset of unwanted side reactions during fast charging
In the following, the charging rate capability from 3 V to 4.2 V is simulated at 1C- to 4C-CC for the 18650, 21700, and 26650 format including each tab design (see Table II). The L + F cooling condition at 25 °C partly revealed insufficient cooling leading to local overheating especially at 4C for 1 × 1 tab designs. Nevertheless, the results are summarized in Fig. 6 to better illustrate the rate-limiting phenomenon coming with a non-linear drop of the charged SoC at higher C-rates coming with a higher probability of lithium plating.

Figure 6. Charging simulation results from 1C to 4C-CC from 3 V to 4.2 V and 25 °C including L + F cooling. The results of the 18650 (a) and (d), 21700 (b) and (e), and 26650 (c) and (f) formats are shown with five different tab designs (1 × 1, 1 × 1*, 1 × 2, 2 × 2, and 2 × 3). The subplots (a) to (c) show the gained SoC at EoC (4.2 V) vs the applied C-rate. The subplots (d) to (f) show the charged volumetric energy density at EoC vs the cumulative plating hazard (see Eq. 1) based on the anode potential across the active area. The lower the value, the higher the likeliness of lithium plating becomes.
Download figure:
Standard image High-resolution imageAs shown in Figs. 6a to 6c, the larger the cell, the lower the critical C-rate becomes, after which a significant, non-linear drop in SoC can be observed. A significant impact of the tab design on the charging efficiency appears, as the larger the effective electrode lengths, the higher the in-plane polarization becomes and the faster the tab potential increases. This leads to an early approach of the upper cutoff voltage which translates into the shown decreasing SoC trend with increasing C-rate. Consequently, the 1 × 1 tab design reveals the poorest and the 2 × 3 tab design the best charging performance independent of the cell's format. In comparison, the 21700 format has a slight benefit regarding the volumetric energy density compared to the 18650 format, whereas the 26650 format shows the lowest performance. Using more tabs for the 21700 and 26650 format would enhance their performance, but this work focusses on application-near tab designs derived from the studied cylindrical cells, which would most likely be viable for the manufacturing process. Figures 6d to 6f show the likeliness of lithium plating derived from the simulated anode potential across the active area (see Eq. 1). The shorter the effective electrode length is, the higher the risk for lithium plating becomes before the upper cutoff voltage is reached. The aforementioned trend can be clearly seen for the 18650 studies (see Fig. 6d) ranging from a value of −1 mVs for 18650_1 × 1 to −520 mVs for 18650_2 × 3 at 3C-CC charging. Evaluating the earliest onset of negative anode potentials across the active area, the corresponding, with possible lithium plating affected SoC range calculates to 11.3% for 18650_1 × 1 and 40% for 18650_2 × 3 of the charged SoC. The enhanced charging performance of cell designs including multiple tabs comes with a higher risk of lithium plating throughout the charging process especially at higher C-rates. For the 1 × 1 design, the upper cutoff voltage is reached before lithium plating can occur almost independent from the applied C-rate. This is based on a lower SoC at EoC coming with lower degrees of lithiation within the anode and a higher temperature due to charging losses reducing reaction overpotentials at the anode/separator interface. Both of these effects reduce the likeliness of lithium plating—but also come with a comparably low fast-charging capability including a high demand for cooling performance. This implies that by improving the tab design, fast charging is not primarily limited any more by how quickly the EoC voltage is reached due to voltage losses or if and when the maximum tolerable temperature is exceeded—but by how quickly a lithium plating criterion is violated. In order to avoid lithium plating for multi-tab cells even at higher SoC levels, a multi-step charging profile with reducing the C-rate at higher SoCs can be applied.
With increasing C-rate, the through-plane polarization and the current density increase, which leads to instantaneous and long-term decreasing anode potential and thus the indicated values in Fig. 6d increase up to −5 Vs in case of the 18650_2 × 3 design. The same findings hold for the 21700 and 26650 studies, where the anode potential increase due to the longer effective electrode lengths and additionally, the delayed heat conduction through the jelly roll increases the mean temperature in the cell. Consequently, the onset shifts to higher C-rates (4C) and multiple-tab designs such as 1 × 2 (21700) and 2 × 2 (26650).
In sum, lower in-plane ohmic losses evoked by shorter effective electrode lengths reduce the overall polarization, which lead to lower mean tab potentials and higher SoC levels, but also to a higher likeliness of lithium plating due to the absence of long-term in-plane heating effects and a prolonged charging process. To avoid overheatings and lithium plating on the long-term multi-step current profiles together can be applied in accordance to the tab design,31 the format, and the cooling condition, which is discussed in the last section.
Focussing further on the locality of negative anode potentials across the active area, the first indication of lithium plating can be observed for the 18650_1 × 1*, 21700_1 × 2, and 26650_2 × 2 designs at 3C-CC charging as shown Fig. 7. At the positions P1, P2, and P3, the anode potential vs the SoC (a, c, and e) is shown together with the time-integrated distribution of negative anode potentials across the active area (b, d, and f). The anode potential falls below 0 V first at either the negative (26650_2 × 2), the positive (21700_1 × 2), or both current collector tabs (18650_1 × 1*). This is caused by the higher current density and the accompanied accelerated lithiation of the anode, which leads to an early drop of the anode equilibrium potential compared to the areas far from the current collectors (see P3). Interestingly, the 26650_2 × 2 design reveals no indication at the positive tabs, despite a clear indication at the negative tabs. For the 26650_2 × 2 design, the effective cathode length is 33% shorter than the anode, which leads to higher current density and accelerated lithiation near the anode's tabs (see magnifications in Fig. 7f) compared to the cathode's tabs. On the contrary, the 21700_1 × 2 design shows an early onset (see magnification in Fig. 7d) near the positive tab due to the single-tab design compared to double-tab design at the negative collector. For the 18650_1 × 1* study, the rather balanced effective electrode lengths lead to similar indications at both collector tabs.
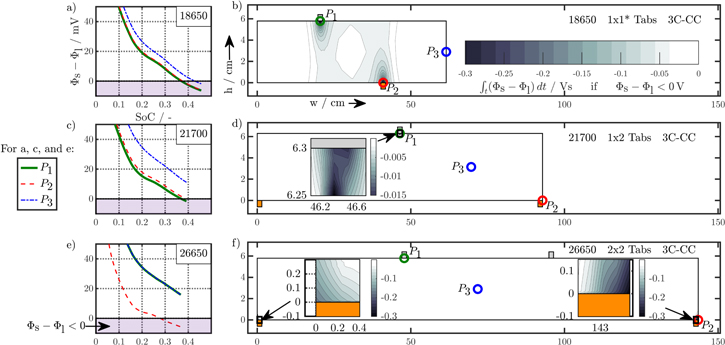
Figure 7. Simulation results for the 18650_1 × 1*, 21700_1 × 2, and 26650_2 × 2 design at 3C-CC charging under L + F cooling and 25 °C. The subplot (a), (c), and (e) show the anode potential at the positions P1, P2, and P3 across the active area. The subplots (b), (d), and (f) show the time-integrated anode potential as an indicator of how long and to which extent the anode is exposed to potential levels, which most likely enhance a lithium plating side reaction. The magnified areas in subplot d and f show the resulting indication near the positive (d, 21700_1 × 2) and the negative (f, 26650_2 × 2) current collector tab(s).
Download figure:
Standard image High-resolution imageThe effective electrode lengths at both current collectors majorly affect the current density distribution over the active area and hence the local rate of the anode potential decrease. In general, the longer the effective electrode lengths at each positive or negative current collector becomes, the higher the likeliness for lithium plating appears close to the positive and/or negative tabs.
Impact of active and localized cooling on the battery's charging performance
The L + F cooling case resulted in partial, local overheating beyond 60 °C at higher C-rates than 3C. Especially for the 1 × 1 designs this appears in all studied cell formats due to the increased in-plane ohmic losses. Besides, the chosen cooling at both front and lateral surface is not suitable for application in any scenario like EVs.62 The 25% LAC active cooling case addresses the aforementioned issues and is discussed in the following.
At a maximum 3C-CC could be applied to the temperature limit of 60 °C until reaching 4.2 V in case of the 18650 formats. The maximum uncritical C-rate is 2C for the 21700 and 26650 formats. Chosen temperature distributions across the active area are shown in the supplementary material. Again, the 1 × 1 design revealed overheating in all three formats. For the remaining tab designs, the localized, active cooling increases the temperature inhomogeneity by nearly a factor of two compared to L + F cooling. At most a spread of 9 K, 8 K, and more than 10 K appear between the maximum and minimum temperature at EoC for the 18650, 21700, and 26650 format. Despite the thermal aspect, the anode potentials close to 0 V at EOC. The effect of local cooling spots on triggering lithium plating is discussed in the next section with the results of the 2 × 3 design in the 18650 format.
To keep the LIBs in a safe operating range, unwanted side reactions and overheating must be avoided. By using a multi-step current profile, these charging restrictions can be maintained whilst the charging efficiency can be improved compared to the aforementioned CC profile for each cell format and tab design. The simulation results of the profile presented in the last section initiates at 3C-CC charge and shifts to 2C-CC, when either negative anode potentials across the active area occur or critical temperatures beyond 60 °C throughout the jelly roll appear. Optionally, a second current step can be necessary due to the aforementioned restrictions and then a second step to 1C-CC until EoC is applied.
Cooling spot induced onset of unwanted side reactions
Localized active cooling revealed local onset of lithium plating, which is discussed for the 18650_2 × 3 study under 3C-CC charging and 25% LAC. Figure 8a shows the local temperature profiles vs the SoC at positions P1 to P4 as marked in Fig. 8b, which illustrates the temperature distribution across the active area at EoC. An obvious influence of the cooling spot appears on the temperature distribution as shown in Fig. 8b, where the minima of approximately 55 °C appear close to the cooling spot and repeat per each winding along the jelly roll from the outer surface at P4 to the core as a consequence of the heat accumulation—resulting in the maxima at approximately 60 °C. The minimum in temperature, anode potential, and the current density appears just in the cooling spot at P4. The instantaneous and charging time averaged current density spread between the four points appears to be 3.35% and 3.91%, where the minimum current appears near the cooled surface in the cold spot around P4. Approximately at 25% SoC, the cooling effect at P4 noticeably increases the total through-plane polarization compared to the remaining positions. Until EoC, the long-term effect of the cooling spot prevents an overly heating-caused polarization decrease. This results in the maximum 366 mV of through-plane polarization during charging compared to the remaining positions with 361 mV, 364 mV, and 358 mV at P1, P2, and P3. In particular, the increased polarization around the cooling spot can be majorly referred to the higher anodic and cathodic reaction polarization  . Together with the ongoing anode equilibrium decrease the increased through-plane polarization leads to the observed early negative anode potentials. Figure 8e shows the affected area. The closer to the negative tab, the higher the likeliness of lithium plating becomes, which correlates to an increased current density closer to the tabs and the accompanied faster lithiation of the anode.
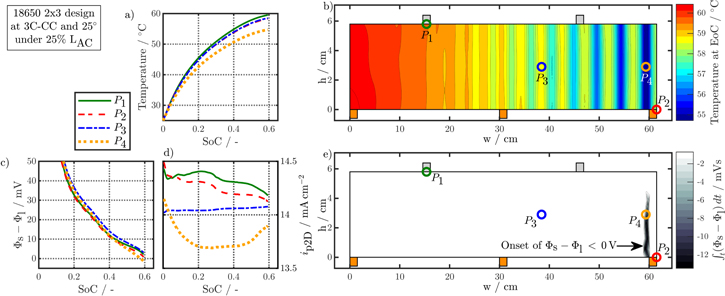
Figure 8. Simulation results of the 18650_2 × 3 design at 3C-CC charging from 3 V to 4.2 V at 25 °C and 25% LAC cooling. Subplot (a) and (b) show the temperature at the local positions P1 to P4 over the charged SoC (a) and the areal distribution across the active area at the EoC (b). The anode potential (c) and the current density (ip2D, d) are shown at P1 to P4 together with the time-integrated areal evaluation of the likeliness of lithium plating (e).
Download figure:
Standard image High-resolution imageIn addition to the prolonged charging and lower in-plane heat generation the local cooling effect further increases the likeliness of lithium plating for the 18650_2 × 3 design. Only the 18650_2 × 3 study revealed this effect, as the remaining tab designs and formats are less affected due to the longer effective electrode lengths and/or the higher mean temperatures resulting from the larger formats.
Multi-step fast charging procedure
Table VI summarizes all simulated multi-step charging simulations under 25% LAC and 25 °C. Regarding the increased in-plane polarization and the resulting in-plane heat generation of the 1 × 1 tab designs, only the 18650 format could be applied with a prolonged, initial 3C-CC phase, as the appearing overheating due to the delayed radial heat conduction for the 21700 and 26650 formats could not sufficiently be cooled in the following current phases. Therefore, a 2C- to 1C-CC profile is applied in the 21700_1 × 1 and 26650_1 × 1 study. Similarly early EoC is avoided for the remaining 21700 and 26650 studies via limiting the first 3C-CC period to 90 s and 60 s, which is derived from preliminary simulations.
Table VI. Overview of the multi-step current charging under 25% LAC cooling at 25 °C whilst avoiding lithium plating.
| Identifier | Time | Energy |

|
SoC |
 SoCc SoCc |

|

|
| Unit | /s | /Whl−1 | Whl−1 min−1 | / % | /K | /° C | |
| 18650 | |||||||
| 1 × 13C→2C | 943 | 547 | 34.8 | 57.4 | 7.4 | 14.7 | 60 |
| 1 × 1*3C→2C | 895 | 610 | 40.9 | 63.8 | 3.6 | 7.3 | 60 |
| 1 × 23C→2C | 940 | 615 | 39.2 | 64.7 | 3.3 | 8.5 | 60 |
| 2 × 23C→2C | 960 | 631 | 39.4 | 66.7 | 3.6 | 8.8 | 60 |
| 2 × 33C→2C | 934 | 646 | 41.5 | 68.1 | 2.8 | 7.6 | 58.8 |
| 21700 | |||||||
| 1 × 12C→1C | 2035 | 675 | 19.9 | 65.2 | 8.1 | 17.4 | 60 |
| 1 × 1*3C→2C | 986 | 597 | 36.3 | 57.2 | 6.1 | 7.4 | 54.6 |
| 1 × 23C→2C | 1040 | 625 | 36.1 | 60.1 | 5 | 9.2 | 56.1 |
| 2 × 23C→2C | 1110 | 662 | 35.8 | 64.1 | 5.1 | 8.8 | 54 |
| 2 × 33C→2C | 1145 | 679 | 35.6 | 66 | 3.1 | 6.7 | 50.6 |
| 26650 | |||||||
| 1 × 12C→1C | 1860 | 546 | 17.6 | 52.4 | 14.4 | 24.3 | 56.6 |
| 1 × 1*3C→2C→1C | 1820 | 708 | 23.4 | 67.3 | 9.9 | 12 | 60 |
| 1 × 23C→2C→1C | 1915 | 726 | 22.7 | 69.6 | 6.8 | 13.2 | 60 |
| 2 × 23C→2C→1C | 1859 | 753 | 24.3 | 72.6 | 8.7 | 13 | 60 |
| 2 × 33C→2C | 1135 | 667 | 35.3 | 64.6 | 4.3 | 10 | 56.8 |
| Prospective cylindrical formats | |||||||
| 22800_1 × 1*3C→2C | 992 | 600 | 36.3 | 57.5 | 6 | 10.9 | 58.3 |
| 22800_1 × 23C→2C | 924 | 564 | 36.6 | 53.7 | 7.5 | 8.1 | 56.1 |
| 23700_1 × 23C→2C→1C | 1560 | 763 | 29.3 | 72.7 | 6.2 | 11.3 | 60 |
| 23700_2 × 23C→2C | 1085 | 649 | 35.9 | 62.6 | 6.7 | 11.3 | 58.7 |
c Variance in SoC across the active area within the cathode domain.
2C→1C 2-step current profile from 2C- to 1C-CC.
3C→2C 2-step current profile from 3C- to 2C-CC.
3C→2C→1C 3-step current profile with initial 3C-, subsequent 2C-, and final 1C-CC phase.
In extension to Table VI, Fig. 9 illustrates the results for each simulated configuration of format and tab design. Regarding the 26650 formats, the fast charging capability increases if more tabs are used and the imbalance of SoC and temeperature can be significantly reduced. As expected, the bigger the cell diameter, the lower the fast charging capability and the higher the imbalance of SoC and temperature. In case of the 18650 formats the 2 × 3 tab design reveals the best energy per time ratio of 41.5 Whl−1 min−1 and the maximum SoC of 67.1% and the minimum spread in SoC of 2.8%. The poorest performance appears for the 18650_1 × 1 design with 34.8 Whl−1 min−1 accompanied with the lowest SoC of 57.4%, the maximum spread in SoC of 7.4%, and temperature spread around 14.7 K. Similarly, 60 °C appear as a maximum at the transition from 3C to 2C except for the 2 × 3 design, as negative anode potentials (see Fig. 8) appear before reaching the upper temperature limit.
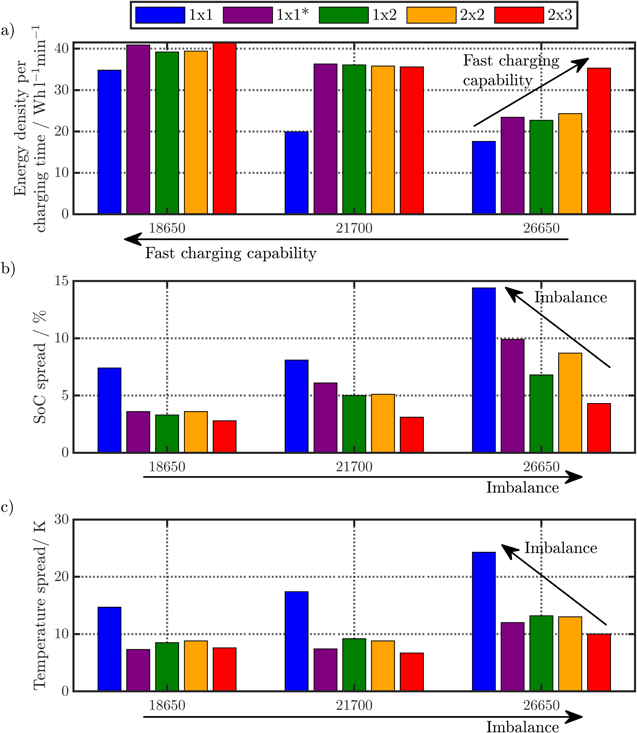
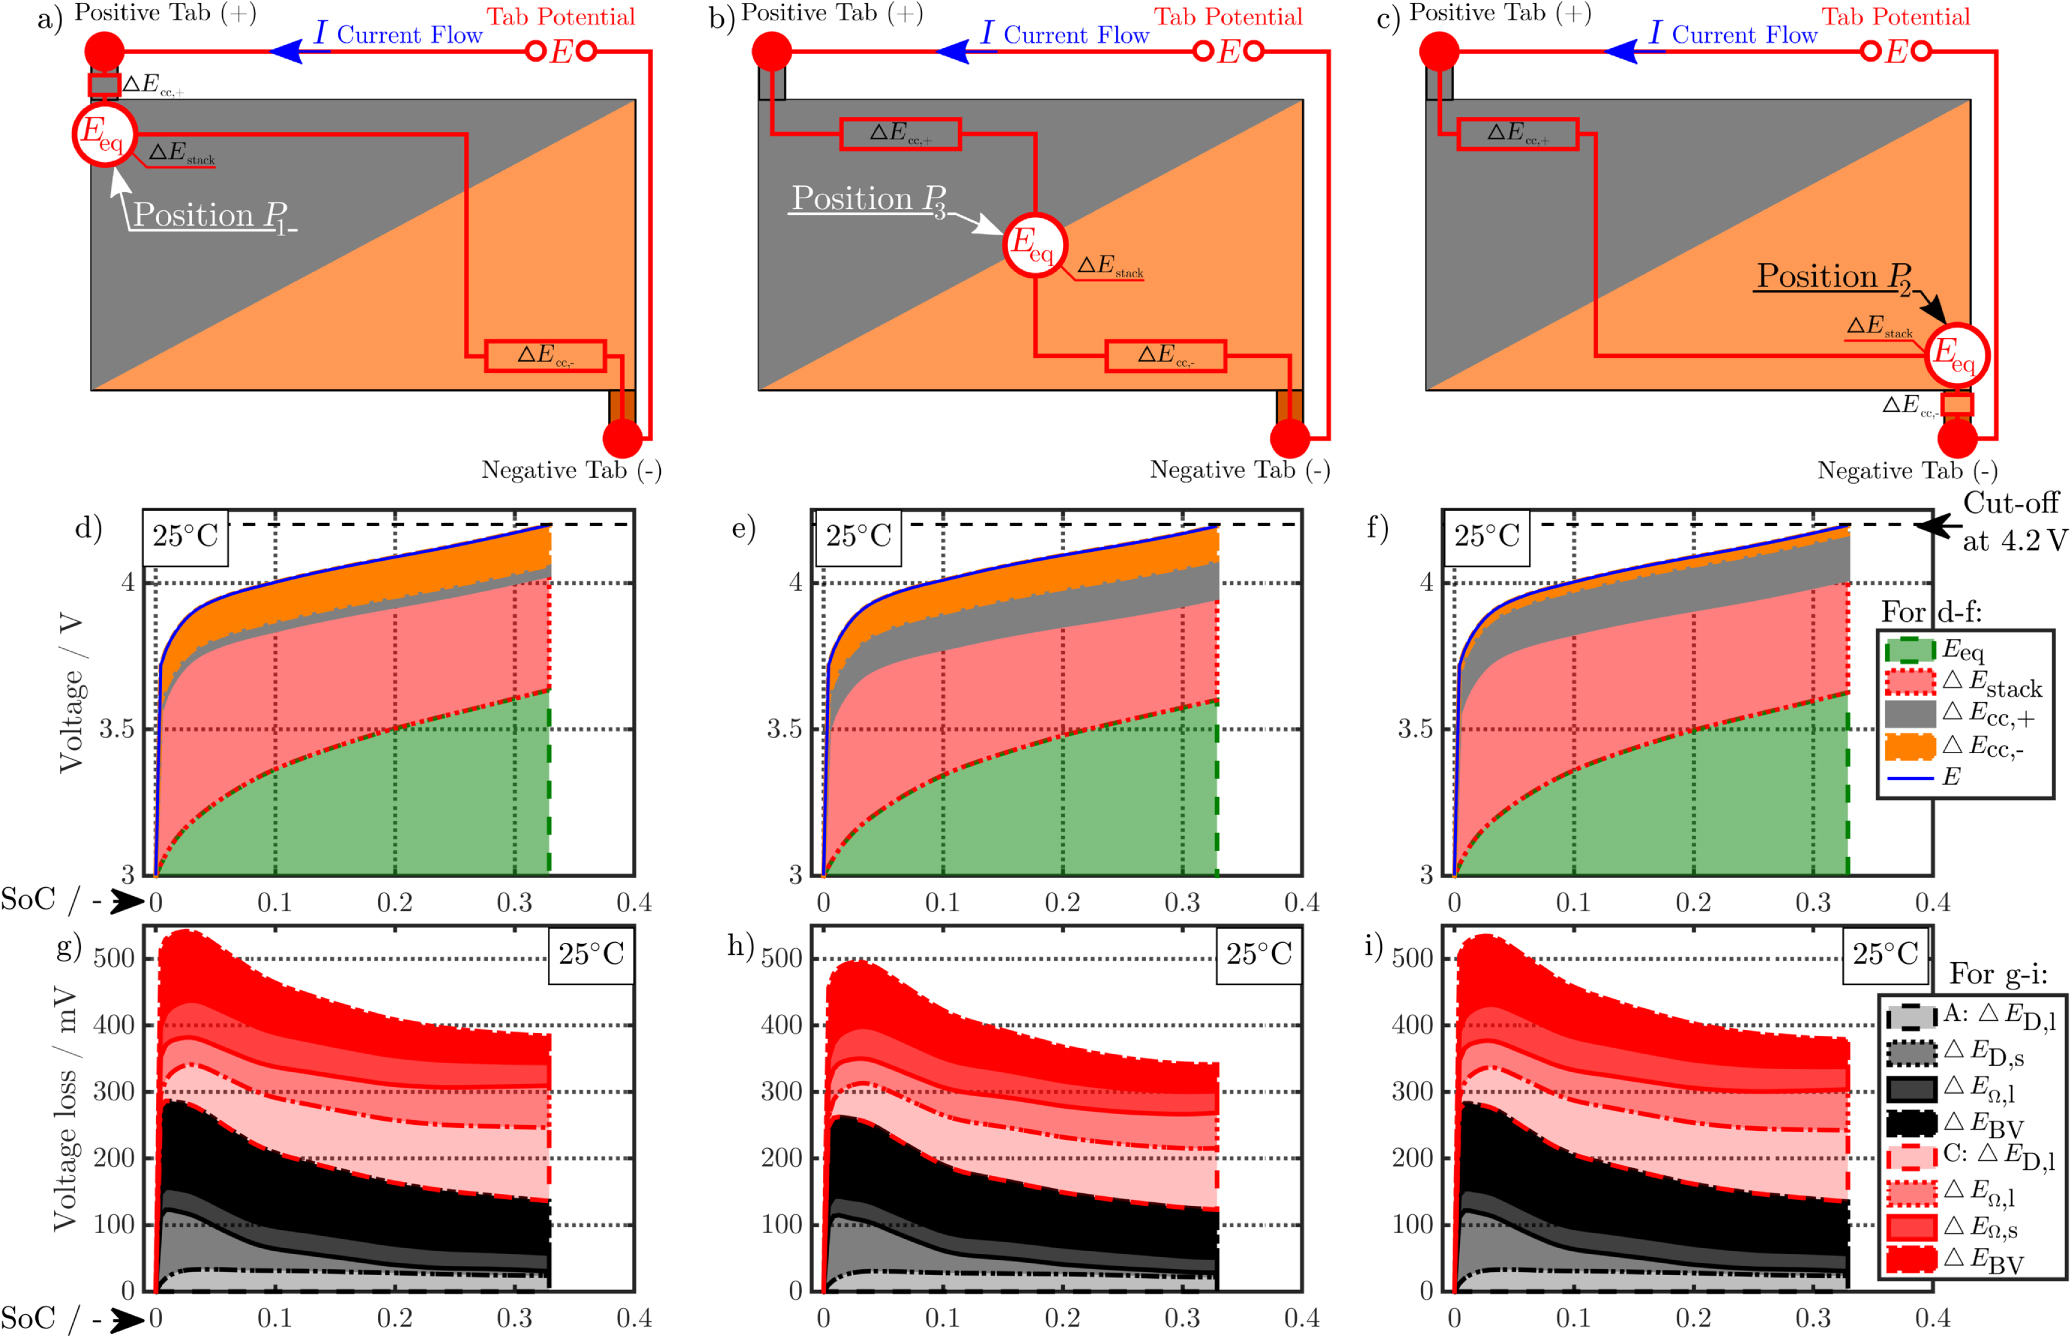
Figure 9. Simulation results of the multi-step fast charging procedure from 3 V to 4.2 V at 25 °C and 25% LAC cooling. Subplot (a) shows the energy density per charging time to evaluate the fast charging capability of all simulated 18650, 21700, and 26650 configurations with the five different tab designs. Subplot (b) and (c) illustrate the corresponding spreads in SoC and temperature, which are used to evaluate the imbalance for each configuration of format and tab design.
Download figure:
Standard image High-resolution image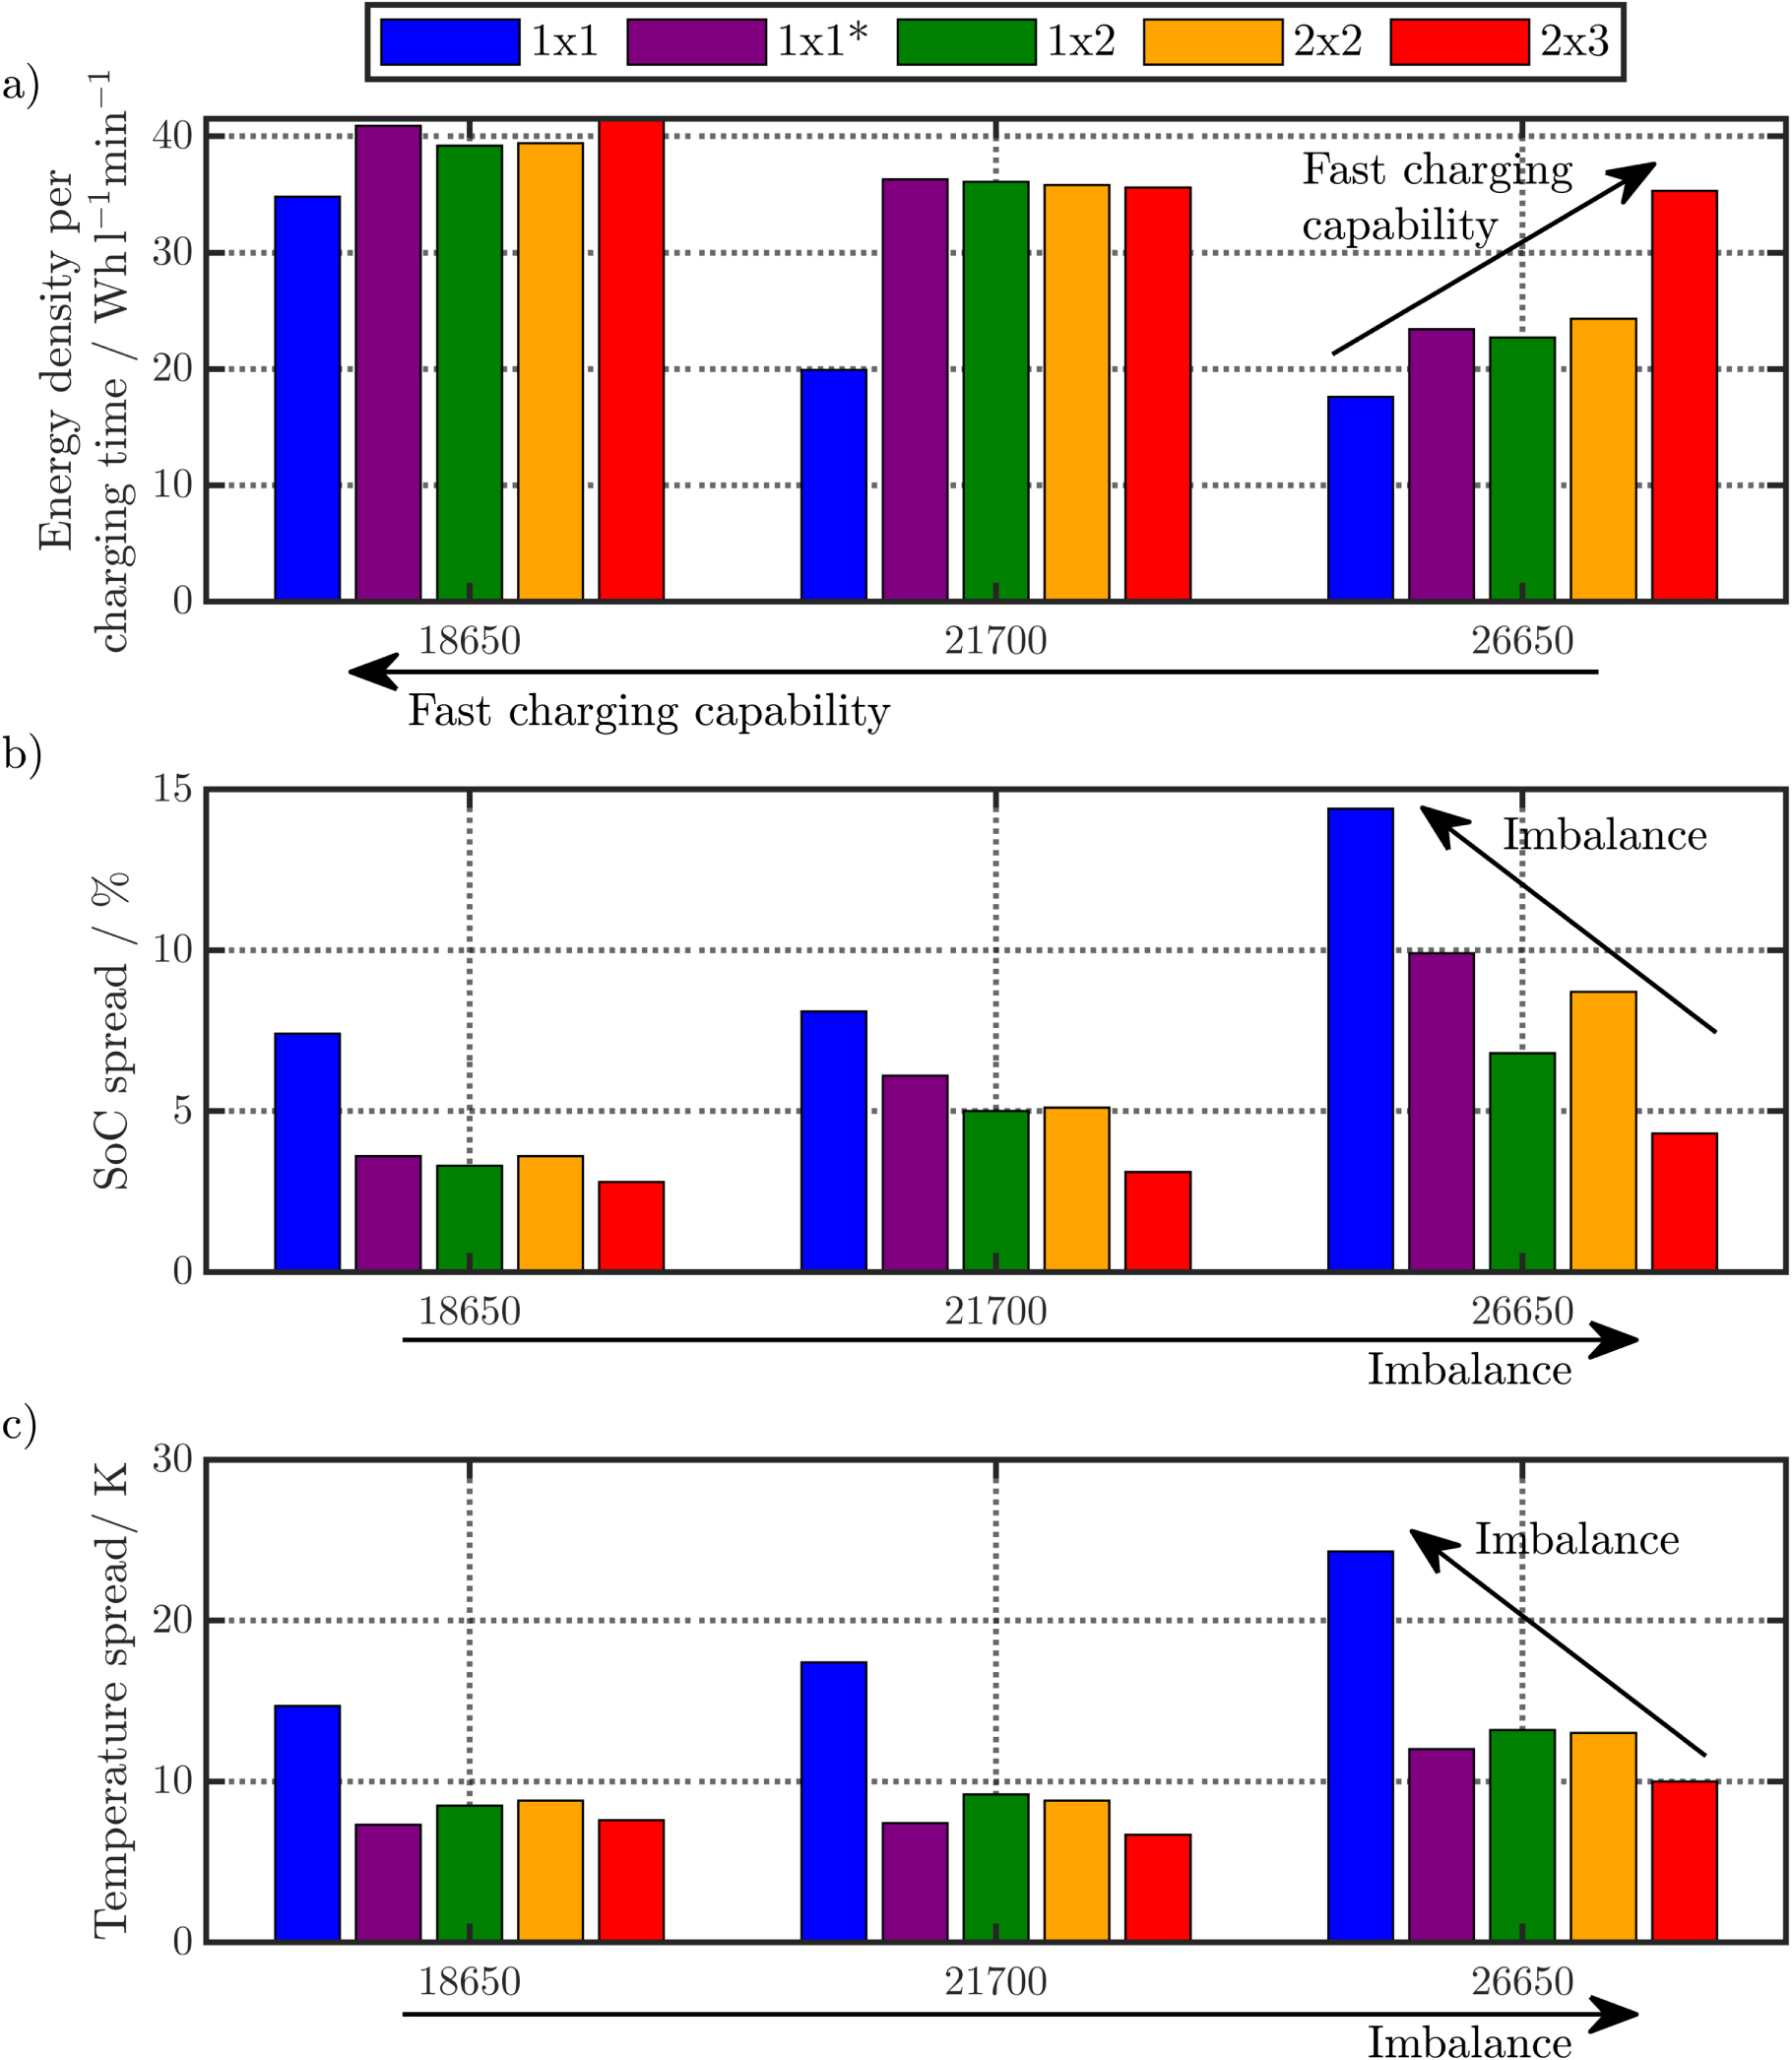
The bigger the cell radius, the slower the charging. At most 36.3 Whl−1 min−1 for the 21700_1 × 1* and 35.3 Whl−1 min−1 for the 26650_2 × 3 design appear with increased spreads in SoC around 6.1% and 4.3%, respectively. Again, the 1 × 1 designs reveal the poorest performance. The 26650 formats reveal the maximum temperature inhomogeneity beyond 10 K in all designs due to the limited radial heat transport based on the largest cell diameter. The resulting heat accumulation leads to overheating in the 2C current phase, which triggers a 2nd current step to 1C in case of the 1 × 1*, 1 × 2, and 2 × 2 tab designs. Consequently, these studies reveal significantly lower energy per time ratios and offer a low capability under 25 Whl−1 min−1 while fast charging. Compared to the 18650 designs, the 21700 cases reveal a similar temperature spread and a sufficient energy per time ratio at least beyond 35 Whl−1 min−1—except for the 1 × 1 tab design. Regarding the 1 × 1*, 1 × 2, 2 × 2, and 2 × 3 tab design for the 21700 format, the smaller effective electrode lengths lead generally to a lower spread in temperature and SoC, but also to increased charging times and lower energy per time ratios in the multi-step scenario.
To sum up, the 1 × 1 design for all three formats is critical in terms of overheating, leading to deviation in SoC and temperature, and overall shows the lowest capability toward fast charging. The 26650 format reveals overheating also for the remaining tab designs due to the poor thermal design and only the 2 × 3 tab design achieved an acceptable energy per time ratio and SoC deviation, but still a temperature spread around 10 K. Comparing the 21700 to the 18650 formats (except for the 1 × 1 tab design), slightly lower energy per time ratios and higher spread in SoC throughout the jelly roll appear, but a similar thermal performance underlines the benefit of using the 21700 formats.
The correlation between the in-plane heat generation and the tab design/format is shown in Table XII (see Appendix) to evaluate the charging energy efficiency via correlating the charged energy to the accumulated heat generation and cooling flow. The bigger the cell and the longer the effective electrode lengths, the higher the share of in-plane heat generation, but the lower the share of total converted heat from the total charged energy.
Comparing the thermally superior 21700 to the rather unfavourable 26650 format, an improved fast charging performance could possibly be achieved using a mid-sized format. As a prospect for future cylindrical cell formats, exemplary a 22800 (wele × hele = 102 × 7.3 cm) and 23700 (111 × 6.3 cm) are simulated. Either the jelly roll's diameter (⊘ 22 mm) and the height (80 mm) or only the diameter (⊘ 23 mm) are increased. The 22800_1 × 1* and 22800_1 × 2 designs show similar energy per time ratios as shown in Table VI. A slightly faster charging compared to the respective 21700 formats appears. The 23700_1 × 2 and 23700_2 × 2 designs tend to increased heat accumulation coming with higher temperature spread and maximum temperature. Focussing on the 22800_1 × 2 study, a speed-up of nearly 2 minutes could be achieved compared to the 21700_1 × 2 study, which offers a similar energy per time ratio at a slightly increased spread in SoC, but reduced temperature spread.
In sum, the thermal design is a key feature when a further increase in cell size from 21700 is favoured. The height can be slightly increased together with the diameter of the cell (22800), otherwise (23700) heat accumulation can become a significant issue to the cell's charging performance and safety.
Conclusions
The experimental analysis of state-of-the-art cylindrical LIBs revealed the highest gravimetric energy density within for a 18650 cell, whereas the highest volumetric energy density could be observed for a 21700 cell. Larger cells, such as the 26650 formats reveal lower gravimetric and volumetric energy density suggesting a delayed development of high-energy 26650 cells compared to the smaller 18650 and 21700 cells. A moderate charging simulation study at 1C-CC of the same three formats revealed a significant influence of the applied tab design on the in-plane polarization and the resulting temperature. The total polarization can be reduced by up to 36% within an ambient temperature range from 10 °C to 40 °C. At 3C-CC fast charging procedures, the local variance of the through-plane polarization across the active area can be similarly lowered by a factor of five and the in-plane polarization by a factor of four, which increases the charged SoC up to +23% at EoC. However, the shorter the effective electrode length is chosen, the lower the in-plane polarization becomes, which eventually increases the likeliness of lithium plating based on lower heat generation throughout the charging procedure and an overall prolonged charging process which comes with higher degrees of lithiation within the anode. Especially the heat accumulation effect in the larger-sized 21700 and 26650 formats tends to inhibit the onset of lithium plating due to the increased temperature rise. The locality of lithium plating onset mainly depends on the current collector tab design and the accompanied current density distribution. Evaluating an application-near multi-step charging profile under local cooling, the 21700 format reveals a comparable thermal behavior to the 18650 formats and less performance losses than the 26650 formats. For high energy 26650 formats overheating can be avoided by using multi tab design and the resulting effective electrode lengths should be long enough to avoid lithium plating in local cold spots. Still, the resulting imbalance of SoC and temperature in the jelly roll suggests more favourable cylindrical formats at lower cell diameters, preferably at slightly increased heights such as 22800 to improve the cooling performance.
In sum, choosing the right tab design for each format should improve rate capability, charging efficiency in form of the gained energy per time ratio, thermal safety, and resistivity toward localized lithium plating. The multi-step profile could be extended by further current steps, to reduce the charging time in total to increase the gained SoC level while maintaining the same thermal and lifetime relevant boundary conditions. In extension to this work, future research work could further investigate the impact of the current collector thicknesses in relation to the applied tab design. Future work could also focus on the economic efficiency for using multi-tab instead of single-tab design, which could investigate the trade-off between the higher expected manufacturing costs for multi-tab designs and the benefits of a more homogeneous utilization.
Acknowledgments
This work has received funding from the European Union's Horizon 2020 research and innovation programme under the grant "Electric Vehicle Enhanced Range, Lifetime And Safety Through INGenious battery management" [EVERLASTING-713771]. The authors thank the group of Prof. Hubert A. Gasteiger (Chair of Technical Electrochemistry, Technical University of Munich) for the possibility to carry out SEM and EDX measurements.
: Appendix
Table VII. Differential algebraic equations of the MuDiMod framework.
| P2D model | |
| Mass balancea) |
|
|
|
| Potentialsa) |

|

|
|
| Charge balancea) |

|
| Electrode |
![${j}_{{\rm{n}}}(x,t)=\tfrac{{i}_{0}(x,t)}{F}\left[\exp \left(\tfrac{{\alpha }_{{\rm{a}}}\,F\,\eta (x,t)}{R\,T}\right)-\exp \left(-\tfrac{{\alpha }_{{\rm{c}}}\,F\,\eta (x,t)}{R\,T}\right)\right]$](https://content.cld.iop.org/journals/1945-7111/167/13/130505/revision2/jesabb40cieqn96.gif)
|
| kineticsa) | η(x, t) = Φs(x, t) − Φl(x, t) − Eeq(x, t)−jn(x, t)F Rf |

|
|
| Heat Source |
|
|
|
|
|

|
|
| qp2D = qr + qrev + ql + qs | |
| 2D electrical model | |
![${\rm{\nabla }}={\left(\tfrac{\partial }{\partial x^{\prime} },\tfrac{\partial }{\partial y^{\prime} }\right)}^{{\rm{T}}}\qquad {\boldsymbol{\sigma }}=\left[\begin{array}{cc}{\sigma }_{\mathrm{cc},{\rm{x}}^{\prime} } & 0\\ 0 & {\sigma }_{\mathrm{cc},{\rm{y}}^{\prime} }\end{array}\right]$](https://content.cld.iop.org/journals/1945-7111/167/13/130505/revision2/jesabb40cieqn102.gif)
|
|
| Charge Balance |

|
| Potentials |

|
| Heat source |

|
| 3D thermal model | |
![${\rm{\nabla }}={\left(\tfrac{\partial }{\partial r^{\prime\prime} },\tfrac{\partial }{\partial \psi },\tfrac{\partial }{\partial z^{\prime\prime} }\right)}^{{\rm{T}}}\quad \quad {\boldsymbol{\lambda }}=\left[\begin{array}{ccc}{\lambda }_{\perp } & 0 & 0\\ 0 & {\lambda }_{\parallel } & 0\\ 0 & 0 & {\lambda }_{\parallel }\end{array}\right]$](https://content.cld.iop.org/journals/1945-7111/167/13/130505/revision2/jesabb40cieqn106.gif)
|
|
| Temperature |
|
| Heat source |
|

|
|

|
|
a)Ref. 45. b)Ref. 73. Γ Only at the surface of the jelly roll.
Table VIII. Parametrization of the MuDiMod framework31,48—Part I.
| Properties of single layers | Symbol | Unit | Anode | SeparatorP | Cathode | Electrolyte | ||
|---|---|---|---|---|---|---|---|---|
| Copper | SiC | NMC-811 | Aluminum | |||||
| Geometry | ||||||||
| Thicknessm | t | μm | 11 | 86.7 | 12 | 66.2 | 17.3 | |
| Density | ρ | kg m−3 | 8950a) | 2242b) | 1009c) | 4870d) | 2710a) | 1130c) |
| Particle radiusm,D50 | Rp | μm | 6.1 | 3.8 | ||||
| Active material fractione | εs | % | 69.4 | 74.5 | ||||
Inactive fraction 
|
εs,na | % | 9 | 8.4 | ||||
| Porosity | εl | % | 21.6m | 45e | 17.1m | |||
| TortuosityB | τ | --- |

|

|

|
|||
| Thermodynamics | ||||||||
| Equilibrium potentialm | Eeq | V | Ref. 48 | Ref. 48 | ||||
| Entropic coefficientm |

|
V K−1 | Ref. 48 | Ref. 48 | ||||
| Stoichiometrym | 100% SoC | 0.855 | 0.267 | |||||
| 0% SoC | 0.031 | 0.927 | ||||||
| Gravimetric loading | bg | mAh g−1 | 415b) | 275.5e) | ||||
| Maximum Concentratione | cs,max | mol m−3 | 34684 | 50060 | ||||
| Transport | ||||||||
| Solid diffusivityA | Ds | m2 s−1 | 5E-14f) | 5E-13g,h) | ||||
| Solid conductivity | σs | S m−1 |
 i) i) |
100h) | 0.17h) |
 j) j) |
||
| Film resistance | Rf | Ω m2 | 0.0035k) | 0e | ||||
| Kinetics | ||||||||
| Reaction rate constante,A | k | m s−1 | 3E-11 | 1E-11 | ||||
| Transfer coefficiente | αa/c | --- | 0.5 | 0.5 | ||||
| Ref. concentration | cl,ref | mol m−3 | 1 | |||||
| Thermal properties | ||||||||
| Heat capacity | cp | J kg−1 K−1 | 385c) | 867l) | 1978.2c) | 840.1e) | 903c) | 2055.1c) |
| Heat conductivityc) | λ | W m−1 K−1 | 398 | 1.04 | 0.33 | 1.58 | 238 | 0.6 |
| Solid diffusivitye,A |

|
K | 1200 | 1200 | ||||
| Reaction rate constante,A |

|
K | 3600e | 3600e | ||||
| Properties of electrode stack *,S | Effective values | |||||||
| Thickness | tstack | μm |

|
|||||
| Density | ρstack | kg m−3 |

|
|||||
| Heat capacity | cstack | J kg−1 K−1 |

|
|||||
| Heat conductivity | λ⊥ | W m−1 K−1 |
|
|||||
| λ∥ | W m−1 K−1 |

|
||||||
m = measured e = estimated, taken from Ref. 31 P Polyolefin S Superposition of solid and liquid phase P/C PVDF-binder/Carbon black (Ref. 74, 75).
B Bruggeman Transport Correction76:  , estimated within the model validation part of Ref. 31 and adjusted for the cathode in reference to Ref. 77.
A Arrhenius law78:  .
.
* The calculations are adopted from Ref. 79.
a)Ref. 80. b)Ref. 81. c)Ref. 79. d)Ref. 69. e)Ref. 82. f)Ref. 71. g)Ref. 72. h)Ref. 70. i)Ref. 83. j)Ref. 84. k)Ref. 85. l)Ref. 86.Table IX. Parametrization of the MuDiMod framework31,48—Part II.
| Property | Symbol | Unit | 1 M LiPF6 in PC/EC/DMC |
|---|---|---|---|
| Salt diffusivitya) | Dl | m2 s−1 |
|
| Ionic conductivitya) | κl | S m−1 |
|
| Activitya) |

|
--- |

|
| Transferencea) |

|
--- | 0.38 |
| Initial concentration | c0a) | mol m−3 | 1000 |
a)Ref. 87.
Table X. Calculation of the through-plane polarization25,61 incorporated in the MuDiMod framework.
| Polarization | Symbol | Unit | Anode | Separator | Cathode |
|---|---|---|---|---|---|
| Bounds of integration | |||||
| Thickness | x0 | μm | 0 | ta | ta + tsep |
| x1 | μm | ta | ta + tsep | ta + tsep + tc | |
| Reference current | |||||
| Current flow | itot | A m−2 |

|
n.a.a) |

|
| Polarization | |||||
| Electrolyte Diffusion |

|
V |
|
||
| ParticleDiffusion |

|
V |
 b) b) |
n.a. |
|
| Ohmic loss (l) |

|
V |

|
||
| Ohmic loss (s) |

|
V |

|
n.a. |

|
| Reaction kinetics |

|
V |
|
n.a. |

|
| Superposition |

|
V |

|
||
a)Referred to the total current flow through the cathode. b)Eeq,ave calculated from the lithium-ion concentration on average within the particle.
Table XI. Experimental test procedure for the investigated cylindrical LIBs.
| Check-up cycles | Chamber | ||
|---|---|---|---|
| Repetition | Sequencea) | Feature | Temperature |
| 1× | R-CCCH-R | CC: 0.2C, 4.2 V | 5 °C, 25 °C, or 40 °C |
| R: 30 min | |||
| 5× | CCDCH-R-CCCH-R | CCDCH: 0.5C, 2.5 V | |
| R: 30 min | |||
| CCCH: 0.2C, 4.2 V | |||
| 1× | CCDCH-CV-R | CCDCH: 0.2C, 4.2 V | |
| CV: <0.015C | |||
| R: 30 min | |||
| 2× | CCCH-CV-R-CCDCH-CV-R | CCCH: 0.2C, 4.2 V | |
| CV: <0.015C | |||
| R: 30 min | |||
| CCDCH: 0.5C, 2.5 V | |||
| 1× | CCCH-R | CC: 0.2C to 50% SoC | |
| R: 30 min | |||
| 3× | PCH-R-PDCH-R | P: 0.33C, 0.66C and 1C for 10 s | |
| R: 10 min | |||
| Rate test | |||
| 1× | CCCH-CV-R | CC: 0.2C, 4.2 V | 5 °C, 25 °C, or 40 °C |
| CV: <0.001C | |||
| R: 3 h | |||
| 3× | CCDCH-CV-R-CCCH-CV-R | CCDCH: 0.2C, 0.5C, 1C 2.5 V | |
| CV: <0.001C | |||
| R: 3 h | |||
| CCCH: 0.2C, 0.5C, 1C 4.2 V | |||
| 3× | CCDCH-CV-R | CCDCH: 5.7 A 2.5 V | |
| CV: <0.001C | |||
| R: 3 h | |||
| OCV test | |||
| 1× | CCCH-CV-R | CC: 0.1C, 4.2 V | 5 °C, 25 °C, or 40 °C |
| CV: <0.001C | |||
| R: 6 h | |||
| 1× | CCDCH-CV-R-CCCH-CV-R | CCDCH: 0.02C 2.5 V | |
| CV: <0.001C | |||
| R: 6 h | |||
| CCCH: 0.02C 4.2 V | |||
| 1× | CCDCH-CV-R-CCCH | CCDCH: 0.5C, 2.5 V | |
| CV: <0.015C | |||
| R: 5 min | |||
| CCCH: 0.2C to 50% SoC | |||
| EIS test | |||
| 1× | R | R: 3 h | |
| 1× EIS at 50% SoC with 140 mA excitation current from 10 mHz to 10 kHzb) | |||
a)CCCH constant current charge CCDCH constant current discharge CV constant voltage R rest period PCH charge pulse current PDCH discharge pulse current. b)5, 10, or 13 points per decade and 2, 5, or 10 measurements per frequency between 10 mHz-90 mHz, 100 mHz-990 mHz, or 1 Hz–10 kHz.
Table XII. Energy analysis derived from the cumulated power, heat generation, and cooling conditions during the multi-step current charging.
| Identifier | ξ |

|

|

|

|

|
| Unit | /Wh | /% | /% | /% | /% | /% |
| 18650a) | ||||||
| 1 × 13C→2C | 7.7 | 11.4 | 66.4 | 33.6 | 6.3 | 0.3 |
| 1 × 1*3C→2C | 8.6 | 9.8 | 82.9 | 17.1 | 5.5 | 0.3 |
| 1 × 23C→2C | 8.7 | 9.7 | 85.9 | 14.1 | 5.6 | 0.2 |
| 2 × 23C→2C | 8.9 | 9.5 | 90 | 10 | 5.5 | 0.2 |
| 2 × 33C→2C | 9.1 | 9.3 | 94.3 | 5.7 | 5.3 | 0.2 |
| 21700a) | ||||||
| 1 × 12C→1C | 14.1 | 9 | 53.6 | 46.4 | 6.1 | 0.3 |
| 1 × 1*3C→2C | 12.5 | 9.3 | 71.7 | 28.3 | 4.6 | 0.3 |
| 1 × 23C→2C | 13.1 | 9.2 | 75.7 | 24.3 | 4.7 | 0.2 |
| 2 × 23C→2C | 13.9 | 8.4 | 83 | 17 | 4.4 | 0.2 |
| 2 × 33C→2C | 14.2 | 7.8 | 90.8 | 9.2 | 4.1 | 0.2 |
| 26650a) | ||||||
| 1 × 12C→1C | 16.3 | 11 | 34.4 | 65.6 | 6.1 | 0.3 |
| 1 × 1*3C→2C→1C | 21.1 | 8.7 | 56 | 44 | 5.6 | 0.2 |
| 1 × 23C→2C→1C | 21.6 | 8.2 | 62.2 | 37.8 | 5.3 | 0.2 |
| 2 × 23C→2C→1C | 22.4 | 7.9 | 71.6 | 28.4 | 4.9 | 0.2 |
| 2 × 33C→2C | 19.9 | 7.8 | 83.9 | 16.1 | 3.6 | 0.2 |
| Prospective cylindrical formatsa) | ||||||
| 22800_1 × 1*3C→2C | 15 | 9.2 | 67.5 | 32.5 | 4.4 | 0.2 |
| 22800_1 × 23C→2C | 16 | 9 | 72 | 28 | 4.4 | 0.2 |
| 23700_1 × 23C→2C→1C | 19.3 | 8.5 | 70.7 | 29.3 | 5.5 | 0.2 |
| 23700_2 × 23C→2C | 16.4 | 8.9 | 77.7 | 22.3 | 4.4 | 0.2 |
2C→1C 2-step current profile from 2C- to 1C-CC.
3C→2C 2-step current profile from 3C- to 2C-CC.
3C→2C→1C 3-step current profile with inital 3C-, subsequent 2C-, and final 1C-CC phase.
a)Cooling surface to volume ratio: 18650 [56 m−1], 21700 [46.7 m−1], 22800 [45.1 m−1], 23700 [42.4 m−1], and 26650 [37.8 m−1].Table XIII. Nomenclature I.
| Greek symbols | ||
|---|---|---|
| α | --- | Transfer coefficient |
| αconv | W m−2 K−1 | Heat transfer coefficient |
| β | --- | Bruggeman coefficient |
| ε | --- | Volume fraction |
| εrad | 0.75 | Radiation emission coefficient |
| ξ | Wh kg−1 | Energy density |
| η | V | Overpotential in Butler-Volmer kinetics |
| κ | S m−1 | Ionic conductivity |
| λ | W m−1 K−1 | Heat conductivity |
| ρ | kg m−3 | Mass density |
| σ | S m−1 | Electrical conductivity |
| σb | 5.67 × 10⁻⁸ W m−2 K−4 | Stefan-Boltzmann constant |
| τ | --- | Tortuousity |
| Φ | V | Electrical potential |
| ψ | rad | Azimuthal-coordinate in 3D model |
| Ψarc | rad | Azimuthal angle |
| χ | Thickness ratio | |
| Indices | ||
| a | Negative electrode (Anode) | |
| act | Active area of anode and cathode overlap | |
| app | Globally applied | |
| arc | Arc-length of archimedial spiral | |
| c | Positive electrode (Cathode) | |
| cc | current collector | |
| con | Heat conduction | |
| conv | Heat convection | |
| eff | Transport corrected (Bruggeman correlation76) | |
| ele | Electrode | |
| eq | Equilibrium | |
| g | Gravimetric | |
| jr | Jelly roll | |
| l | Liquid phase | |
| p | Isobar | |
| pas | Passive | |
| rad | Heat radiation | |
| r | Reaction heat | |
| rev | Reversible heat | |
| s | Solid phase | |
| sep | Separator | |
| ss | Active particle surface | |
| stack | Electrode stack | |
| surf | Surface | |
| + | Positive current collector | |
| − | Negative current collector | |
Table XIV. Nomenclature II.
| Latin symbols | ||
|---|---|---|
| a | m−1 | Specific surface |
| bg | mAh g−1 | Maximum theoretical loading |
| c | mol m−3 | Concentration of lithium-ions (Li+) |
| cs,max | mol m−3 | Maximum theoretical concentration of Li+ |
| cp | J kg−1 K−1 | Heat capacity |
| D | m2 s−1 | Diffusion coefficient |
| Eeq | V | Equilibrium potential vs Li/Li+ |
| f± | --- | Mean molar activity coefficient of electrolyte |
| F | 96 485 As mol−1 | Faraday's constant |
| h | m | Height of active electrode area |
| i | A m−2 | Current density |
| I | A | Applied current |
| iapp | A m−2 | Applied current density |
| in | A m−2 | Current density perpendicular to particle surface |
| ip2D | A m−2 | Current density perpendicular to current collectors |
| i0 | A m−2 | Exchange current density |
| jn | mol m−2 s−1 | Pore-wall flux |
| k | m s−1 | Reaction rate constant |
| m | kg | Mass of the jelly roll |
| r | m | Radial-coordinate of particle domain in p2D model |
| r'' | m | Radial-coordinate in 3D model |
| R | 8.314 J mol−1 K−1 | Gas constant |
| Rf | Ω m2 | Surface-layer resistance |
| Rp | m | Particle radius |
| q | W m−3 | Heat generation rate per volume |
| Q | W | Heat generation rate |
| t | s | Time |
| ti | m | Thickness of layer i |

|
--- | Transference number |
| T | K | Temperature |
| w | m | Length of active electrode area |
| x | m | x-coordinate in p2D model |
| x' | m | x-coordinate in 2D model |
| y' | m | y-coordinate in 2D model |
| x'' | m | x-coordinate in 3D model |
| y'' | m | y-coordinate in 3D model |
| z'' | m | z-coordinate in 3D model |
Table XV. Nomenclature III.
| Abbreviations | |
|---|---|
| DEC | Diethyl carbonate |
| DMC | Dimethyl carbonate |
| DoD | Depth of discharge |
| DVA | Differential voltage analysis |
| FEM | Finite element method |
| G | Graphite |
| E | Electrical model |
| EC | Ethylene carbonate |
| ECM | Equivalent-circuit model |
| ESPM | Extended single particle model |
| EV | Electric vehicle |
| LCO | LiyCoO2 |
| LFP | LiyFePO4 |
| LiPF6 | Lithium hexafluorophosphate |
| LMO | LiyMn2O4 |
| MuDiMod | Multidimensional multiphysics modelling framework |
| NCA | LiyNi0.8Co0.15Al0.05O2 |
| NMC-111 | LiyNi0.33Mn0.33Co0.33O2 |
| NMC-532 | LiyNi0.5Mn0.3Co0.2O2 |
| NMC-811 | LiyNi0.8Mn0.1Co0.1O2 |
| OCP | Open-circuit potential vs Li/Li+ |
| OCV | Open-circuit voltage |
| p2D | Pseudo-two dimensional model |
| PC | Poly-carbonate |
| PVDF | Polyvinylidene fluoride |
| SiC | Graphite host lattice with content of silicon |
| SoC | State of charge |
| SPM | Single particle model |
| T | Thermal model |