
Abstract
Lithium-ion cells and batteries pose safety risks along with their favorable characteristics such as high energy and power densities. The numerous differences in chemistries and form-factors along with poor manufacturing quality in some cases, can lead to unpredictable field failures with this battery chemistry. The safety of lithium-ion cells and batteries at various states of charge (SOC) has not been studied comprehensively in the past and the goal of this study was to determine if the result of off-nominal conditions would vary with SOC. The study includes cells and batteries of different form factors, cathode chemistries, and capacities. The off-nominal conditions that the cells were exposed to were high-temperature and low impedance external short. In addition to this, voltage stability for the cells and batteries at various SOC was studied for a period of 9 months. The results demonstrate the differences in the level of safety for the cells and batteries at different SOC.
Export citation and abstract BibTeX RIS

This is an open access article distributed under the terms of the Creative Commons Attribution Non-Commercial No Derivatives 4.0 License (CC BY-NC-ND, http://creativecommons.org/licenses/by-nc-nd/4.0/), which permits non-commercial reuse, distribution, and reproduction in any medium, provided the original work is not changed in any way and is properly cited. For permission for commercial reuse, please email: permissions@ioppublishing.org.
Lithium-ion cells provide the highest energy density of all rechargeable battery systems in the world today. The advantages of very high energy density, specific energy, long cycle life, lack of memory effect, and medium to high rate capability makes them the chemistry of choice to power a variety of applications. Associated with these advantages is the hazardous nature of the li-ion systems. If not designed or used correctly, they can display catastrophic results such as smoke and fire as well as thermal runaway.
All consumer electronics today from smart watches to laptops use lithium-ion batteries. The use has spread to consumer goods from toys to hoverboards and smart luggage. On the larger spectrum, this chemistry is used in automotive, space, and marine applications as well as in stationary grid energy storage systems.
The production of lithium-ion and lithium-metal cells have increased from 3 billion cells in 2007 to over 7 billion cells in 2017 according to U.S. Transportation Department's Pipeline and Hazardous Materials Safety Administration (PHMSA).1 The increased demand by consumers and the fact that the cells are manufactured only in certain countries in the world, requires that they be transported to different parts of the world based on the location of the battery manufacturing facilities and the consumer. Lithium-ion and lithium metal batteries in turn, after manufacturing, need to be transported to the location of the consumer. Several incidents have been reported from fires observed in airplane cabin environments caused by batteries being crushed in airplane seats, power banks being over-charged, and camera batteries unexpectedly catching fire. In-cabin fires are more easily put out as the flight attendants and crew are trained to extinguish such fires. The bigger concern are the cells and batteries that are carried in the cargo compartment of passenger and cargo aircraft.
Hazards associated with failures of lithium-ion cells and batteries are dependent on several factors including the specific chemistries, design of electrodes, cell and battery form-factors, quality of manufacturing, and state-of-charge (SOC). These factors determine chemical and thermal stability as well as degradation and failure modes. Depending on the type and the energy content of the cells and batteries, thermal runaway, fire and explosion can occur, and toxic fumes can be released, which can lead to a significant loss of property and life in extreme cases. Hazardous and toxic gases such as carbonates, hydrogen, benzene, carbon monoxide, and fluorides may be released from damaged or failed batteries.2–4
Lithium-ion cells are highly susceptible to temperature increases and undergo a series of exothermic reactions at elevated temperatures that may lead to a thermal runaway. The protective coating formed on the negative electrode in a lithium-ion cell, commonly referred to as the solid electrolyte interphase (SEI), begins to decompose above 70 °C and gives way to negative electrode/electrolyte reactions (occurring above 110 °C), positive electrode/solvent reactions (occurring above 170 °C), and decomposition of positive electrode and electrolyte materials (occurring above 180 °C).5,6 These are all exothermic reactions in addition to combustion of any electrolyte and flammable materials within the batteries. The onset temperatures for thermal runaway and total exothermic heat vary depending on component materials, as well as the designs of the cells and batteries.
The International Cargo Aviation Organization (ICAO) has restrictions on transporting lithium-ion cells or batteries by limiting the SOC to not exceed 30%. This restriction helps to improve transportation safety of lithium-ion cells considerably.7 However, as mentioned earlier, several factors influence the safety of lithium-ion cells. Hence, one cannot conclude that all cell designs have benign outcomes at and below the same SOC under off-nominal conditions. Even at the same SOC, cells with different formats, manufacturers, and chemistry types may exhibit variable safety behavior. It is critical to study and understand the safety aspects and worst-case scenarios resulting from cell failures in order to establish proper storage, shipping, and handling guidelines. Commercial lithium-ion cells have been studied previously at different SOCs with a focus on thermal stability.8 However, these studies have been limited to narrow SOC ranges, chemistry types, or form-factors. Safety of lithium-ion cells and batteries at various SOCs have not been studied comprehensively in the past and the goal of this study was to determine if the result of off-nominal conditions would vary with SOC for different cathode chemistries, form factors, quality, and manufacturers.
This work focused on studying the worst-case behavior of cells and batteries that were subjected to either a heating method or a low impedance external short. Cells of different formats (cylindrical and pouch), cathode chemistries (NCA, NMC, LFP), and capacities were studied in addition to two battery types. External short tests were not performed on cells that contained the internal Positive Temperature Coefficient (PTC) safety device located in certain cylindrical cell header designs. Storage at different SOC was also studied that allowed the understanding of self-discharge characteristics of the cells and batteries.
Experimental
Commercial lithium-ion cells of different formats, cathode chemistries, and capacities were studied. Batteries from two manufacturers were also used in the study. Photographs showing all the test items used in the study are presented in Fig. 1. Table I provides the details of the cell design, cathode chemistry, manufacturer rated capacity, the measured capacity, and the internal resistance of the test articles studied. Cell capacity was measured by following manufacturer recommended charge-discharge protocols. The 18650 li-ion cells labeled manufacturers A and B had the same manufacturer's name but were purchased from a reliable vendor and online, respectively. The sample number for the cell and battery level tests using the heating and external short methods was three.

Figure 1. Photograph of test samples showing cells and batteries from different manufacturers.
Download figure:
Standard image High-resolution imageTable I. Test samples used in the study.
| Manufacturer | Cell Design | Cathode Chemistry | Rated Capacity (mAh) | Measured Capacity (mAh) | Internal Resistance (mΩ) |
|---|---|---|---|---|---|
| A | 18650 | NCA | 3200 | 3230 | 45 |
| B | 18650 | NCA | 3200 | 1810 | 35 |
| C | 26650 | NMC | 5000 | 5030 | 19 |
| D | Pouch | NMC | 3300 | 3180 | 18 |
| 526495 | |||||
| E | 26650 | LFP | 2500 | 2520 | 6 |
| F | Pouch | LFP | 10000 | 10400 | 8 |
| 8790160 | |||||
| G (Single cell Smart phone battery) | Single pouch cell with BMS | Unknown | 2915 | 2770 | 57 |
| H (2P2S Camcorder battery) | 18650 | Unknown | 4900 | 4950 | 111 |
Initiation of thermal runaway in cells and batteries was performed using the heating method. A Kapton tape heater of 40 W power was used to initiate thermal runaway. The Kapton tape heater has been used in past research6,9 by the team and has provided highly reproducible results which was the reason this method was chosen as the thermal runaway trigger method. The heater dimensions were 1'' × 2'' or 2'' × 2''. The dimension of the heater depended on the cell format and dimensions. A heating rate of 10 °F min−1 (5.6 °C min−1) was maintained to heat the cells. The heater was turned off after the onset of thermal runaway or the cell voltage fell to 0 V indicating loss of functionality. The cells were subjected to thermal runaway at six different SOC, namely, 100%, 50%, 40%, 30%, 15% and 0%. Pouch format cells were all restrained during the heating tests. In the case of the battery pack with the 2P2S configuration, one cell in the battery pack was heated to initiate the thermal runaway.
External short tests were conducted on cells that did not contain the internal PTC devices, which limits the surge current. The load used for the short was 8–10 mΩ and the short was maintained for 3 h or until thermal runaway was observed. The pouch cells were restrained during test and Ni-reinforced tabs were used to obtain uniform electrical contact. Cells from manufacturers B, D, E, and F were tested under external short conditions at the six different SOC that were the same as those used for the heating test.
Cells and batteries from the various manufacturers were also subject to charge retention tests to determine the rate of self-discharge in batteries at different SOC for a storage period of nine months. Two samples of cells and batteries from each manufacturer were stored in controlled ambient temperature at the same six SOCs as for the heating and external short tests. Cell and battery open-circuit voltage (OCV) was recorded once every week for the first month and then once every month during the entire storage period.
Results and Discussion
Thermal heating test
Manufacturer A
Cells tested from manufacturer A exhibited venting for all SOCs tested from 0% to 100% and the results are highlighted in Fig. 2a and summarized in Table II. Venting was confirmed visually from the escape of gases from the top of the cells via vents in the header and the subsequent drop in the temperature of the cells. The lowest temperature at which venting occurred was 118 °C for the cells at 100% SOC and the highest temperature observed was 143 °C for the cells at 0% SOC. After venting, the cells continued to rise in temperature from the heat supplied by the tape heater as well as the self-heating occurring in cells due to exothermic reactions within the cells. Heating by the tape heater was shut off after the trigger cell went into thermal runaway or the cell voltage dropped to 0 V. Thermal runaway occurred in the cells at various onset temperatures for different SOC, except for cells at 0% SOC where no thermal runaway occurred. Post-test pictures in Supplementary Information Fig. S1 (available online at stacks.iop.org/JES/167/140547/mmedia) show the cells after heating test at 100% SOC for different manufacturers. Cell from manufacturer A catches fire and gets burnt following thermal runaway event. Cells tested at 15% SOC underwent thermal runaway at 213 °C with cells at higher SOC going into thermal runaway at lower temperatures. The onset temperature for thermal runaway for cells tested at 100% SOC was 174 °C. The severity of the hazards from these off-nominal tests were dependent on the SOC of the cells. Release of gases, electrolyte, and sustained fire were observed at higher SOC while mild thermal runaway with no fire was observed for cells tested at 15% SOC.
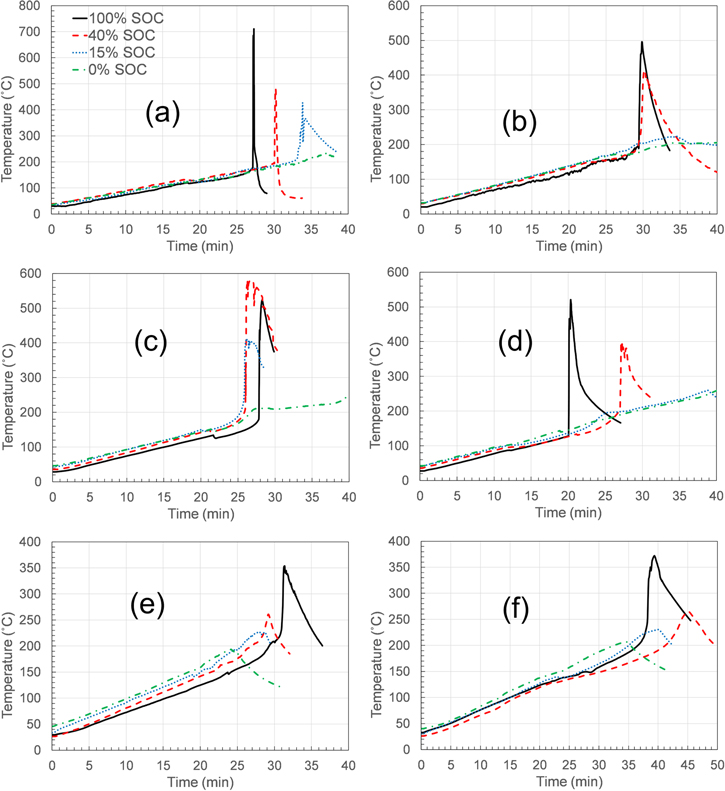
Figure 2. Temperature profiles for cells from different manufacturers that underwent heating tests at different SOCs.
Download figure:
Standard image High-resolution imageTable II. Summary of thermal characteristics of cells at different SOC during heating test.
| Cell Type | SOC (%) | Venting Temperature (°C) | Thermal Runaway Onset Temperature (°C) | Maximum Temperature (°C) |
|---|---|---|---|---|
| A—18650 NCA | 100 | 118 | 174 | 710 |
| 50 | 129 | 171 | 649 | |
| 40 | 129 | 191 | 482 | |
| 30 | 132 | 193 | 468 | |
| 15 | 129 | 213 | 427 | |
| 0 | 143 | 238 | ||
| B—18650 NCA | 100 | 96 | 191 | 493 |
| 50 | 121 | 141 | 310 | |
| 40 | 149 | 177 | 413 | |
| 30 | 143 | 182 | 349 | |
| 15 | 221 | |||
| 0 | 177 | 205 | ||
| C—26650 NMC | 100 | 135 | 177 | 522 |
| 50 | 143 | 188 | 628 | |
| 40 | 149 | 188 | 581 | |
| 30 | 143 | 199 | 557 | |
| 15 | 146 | 193 | 409 | |
| 0 | 154 | 246 | ||
| D—Pouch NMC | 100 | 77 | 113 | 521 |
| 50 | 81 | 169 | 467 | |
| 40 | 88 | 171 | 395 | |
| 30 | 93 | 248 | ||
| 15 | 96 | 260 | ||
| 0 | 96 | 259 | ||
| E—26650 lFP | 100 | 149 | 210 | 354 |
| 50 | 154 | 224 | 277 | |
| 40 | 154 | 221 | 260 | |
| 30 | 152 | 191 | ||
| 15 | 146 | 227 | ||
| 0 | 160 | 194 | ||
| F—Pouch LFP | 100 | 88 | 132 | 372 |
| 50 | 99 | 154 | 288 | |
| 40 | 88 | 157 | 264 | |
| 30 | 93 | 244 | ||
| 15 | 88 | 230 | ||
| 0 | 88 | 207 |
Manufacturer B
Cells from manufacturer B are indistinguishable visually and even advertised as the same as cells from manufacturer A. Differences in measured capacity (1.8 Ah) and advertised capacity (3.2 Ah) (see Table I) in cells from manufacturer B hint at a low-quality product. Temperature profiles of cells from manufacturer B during heating tests at different SOC are shown in Fig. 2b. Venting temperatures for cells tested from manufacturer B varied from 96 °C at 100% SOC to 177 °C at 0% SOC. Electrolyte leakage was observed only in some cells after cell venting. Cells tested at 15% SOC and at 0% SOC did not undergo thermal runaway. Cells tested at 100%, 50%, 40%, and 30% SOC underwent thermal runaway at 191 °C, 141 °C, 177 °C, and 182 °C respectively. The onset temperature for thermal runaway did not exhibit a correlation with cell SOC. As discussed later, the voltage profile indicated that the internal protective features found in the traditional lithium-ion 18650 cell (manufacturer A) were not present in the cells from manufacturer B. This was confirmed with a destructive analysis of the cells. In terms of hazards, release of smoke was observed for all cells tested. Fire was only observed in the case of cells tested at 100% SOC. Cells tested at 100% SOC experience a fire and the contents were ejected as shown in Fig. S1. The low measured capacity of manufacturer B was likely the reason for the non-catastrophic behavior of the cells from manufacturer B.
Manufacturer C
Cells tested from manufacturer C were of the cylindrical 26650 format with rated and experimentally measured capacity of 5.0 Ah. The temperature profiles for the cells at different SOC is shown in Fig. 2c. Venting was observed for cells tested at 100% SOC at 135 °C and with decreasing SOC, the temperature at which venting occurred increased. The highest venting temperature observed was 154 °C for cells tested at 0% SOC. With venting, all the cells started to leak liquid electrolyte. Following cell venting, with subsequent rise in cell temperatures, the cells entered into thermal runaway at various temperatures as a function of SOC. The thermal runaway onset temperature was 177 °C for cells tested at 100% SOC and the onset followed an increasing trend in temperature with decreasing SOC. The highest temperature for the onset of thermal runaway was 193 °C for cells tested at 15% SOC. Cells tested at 0% SOC did not go into thermal runaway. Minimal smoke was observed for cells tested at 0% SOC, however the cells tested at higher SOC released large amount of smoke. Cells tested at 100% SOC and 50% SOC also exhibited sustained fire after thermal runaway events. The results of this set of tests for manufacturer C followed the expected trend of less hazard severity with decreasing SOC.
Manufacturer D
The pouch format cells from manufacturer D tested at SOCs ranging from 100% to 0%, vented at temperatures between 77 °C and 96 °C following an increasing trend in venting temperature with decreasing SOC. The much lower venting temperatures observed with pouch cells compared to cylindrical metal can cells is due to the lower burst pressure of pouch cell format geometries. Lower burst pressures indicate that very high temperatures are not required for sufficient gas collection that would cause an opening of the pouch. With continued rise in cell temperatures, there was a second venting for all cells at temperatures between 117 °C–124 °C except for cells tested at 100% SOC. Cells tested 100% SOC underwent thermal runaway at 113 °C. The temperature profiles are presented in Fig. 2d. Onset of thermal runaway occurred at 169 °C and 171 °C for the cells at 50% SOC and 40% SOC, respectively. Although the cells were restrained while testing, swelling was observed in all cells. Cells that did not go into thermal runaway showed electrolyte leakage from the tab area of the cell. For cells that went into thermal runaway (SOC 40% and higher), cell pouch opening was observed along with a large amount of smoke. Fire was observed on cells tested at 100% SOC only. Figure S1 depicts the hazard observed in cell tested at 100% SOC showing burning and cell opening. There was minimal smoke and no fire for cells tested at SOC 30% and lower.
Manufacturer E
Venting occurred for all the cells from manufacturer E within a narrow temperature range from 146 °C to 160 °C. The volume of gas generated and the pressure created inside the cell dictate the vent activation. Given the narrow range of temperature observed for the cells tested at the various SOCs, it is possible that volume of gas and pressure generated is a stronger function of temperature compared to the SOC. Cells at 40% SOC and higher went into thermal runaway as shown in Fig. 2e. The onset temperatures for thermal runaway were 210 °C, 224 °C and 221 °C for cells tested at 100% SOC, 50% SOC, and 40% SOC respectively. There was no fire observed for any of the cells tested under the various SOC. Lack of fire limits the hazards for cells from manufacturer E and it is evident when comparing post-test pictures of cells tested at 100% SOC in Fig. S1. Electrolyte leakage and boiling was observed for all cells along with release of gases and separator materials from the vent holes in the header area. The amount of escaped smoke and gases were directly correlated to the cell SOC with a large amount of smoke for cells at 100% SOC and minimal smoke for cells at 0% SOC. Although no trend was observed for the venting temperatures, the amount of smoke was the maximum for cells at 100% SOC and it decreased with decreasing SOC. The estimates on the amount of smoke are given in relative terms as the exact volume of smoke was not measured and the estimates were based on a visual analysis of the video recordings.
Manufacturer F
The pouch format cells from manufacturer F did not exhibit a correlation between cell SOC and venting temperature. All cells vented at temperatures between 88 °C–99 °C. Electrolyte leakage from one corner of the cell was observed for all the cells. The temperature profiles for the cells at different SOC are shown in Fig. 2f. Thermal runaway occurred in the cells tested at 100% SOC at around 132 °C with a high amount of smoke and the cell opening from the sides. Mild thermal runaway was observed in cells at 50% SOC and 40% SOC with onset temperatures around 154 °C. For cells at 30% SOC and lower, no thermal runaway was observed. The amount of smoke released from the cells were correlated with the cell SOC and found to follow an increasing trend with increasing SOC. Although no trends were observed in the initial venting temperatures, the amount of smoke and the level of hazard decreased with decreasing SOC.
Manufacturer G
The single cell battery in pouch format from manufacturer G was subjected to heat-to-vent tests like other pouch format cells and the temperature profiles at different SOC are presented in Fig. 3. These batteries resemble those from a top-tier manufacturer (not tested in this project) and are labelled as such but are available at a much lower cost compared to those from the original manufacturer. Venting temperatures in this battery did not show any correlation with the SOC. Thermal runaway occurred when the batteries were at 30% SOC and higher. The lowest onset temperature for thermal runaway was 129 °C at 100% SOC and it displayed an increasing trend with SOC, reaching a temperature of 182 °C for the batteries at 30% SOC. The onset temperatures for venting and thermal runaway as well as the maximum temperatures recorded in battery tests are summarized in Table III. In terms of hazards, the maximum temperatures observed showed a good correlation to increasing SOC. The maximum temperature recorded was 608 °C for batteries at 100% SOC and decreased with lower SOCs. Electrolyte gases and liquid were released during venting in the batteries from the tab area for all the tests with the severity directly corresponding to the SOC of the batteries. The test articles at 100% SOC also caught on fire (Fig. S1). In summary, the venting temperatures did not show a correlation to the cell SOC, but the onset temperatures for thermal runaway went to higher temperatures with decreasing SOC and the maximum temperature recorded show a trend of decreasing temperatures with decreasing SOC.

Figure 3. Temperature profiles for batteries that underwent heating tests at different SOCs.
Download figure:
Standard image High-resolution imageTable III. Summary of thermal characteristics of batteries at different SOC during heating test.
| Battery Type | SOC (%) | Venting Temperature (°C) | Thermal Runaway Onset Temperature (°C) | Maximum Temperature (°C) |
|---|---|---|---|---|
| G (Single cell battery)—Pouch | 100 | 84 | 129 | 608 |
| 50 | 107 | 168 | 498 | |
| 40 | 99 | 163 | 399 | |
| 30 | 182 | 377 | ||
| 15 | 88 | 272 | ||
| 0 | 113 | 242 | ||
| H (2P2S battery)—18650 | 100 | 135 | 172 | 672 |
| 80 | 132 | 182 | 593 | |
| 50 | 136 | 171 | 382 | |
| 30 | 135 | 178 | 322 | |
| 0 | 168 | 227 |
Manufacturer H
Batteries from manufacturer H containing four 18650 cells in a 2P2S configuration were tested by heating a single cell in the battery. Temperature profiles of the battery at different SOC during the heating tests are shown in Fig. 3. Thermal runaway occurred in the trigger cell (cell with heater) for tests where the SOC was at 30% and higher. In the case of the battery at 30% SOC, there was no thermal runaway propagation to other cells. However, at higher SOC, it propagated to neighboring cells and all cells in the battery experienced thermal runaway. Intense smoke and sustained fire for over 5 min was observed in batteries tested at 80% SOC and 100% SOC whereas at lower SOCs, the battery test article did not catch fire. Figure S1 shows the battery tested at 100% SOC after the test completion with damage observed to the initiation cell and adjacent cells. The intensity of smoke from the test article correlated with the SOC with minimal smoke at 0% SOC. Thermal runaway onset occurred at temperatures ranging from 171 °C to 182 °C for tests between 100% SOC and 30% SOC. Maximum temperature in the test article reached 704 °C for test at 100% SOC and followed a downward trend with a maximum temperature of 232 °C recorded for test at 0% SOC.
Discussion of Results
Low-quality product behavior
Lithium-ion cells used in consumer devices incorporate safety components to protect against thermal and electrical hazards. The PTCs limit the flow of current through the cell when the cell experiences a large temperature rise, by increasing the resistance of the PTC device. Another safety component, the current interruption device (CID), protects against over-voltage by breaking the internal circuit when activated by increase in internal pressure of the cell.10,11 The activation of these safety components in heating tests are illustrated by comparing the voltage profiles of cells Fig. 4a and batteries Fig. 4b with and without these devices. Cell from manufacturer A contains the PTC and CID and the cells in the battery from manufacturer H also contain the PTC and CID. Voltage profiles for these cells and batteries are characterized by activation of the PTC marked by an initial drop in voltage. This is followed by a brief stabilization of cell voltage and a sudden drop leading to open-circuit conditions characterized by CID activation. These profiles are remarkedly different from cells and battery without PTC and CID from manufacturers B, D, and G included. In such cases, there is a delayed voltage response that is only noticeable when the cell undergoes thermal runaway. Erratic voltage responses in Fig. 4 are due to the volatile nature of thermal runaway reactions causing movement of voltage sensors and leads. Cells that are of high-rate capability are not fitted with a PTC as that would inhibit the power performance of the cells. Medium and low rate capability cells are fitted with a PTC as a protection against high current discharges or short circuits. Hence, the cells that have the LFP chemistry do not contain a PTC internal to the cell. However, the high energy 18650 cell from manufacturer B should have the PTC and CID and our analysis of the voltage plots as well as the destructive analysis indicated that these cells do not have a PTC or CID. This lack of internal protective features, which was confirmed by destructive analysis, along with the 50% capacity obtained compared to the rated capacity, suggests that the test article may not be from the original manufacturer, i.e., these may be counterfeit.

Figure 4. Voltage profiles of (a) cells and batteries (b) from different manufacturers that underwent heating tests at 100% SOC.
Download figure:
Standard image High-resolution imageSummary of results from the heating test
Hazards from the cells and batteries at different SOC subjected to the heating tests are summarized in Tables IV and V respectively. Post-test pictures of cells and batteries tested at 100% SOC are also presented in Fig. S1 showing variable level of hazards for different manufacturers. For all test samples, the hazards seem to follow an increasing trend with the SOC of the cell or battery, as expected. Among different chemistries, cells with LFP chemistries are more tolerant to abuse and less hazardous. The olivine structure in LFP cathodes are more stable compared with layered oxide cathodes such as NCA and NMC.8,12 High rates of oxygen release in unstable NCA and NMC cathodes contributes to increased thermal hazards. Of the cell designs tested in this work, the propensity for cells to go into thermal runaway is greater in cylindrical cells compared to that for pouch cells. No thermal runaway was observed in pouch cells at or below 30% SOC whereas in cylindrical cells, thermal runaway was observed in cells from some manufacturers when even at 15% SOC.
Table IV. Summary of results for cells at different SOC resulting from heating test.
| SOC (%) | ||||||
|---|---|---|---|---|---|---|
| Cell Type | 100 | 50 | 40 | 30 | 15 | 0 |
| A—18650/3.3Ah/NCA | TR + Smoke (2) + Fire (3) | TR + Smoke (2) + Fire (2) | TR + Smoke (3) + Fire (2) | TR + Smoke (3) + Fire (1) | Mild TR + Smoke (3) + Fire (0) | No TR + Smoke (1) + Fire (0) |
| B—18650/1.8Ah/NCA | TR + Smoke (3) + Fire (1) | TR + Smoke (3) + Fire (0) | TR + Smoke (3) + Fire (0) | TR + Smoke (3) + Fire (0) | No TR + Smoke (2) + Fire (0) | No TR + Smoke (1) + Fire (0) |
| C—26650/5.0Ah/NMC | TR + Smoke (3) + Fire (3) | TR + Smoke (3) + Fire (2) | TR + Smoke (3) + Fire (0) | TR + Smoke (3) + Fire (0) | TR + Smoke (3) + Fire (0) | No TR + Smoke (1) + Fire (0) |
| D—Pouch/3.3Ah/NMC | TR + Smoke (3) + Fire (2) | TR + Smoke (3) + Fire (0) | TR + Smoke (3) + Fire (0) | No TR + Smoke (1) + Fire (0) | No TR + Smoke (1) + Fire (0) | No TR + Smoke (1) + Fire (0) |
| E—26650/2.5Ah/LFP | TR + Smoke (3) + Fire (0) | TR + Smoke (3) + Fire (0) | Minor TR + Smoke (3) + Fire (0) | No TR + Smoke (2) + Fire (0) | No TR + Smoke (2) + Fire (0) | No TR + Smoke (1) + Fire (0) |
| F—Pouch/10.0Ah/LFP | TR + Smoke (3) + Fire (0) | Minor TR + Smoke (3) + Fire (0) | Minor TR + Smoke (3) + Fire (0) | No TR + Smoke (3) + Fire (0) | No TR + Smoke (2) + Fire (0) | No TR + Smoke (1) + Fire (0) |
| Fire | Smoke | |||||
| 0 | 0 | No | ||||
| 1 | 1 | Minor | ||||
| 2 | 2 | Moderate | ||||
| 3 | 3 | Heavy | ||||
Table V. Summary of results for batteries at different SOC resulting from heating test.
| SOC (%) | ||||||
|---|---|---|---|---|---|---|
| Battery Type | 100 | 50 | 40 | 30 | 15 | 0 |
| G—Pouch/2.9Ah | TR + Smoke (3) + Fire (1) | TR + Smoke (3) + Fire (0) | TR + Smoke (3) + Fire (0) | TR + Smoke (1) + Fire (0) | No TR + Smoke (2) + Fire (0) | No TR + Smoke (1) + Fire (0) |
| H—4.9Ah 2P2S 18650 cells | TR + Smoke (2) + Fire (3) | TR + Smoke (3) + Fire (0) | Mild TR + Smoke (2) + Fire (0) | No TR + Smoke (1) + Fire (0) | ||
External short test
External short tests at various SOCs were performed on cells and batteries that did not have PTC devices. The results of the tests are provided below.
Manufacturer B
The application of external short for cells from manufacturer B led to an immediate increase in current to its maximum value along with a drop in voltage of the cells. The temperature and voltage profiles of cells at different SOC during the external short tests are shown in Fig. 5. The maximum current observed varied from about 30 A (for cells tested at 15% SOC) to 18 A (for cells tested at 30% SOC) and did not exhibit any correlation to the cell SOC. Following this process, there is a short stabilization period observed for the cell voltage and current and then the cells start to undergo a discharge since the load is still on the cell for a total of three hours. This period of discharge is more pronounced in cells at higher SOCs and is less apparent in cells at lower SOCs. This indicates that the remaining cell capacity decreases with lower SOCs and hence it takes shorter times for cell voltages to approach 0 V. This period is marked by a continuous discharge of the cells at a high current leading to an increase in the internal temperature of the cells accompanied by mass transport limitations within the cells. The increase in internal temperature of the cells is higher for cells at high SOC (Table VI). The maximum temperature observed was 149 °C for cells at 100% SOC and the minimum temperature of 54 °C was observed for cells at 0% SOC. The onset temperature for cells going into thermal runaway is lower for cells at higher SOC and the cells at higher SOC were more likely to go into thermal runaway compared to cells tested at lower SOC owing to the differences in internal heating. Visual observations from the videos during the tests verified the extent of damage to the cells. Cells tested at higher SOC showed the most damage including cell rupture and venting with smoke and ejection of hot liquid electrolyte from the cells. Damage to the cells and batteries after the completion of external short testing at 100% SOC is shown in Fig. S2. Cells tested at SOCs of 30% and lower displayed only heating of the terminal tabs without any venting of gases or electrolyte leakage from the cells.

Figure 5. Temperature and voltage profiles of cells during external short tests.
Download figure:
Standard image High-resolution imageTable VI. Maximum temperatures and currents at different SOC for cells and batteries during external short test.
| Cell/Battery Type | SOC (%) | Maximum Temperature (°C) | Maximum Current (A) |
|---|---|---|---|
| B—18650 NCA | 100 | 149 | 27 |
| 50 | 134 | 26 | |
| 40 | 135 | 28 | |
| 30 | 96 | 18 | |
| 15 | 90 | 30 | |
| 0 | 53 | 23 | |
| D—Pouch NMC | 100 | 132 | 114 |
| 50 | 111 | 97 | |
| 40 | 114 | 79 | |
| 30 | 109 | 89 | |
| 15 | 87 | 56 | |
| 0 | 50 | 41 | |
| E—26650 lFP | 100 | 93 | 23 |
| 50 | 90 | 40 | |
| 40 | 83 | 27 | |
| 30 | 82 | 34 | |
| 15 | 46 | 23 | |
| 0 | 36 | 20 | |
| F—Pouch LFP | 100 | 87 | 196 |
| 50 | 158 | 190 | |
| 40 | 129 | 163 | |
| 30 | 168 | 189 | |
| 15 | 82 | 185 | |
| 0 | 30 | 128 | |
| G (Single cell battery)—Pouch | 100 | 415 | 21 |
| 50 | 102 | 41 | |
| 40 | 105 | 39 | |
| 30 | 83 | 29 | |
| 15 | 52 | 36 | |
| 0 | 24 | 23 | |
| H (2P2S battery)—18650 | 100 | 79 | 44 |
| 50 | 79 | 42 | |
| 30 | 85 | 43 | |
| 0 | 41 | 30 |
Manufacturer D
Pouch cells tested from manufacturer D exhibited a decreasing trend in maximum current with decreasing SOC after the cells were externally shorted (Fig. 5). The maximum current observed was 114 A for cells tested at 100% SOC and the lowest current observed was 41 A for cells tested at 0% SOC. After the peak current and initial decrease in voltage, high rate discharge of the cells continues until the voltage drops to 0 V for all the cells. The temperatures recorded continued to increase during this period until they reached a maximum value when the cell was completely discharged. The maximum temperature in the cell was recorded at the tabs. Cell temperatures increased with increasing SOC (Table VI). The maximum temperature for the cells at 100% SOC was 132 °C and that for cells at 0% SOC was 52 °C. Cell swelling and rupture near the negative tab were observed with leakage of electrolyte and smoke coming from the tab area (Fig. S2). The positive tab material was nickel while the negative tab material was aluminum coated with nickel. In all the tests, charring and damage to the negative tab were observed. This was particularly severe in tests with high SOC (50% and 100%) resulting in melting and disconnection of the negative tabs in cells at 100% SOC, owing to its lower melting point compared to the positive terminal tabs.
Manufacturer E
The maximum currents observed from manufacturer E cells during the electrical abuse via external short were independent of cell SOC. This maximum value varied from slightly above 40 A in the case of cells tested at 50% SOC to above 20 A for cells at 0% SOC. Following the initial decline in voltage and the maximum current, a steady period for cell voltage and current was observed (Fig. 5). The cell temperatures continued to increase during this period until a maximum value was reached when the cell voltages decreased to 0 V. The maximum temperature achieved during the tests decreased with decreasing SOC and is summarized in Table VI. The highest recorded temperature was 93 °C for cells tested at 100% SOC and was 37 °C for cells at 0% SOC. The high temperatures achieved during the tests led to over-heated tabs, but there were no additional cell hazards observed such as smoke, rupture, or release of liquid electrolyte (Fig. S2).
Manufacturer F
When the pouch cells from manufacturer F were externally shorted, there was an immediate drop in voltage and the current reached the maximum value. The voltage and current dropped until the cells were fully discharged and the voltage reached 0 V. Cell temperatures continued to rise, with the highest temperatures observed around the tabs. The temperature and voltage profiles at different SOC are shown in Fig. 5. The maximum current and the maximum temperatures observed in the cells at different SOC (Table VI) were not dependent on the SOC of the cells under test. The highest value of the maximum current was observed was 196 A for cells at 100% SOC while the lowest value of that was 163 A for cells at 40% SOC. The positive tabs burned off in the cells from 100% to 30% SOC due to its lower melting point compared to negative tabs preventing the cells from experiencing the short circuit load (Fig. S2). The positive tab material in the cells was copper while the negative tab material was copper coated with nickel. The positive tab area also went into flames and was charred from overheating. Although this feature prevents the full understanding of the current and temperatures observed during an external short, the burning of the tabs is a fail-safe condition.
Manufacturer G
Batteries from manufacturer G were tested by removing the battery management system (BMS). The test results observed at different SOC follows similar trends as discussed earlier with the drop in voltage and a sharp increase in current with the application of the short circuit load. Temperature and voltage profiles of the batteries at different SOC are shown in Fig. 6. The high-rate discharge of the battery proceeds with an increase in internal cell temperature until the cell is fully discharged and the voltage reached 0 V. The highest value of maximum current recorded was 39 A in the case of the battery tested at 40% SOC and the lowest value of maximum current was 21 A for those at 100% SOC (Table VI). In the case of the test at 100% SOC, thermal runaway occurs with the maximum temperature reaching about 410 °C. Sustained fire in the tab area was accompanied by thermal runaway (Fig. S2). The maximum temperature observed followed a decreasing trend with SOC, with 118 °C recorded for the batteries at 50% SOC and 27 °C for those at 0% SOC. Swelling of the pouch was observed for all tests except for those at 0% SOC.

Figure 6. Temperature and voltage profiles of batteries during external short tests.
Download figure:
Standard image High-resolution imageManufacturer H
Batteries from manufacturer H subjected to the low impedance external short exhibited minimal hazard. The external short test was first conducted on the battery with the protective circuit board which is the BMS and it was found that the BMS provided the protection against the external short and hence there was no increase in current or temperature. Hence the tests were subsequently conducted after removing or bypassing the BMS in the battery pack. When the board was removed, the battery experienced the short circuit condition. However, the cells are fitted with an internal PTC that protects the cells from experiencing a catastrophic event. The maximum current recorded was relatively the same across all SOCs at about 44 A, except for 0% SOC where the maximum current was about 30 A. Accordingly, the temperature of the test article was below 82 °C for all the tests (Fig. 6 and Table VI) except for 0% SOC where the temperature observed was about 41 °C.
Self-discharge under storage conditions
Cells were stored at room temperature at different SOC and the OCV was monitored for a 9 month storage period. The change in voltage during long-term storage of cells from different manufacturers at different SOC are presented in Fig. 7. The excellent charge-retention properties of lithium-ion chemistry is further established by these results. Properties such as lack of memory effect, long cycle and calendar life among others, makes this chemistry an excellent choice to power multiple applications as described earlier. The rate of self-discharge was observed to be higher at both SOC extremes (100% and 0%) for all the samples. The largest decrease in open-circuit voltage was 148 mV after 9 months of storage and was observed for cells stored at 0% SOC for manufacturers B and E. For manufacturer B, the voltage losses are high across all SOC. This may be explained by the quality of the cells including compromise in materials used in the cell to keep the costs lower. The quality issues are also apparent in the variability observed in results shown in Fig. 7 for cells from this manufacturer. The abnormalities and irregular trends observed earlier in the safety of the cells from manufacturer B may be explained by the same facts as well. For other test samples, the higher rates of loss in voltage at the SOC extremes are explained by the higher rates of degradation due to parasitic side-reactions in the cell. Rate of side reactions including decomposition of electrolyte and surface film formation on electrodes are greater at the SOC extremes and contribute to the voltage losses observed in these tests.13 Differences in materials and chemistries affect cell performances and degradation mechanisms vary among the samples from different manufacturers.14 Because of these differences, degradation and the extent of voltage losses observed in test samples is different for different manufacturers for the same SOC.
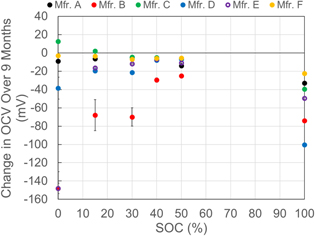
Figure 7. Change in cell OCV for different manufacturers at different SOC after 9 months storage at room temperature. The negative values show the decrease in voltage recorded.
Download figure:
Standard image High-resolution imageVoltage losses in the batteries during storage are presented in Fig. 8 by showing the decreasing trend in open-circuit voltage of the batteries at different SOC under room temperature over a period of 9 months. The voltage losses are significantly higher in batteries during storage when compared to cells under open-circuit conditions. The batteries have functional BMS that needs continuous power that is derived from the cells in order to operate which contributes to the slow drain of voltage during storage. Batteries from manufacturer G also show large voltage losses at lower SOC, but the voltages remain above 2 V. In the case of manufacturer H, voltages in batteries stored at 15% and 0% SOC drop to 0 V after 6 months and 3 months, respectively. This is due to the activation of the protective undervoltage metal-oxide-semiconductor field-effect transistor (MOSFET) switch, when the battery voltage falls below a certain value. MOSFET activations can typically be reset by placing the battery on the charger. The threshold for shut-off mechanisms in batteries fitted with the BMS differ among manufacturers and may be triggered differently. Factors such as cell chemistries and expected end applications affect the safety of batteries and thus the need to incorporate the required safety features through BMS controls.

Figure 8. Change in battery voltage for different manufacturers at different SOC during the room temperature storage period.
Download figure:
Standard image High-resolution image
Conclusions
The thermal stability and propensity for thermal runaway behavior in commercial lithium-ion cells and batteries with different formats, cathode chemistries, and stored energies was determined. The influence of SOC was investigated by using thermal and external short tests. Among the cells tested, the cells containing LFP positive electrode exhibited superior thermal stability compared to cells with NCA and NMC positive electrodes. The thermal behavior varied with SOC as expected, with cells at higher SOC being more susceptible to undergo thermal runaway. However, the minimum SOC at which the cells underwent thermal runaway varied among cell formats and chemistries, with cylindrical format NCA and NMC-based cells undergoing thermal runaway even at 15% SOC. The long-term storage tests indicated that cells are quite stable at the various SOCs for the storage period studied but the battery voltages are affected by the nature of the BMS in the battery. It is also noteworthy to mention that results from low quality cells and batteries are unpredictable and do not follow a typical trend with respect to the SOC.