
Abstract
Li(Ni0.5Mn0.3Co0.2)O2/artificial graphite cells containing different electrolyte additives were studied using electrochemical impedance spectroscopy (EIS) and X-ray photoelectron spectroscopy (XPS) after formation and after long-term charge-discharge cycling. Positive and negative electrodes were examined separately in symmetric cells to study the solid electrolyte interphase (SEI) at each electrode. EIS measurements were taken vs temperature, and activation energies (Ea) related to Li+ transport through the SEI were calculated. After cycling, Ea differed depending on electrolyte additive, electrode type, and cycling voltage limits. Charge transfer resistance was also compared after formation and cycling and did not always correlate with Ea trends, suggesting that multiple factors influence SEI properties. XPS was used to study the chemical composition and thickness of the SEI. Electrolyte additives affected the quantity of inorganic materials in the SEI, and more inorganic material appeared to correlate with lower Ea values. Cells containing lithium difluorophosphate electrolyte additive had the best lifetime of the cells studied in this work. These cells also showed the lowest SEI activation energy values, lowest charge transfer resistance, and most inorganic SEI composition after cycling.
Export citation and abstract BibTeX RIS

This is an open access article distributed under the terms of the Creative Commons Attribution 4.0 License (CC BY, http://creativecommons.org/licenses/by/4.0/), which permits unrestricted reuse of the work in any medium, provided the original work is properly cited.
Li-ion batteries experience capacity fade over their lifetime. Capacity fade is sometimes linked to impedance growth within the cell.1–5 One main factor that contributes to cell impedance is the formation of the solid electrolyte interphase (SEI), a passivating film that forms at the interface between electrodes and the electrolyte. 5–7 The SEI is formed during the initial charge ("formation") of the cell, consuming lithium and other materials in irreversible reactions. Further changes to the SEI occur during cycling and are associated with impedance growth and capacity fade.3,8–10
Figure 1 shows an example of normalized capacity and ΔV vs cycle number for cells with three different electrolyte systems containing different additives. The data in Fig. 1 has been published previously by Ma et al.,11–13 and is shown here to exemplify how different electrolyte additives have a significant impact on cycle life and impedance growth. ΔV is used as an indicator of internal resistance in the cell and is calculated as the difference between the capacity averaged charge voltage and the capacity averaged discharge voltage. Figure 1 shows that electrolyte additives have a significant impact on capacity retention as the cell with control electrolyte loses capacity far more quickly than cells with added vinylene carbonate (VC) or lithium difluorophosphate (LiPO2F2 called LFO in this paper). This correlation of capacity fade with the use of different electrolyte additives has been studied widely in the literature.14–19 It is believed that this impact on cell capacity is due to additives affecting the composition and properties of the SEI layers.6,20–23 This study was conducted in order to better understand the SEI in Li-ion cells, as the SEI plays a key role in cell degradation.

Figure 1. (a) Normalized capacity vs cycle number and (b) ΔV vs cycle number for Li-ion pouch cells with Li(Ni0.5Mn0.3Co0.2)O2/artificial graphite electrodes cycled from 3.0 V to 4.3 V at C/3 and 40 °C. Three cells are shown which contain a control electrolyte, control electrolyte with 2% vinylene carbonate additive (VC), and control electrolyte with 1% lithium difluorophosphate (LiPO2F2) additive. Data courtesy of Xiaowei Ma, Lin Ma, and Jamie Stark, Dalhousie University.11–13
Download figure:
Standard image High-resolution imageAs suggested by Peled,24 it is believed that several chemical species form the SEI in a mosaic-like structure. The chemical composition of the SEI depends on the electrolyte and electrolyte additives,10,20,22 however the composition and formation mechanisms are still not well understood.25,26 Lots of work has been done to try and quantify the thickness and composition of the SEI in Li-ion cells.9,10,12,27–35
In this study, SEIs formed on single crystal; Li(Ni0.5Mn0.3Co0.2)O2 (NMC532) positive electrodes and artificial graphite (AG) negative electrodes were probed for cells containing three different electrolyte mixtures. Studies were conducted on cells just after formation and after long term cycling for cells cycled to 4.2 V and cells cycled to 4.4 V. SEI impedance, composition, and thickness were studied using two techniques: XPS analysis, and temperature dependent EIS. XPS was used to study the composition of the SEI, and to glean information about SEI thickening. EIS studies using symmetric cells allowed for examination of cell impedance from each electrode separately. Contact resistance (Rcontact), charge transfer resistance (Rct), and the capacitance associated with Rct were examined. Additionally, temperature dependent EIS allowed for the extraction of activation energy (Ea) values using the Arrhenius equation, as described below.
In this work, Rct includes the resistance to Li+ desolvation at the electrode surface in addition to the resistance due to Li+ passing through the SEI and into the surface of active electrode particles. As previously described in Keefe et al.,36 for the electrolytes and interfaces studied here, we believe the contribution from desolvation is much smaller than that due to ion conduction through the SEI. This is because changes to the electrolyte involving only a few percent of electrolyte additive, which will not change desolvation at all, greatly impact Rct. Other references which show the strong impact of electrolyte additives on Rct include Xia et al.37 who studied triallyl phosphate, Nelson et al.,17 who studied propene sultone, Petibon et al.18 who studied vinylene carbonate and trimethoxyboroxine, Wang et al.15 who studied p-toluenesulfonyl isocyanate, Yang et al.19 who studied lithium difluorophosphate, and Liu et al.16 who studied vinylene carbonate, triallyl phosphate, and 2% propene sultone (PES), 1% ethylene sulfate (DTD) and 1% tris(-trimethylsilyl)-phosphite (TTSPi) (PES211).
In a very simple model, it is expected that Rct follows the Arrhenius equation:38,39

In Eq. 1, Rct is the resistance to Li+ motion through the electrode/electrolyte interface, Ea is the activation energy associated with lithium ions hopping through sites in the SEI material, kB is the Boltzmann constant, T is the temperature, and A is a proportionality constant. In this study, EIS was performed at temperatures ranging from −10 °C to 40 °C. By plotting the logarithm of the charge transfer resistance vs the inverse of temperature, extraction of the activation energies associated with transport of Li+ through the negative electrode SEI and the positive electrode SEI was possible.
The capacitance associated with a constant phase element (CPE) in an electric circuit model may be calculated experimentally using the following equation:40

where ωmax is the frequency at which the imaginary part of impedance has a maximum, and Rct is the charge transfer resistance. This capacitance may represent the double layer capacitance across the electrolyte/SEI/electrode interfaces. The formula for the capacitance of a parallel plate capacitor is:

where ε is the dielectric constant of the material between the plates, εo is the permittivity of free space, A is the plate area and d is the spacing between the plates.41 Equation 3, is sometimes used to discuss SEI thickness, where C is calculated with Eq. 2 using parameters measured using EIS, A is the surface area of the active material, and d is the SEI thickness.42,43
The studies in this paper involved the three electrolytes. The control electrolyte was 1.2 M LiPF6 in EC:DMC 3:7 (w:w), while the other two electrolytes were control electrolyte + 2% VC, and control electrolyte + 1% LFO. Table I was constructed to summarize the components of the SEI expected in these cells. The information in this table is based on interpretations of XPS data from Madec et al.,9,10 Qian et al., 27 and Ma et al.
Table I. Chemical components of the SEI on a graphite negative electrode and a NMC532 positive electrode in cells cycled with control electrolyte, and control electrolyte with 2% VC or 1% LFO.9,10,12,27
| Electrode/Additive | Control | 2% VC | 1% LFO |
|---|---|---|---|
| Graphite negative | Lithium containing carbonates | Lithium containing carbonates | More LiF |
| LiF | LiF | Fewer carbonates | |
| Li2O | Oligo-VC | ||
| LiPOxFy, LixPFy | ROLi, Li2O | ||
| LiPOxFy, LixPFy | |||
| NMC532 positive | Lithium containing carbonates | LiF | More LiF |
| LiF | Lithium containing carbonates | Fewer carbonates | |
| Oligo-VC |
The results and discussion section is divided into several parts. The first section compares cells formed and cycled to 4.2 V. The next section compares cells formed and cycled to 4.4 V. The final section summarizes the Rct and Rcontact results for all cells in the previous two sections (cells formed and cycled to 4.2 V and 4.4 V).
Experimental
Electrolyte preparation
The chemicals used were as follows: ethylene carbonate (EC), dimethyl carbonate (DMC), lithium hexafluorophosphate (LiPF6), vinylene carbonate (VC), and lithium difluorophosphate (LiPO2F2—called LFO here). All electrolytes were prepared in an argon-filled glove box using chemicals from BASF and Shenzhen Capchem (EC:DMC 3:7 (w:w) from BASF (purity > 99.9%, water < 20 ppm), LiPF6 from Capchem (water < 20 ppm, HF < 5 ppm), VC from Capchem (purity > 99.9% and water < 20 ppm), and LiPO2F2 from Capchem). For all cells in these experiments, the control electrolyte mixture used was 1.2 M LiPF6 in EC:DMC 3:7 (w:w). Other electrolytes used were the control electrolyte mixture with two percent by weight VC (called control + 2% VC) and the control electrolyte mixture with one percent by weight LiPO2F2 (called control + 1% LFO).
Pouch cell and coin cell construction
Single crystal Li(Ni0.5Mn0.3Co0.2)O2 (NMC 532)/artificial graphite (AG) 402035-size wound pouch cells with a capacity of 210 mAh at 4.2 V were used in these experiments. Dry (no electrolyte), vacuum sealed cells were received from LiFun Technology (Xinma Industry Zone, Golden Dragon Road, Tianyuan District, Zhuzhou City, Hunan Province, PRC, 412000). The positive electrode loading was 21.1 mg cm−2, the electrode density was 3.5 g cm−3, and the active weight fraction was 94%. The negative electrode loading was 11.5 mg cm−2, the electrode density was 1.55 g cm−3, and the active weight fraction was 95.4%. The pouch cells were dried under vacuum in a 100 °C oven for 14 h to remove any moisture before filling with electrolyte. Approximately 0.85 ml (∼1 g) of electrolyte was used to fill each cell. Pouch cells underwent a formation process on a Maccor 4000 series charger, which involved wetting the cells at 1.5 V for 24 h, followed by a C/20 charge to either 4.2 V or 4.4 V, and a hold at top of charge for one hour. Cells were then discharged to ∼50% state of charge (SOC), which was ∼3.8 V for these cells. Pouch cells were either disassembled after formation, to make symmetric cells and coin cells, or were cycled for long term cycling tests. After formation, pouch cells that were to be cycled were degassed and re-sealed in an argon-filled glovebox. These cells were externally clamped to provide uniform pressure to the electrode stack while cycling. Pouch cells were cycled on a Neware battery tester (Shenzhen, China) at 40 °C. Cells were cycled between 3.0 V and either 4.2 V or 4.4 V at a charge/discharge rate of C/3 in constant current, constant voltage (CCCV) mode, with a cut-off current of C/20. One constant current C/20 cycle was done every 50 cycles.
For EIS testing, the pouch cells were disassembled in an argon-filled glovebox and negative electrode symmetric cells, positive electrode symmetric cells, and full cell coin cells were made from the charged electrodes. Two or three cells of the same type were fabricated to ensure repeatability. The same electrolyte that was used in the parent pouch cells was also used in the assembly of the symmetric cells and full coin cells. The electrodes punched for these cells had a surface area of 0.95 cm2 and were separated by a polypropylene blown microfiber separator (BMF—from 3 M Co., 0.275 mm thickness, 3.2 mg cm−2). The symmetric cell assembly process can be seen in detail in Petibon et al.44 The electrodes used in the symmetric cells were two-side coated, not single side coated, as shown in Keefe et al.36 Keefe et al.36 also showed that the additional layer of electrode material (the coating on the back side of the electrode) affects only the high frequency, contact resistance part of the Nyquist plots for these cells, while the Rct semicircle is unaffected.
Electrochemical impedance spectroscopy (EIS)
A BioLogic VMP3 was used to measure electrochemical impedance spectra of the symmetric cells and full coin cells. The spectra were collected over a frequency range of 100 kHz to 10 mHz with ten points per decade with a perturbation amplitude of 10 mV. Spectra were collected at −10 °C, 0 °C, 10 °C, 20 °C, 30 °C, and 40 °C. Measurements were taken at 10 °C at the beginning, middle, and end of the experiments to ensure repeatability. All Nyquist plots in this work show area specific impedances calculated based on the active electrode area of the coin cells. The negative and positive symmetric cell impedances were divided by two in order to only account for one of the two electrodes. The addition of the positive and negative symmetric cell data by frequency, as in a Bode plot, should give the full coin cell spectrum for cells from the same parent pouch cell.44 This is demonstrated in Fig. S1 (available online at stacks.iop.org/JES/167/120507/mmedia).
Figure S2 shows the equivalent circuit models used to fit impedance data in this paper. The high frequency semicircle is interpreted as contact impedance at the electrode active particle/current collector interfaces, while the mid-low frequency semicircle represents charge transfer resistance. More details on the EIS interpretation can be found in Keefe et al.36 Fits were completed using RelaxIS 3—Impedance Data Analysis (rhd instruments GmbH & Co. KG, Germany).
X-ray photoelectron spectroscopy (XPS)
Square samples (1 cm2) were cut from double sided electrodes in an argon-filled glovebox and rinsed three times in DMC solvent to remove residual EC and LiPF6 salt. Once dry, samples were mounted on sample holders using double-sided copper tape (3 M). To ensure that samples never came in contact with air, samples were transferred to the XPS apparatus using a custom-made transfer suitcase built at Dalhousie University.9 The analysis chamber was under ultra-high vacuum (UHV) (< 2 × 10⁻⁹ mbar) for data acquisition. XPS was done using a SPECS spectrometer with a PHOIBOS 150 hemispherical energy analyzer. Samples were irradiated with a Mg Kα source (hυ = 1253.5 eV). Data analysis was performed using CasaXPS software (version 2.3.12). For all spectra, calibration of BE was done using the 284.8 eV C-C peak. A Shirley-type background was fit around the regions of interest and the background was subtracted from the data. Peaks were fit in CasaXPS and assigned to different SEI and electrode material components based on BE. See Ref. 9 for more details about the experimental procedure.
Results and Discussion
Table II shows the matrix of formed and cycled pouch cells used in this study. Each row in the table corresponds to one pouch cell. The electrolyte additive, upper voltage limit, and voltage at disassembly are indicated for all cells. For cycled cells, the number of cycles and the capacity retention after cycling is indicated. Symmetric cells and full coin cells were made from all pouch cells in Table II and underwent temperature dependent EIS. Raw EIS data for (+/+), (−/−) and (+/−) cells at four of the eight measured temperatures can be found in Figs. S8-S22 in the supplemental material for every cell in Table II. Cells with a check mark in the "XPS" column are cells whose electrodes also underwent XPS analysis. Tables summarizing the cells in each results section are shown at the beginning of the sections.
Table II. Matrix of all formed and cycled pouch cells presented in this paper.
| Additive | Formed/Cycled | Formed/Cycled to (V) | Voltage at disassembly (V) | No. of cycles | Capacity retention | XPS |
|---|---|---|---|---|---|---|
| Control | formed | 4.2 | 3.8 | — | — | ✓ |
| 4.4 | — | — | ||||
| 2% VC | 4.2 | — | — | ✓ | ||
| 4.4 | — | — | ||||
| 1% LFO | 4.2 | — | — | ✓ | ||
| 4.4 | — | — | ||||
| Control | cycled | 4.2 | 3.8 | 722 | 80.6 | ✓ |
| 4.4 | 322 | 80.9 | ||||
| 2% VC | 4.2 | 392 | 99.1 | |||
| 677 | 97.4 | ✓ | ||||
| 4.4 | 385 | 97.8 | ||||
| 1% LFO | 4.2 | 383 | 98.6 | |||
| 683 | 97.7 | ✓ | ||||
| 4.4 | 384 | 98.2 | ||||
| 678 | 98.6 |
Figure 2 shows the capacity and ΔV vs cycle number for all cycled pouch cells in Table II. Panels (a) and (c) show cells cycled to 4.2 V and panels (b) and (d) show cells cycled to 4.4 V. Cells with the same electrolyte are shown in the same color. Pair cells show good reproducibility in most cases. Exceptions are the control electrolyte cells cycled to 4.2 V (panels (a) and (c)) and the control + 2% VC cells cycled to 4.4 V (panels (b) and (d)). Only the cells with better capacity retention and smaller ΔV growth were studied from these pairs (solid circle data points in both cases). Figures 2a and 2b show rapid capacity fade for the cells with control electrolyte while cells with 2% VC and 1% LFO additives have good capacity retention. Figures 2c and 2d show large ΔV growth for the cells with control electrolyte while cells with additives have minimal impedance growth. ΔV provides an estimate of internal cell impedance, therefore this simultaneous capacity fade and ΔV growth in the control cells suggests that impedance growth significantly contributes to capacity fade.
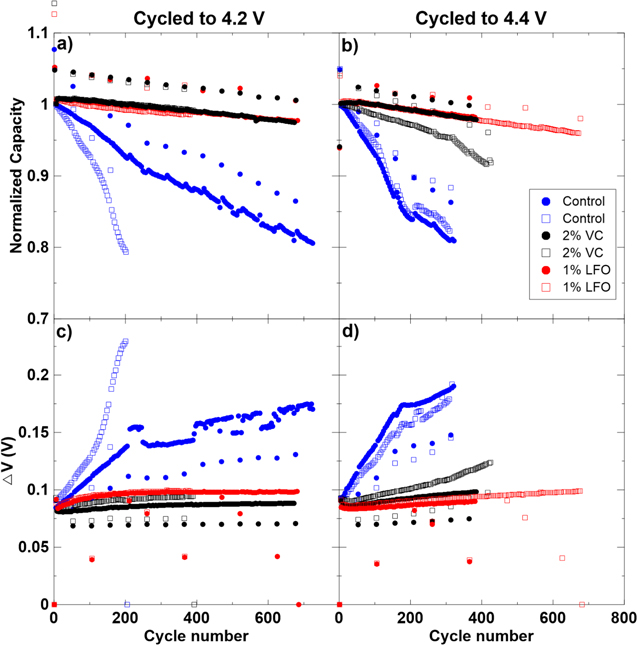
Figure 2. Normalized capacity vs cycle number, and (c) ΔV vs cycle number for cells cycled between 3.0 V and 4.2 V. (b) Normalized capacity vs cycle number, and (d) ΔV vs cycle number for cells cycled between 3.0 V and 4.4 V. In all panels, duplicate pouch cells containing control, control + 2% VC, and control + 1% LiPO2F2 (called LFO in the legend) electrolytes are shown.
Download figure:
Standard image High-resolution imageCells with control electrolyte cycled to 4.4 V experienced much quicker capacity fade than similar cells cycled to 4.2 V. This increase in capacity fade is expected at higher upper cutoff voltage (UCV) and has been observed by Nelson et al.,45 Thompson et al.,46 and Ma et al.,13 among many others, for different cell and electrolyte chemistries. Cells cycled to 4.2 V and 4.4 V containing 2% VC and 1% LFO electrolyte additives had similar capacity retention after ∼400 and ∼700 cycles.
Formed cells vs cycled cells to 4.2 V
Table III shows the matrix of cells in this comparison. All cells were formed or cycled to 4.2 V and disassembled at 3.8 V. The number of cycles and the capacity retention are indicated in the table. Cycled cells are labeled by approximate cycle number (∼400c or ∼700c) in future figures. Nyquist plots for negative and positive symmetric cells and full coin cells at −10 °C, 10 °C, 30 °C and 40 °C are shown in Figs. S8—S22.
Table III. Matrix of pouch cells formed and cycled to 4.2 V.
| Additive | Formed/Cycled | Formed/Cycled to (V) | Voltage at disassembly (V) | No. of cycles | Capacity retention (%) |
|---|---|---|---|---|---|
| Control | formed | 4.2 | 3.80 | — | — |
| cycled | 3.78 | 722 | 80.6 | ||
| 2% VC | formed | 3.78 | — | — | |
| cycled | 3.78 | 392 | 99.1 | ||
| cycled | 3.83 | 677 | 97.4 | ||
| 1% LiPO2F2 | formed | 3.80 | — | — | |
| cycled | 3.77 | 383 | 98.6 | ||
| cycled | 3.77 | 683 | 97.7 |
Figure 3 shows 10 °C Nyquist plots for (−/−) and (+/+) cells for all cells in this comparison. Figures 3a–3c show good agreement in Rcontact across all (−/−) cells. Figures 3d–3f show minor increases in Rcontact for (+/+) cells after cycling. Rcontact will be compared more closely at all temperatures in Fig. 5.

Figure 3. 10 °C Nyquist plots of symmetric cells from formed and cycled pouch cells with 4.2 V upper cutoff voltage (UCV). (a) and (d) show cells with control electrolyte; (b) and (e) show cells with control + 2% VC electrolyte; (c) and (f) show cells with control + 1% LiPO2F2 (called LFO in the legend) electrolyte. (a)–(c) show (−/−) cells and (d)–(f) show (+/+) cells. Legends indicate the voltage at disassembly (always 3.8 V here), the UCV voltage in brackets (always 4.2 V here), and the approximate number of cycles done by the cell before disassembly. Duplicate cells are shown for every cell type.
Download figure:
Standard image High-resolution imageFigure 3a shows that Rct decreases after cycling for (−/−) cells with control electrolyte, while Fig. 3d shows that (+/+) cell Rct increases significantly for control cells after cycling. The addition of the impedance from the positive electrode and the negative electrode in a control cell gives an overall increase in impedance after cycling. This increase in impedance after cycling is consistent with the ΔV results for the control cell as seen in Fig. 2c.
Figure 3b shows that Rct for the negative electrode changes only slightly over cycle life for cells with 2% VC additive, and Fig. 3c shows virtually no change in Rct for the negative electrode in cells with 1% LiPO2F2. Negative electrode Rct for 1% LiPO2F2 cells is significantly smaller than Rct for the 2% VC and control cells in agreement with Ma et al.12 and Liu et al.47 Figs. 3e and 3f show a reduction in positive electrode Rct for both 2% VC and 1% LiPO2F2 cells with cycle number. This suggests good SEI formation on the positive electrode in cells containing these additives. This differs from the trend for cells containing control electrolyte, in which positive electrode Rct increases significantly with cycling. Figure 10 summarizes Rct changes with cycling.
Figure 4 shows the logarithm of Rct vs 1/T for all cells in this comparison. The relationship is linear for all cells, indicating that Rct follows the Arrhenius relationship after formation and also after cycling. Ea values and errors are shown for each cell. Linear regression was used to fit the data and errors were calculated based on the standard deviation of the slope found by the fit. Ea values are stated with standard deviation in brackets. Data points at 40 °C (0.0032 K−1) were not included in the linear regression because of the large errors in fitting the charge transfer semicircle at this temperature. As shown in Figs. S8-S22, at 40 °C the charge transfer semicircle is often similar in size or smaller than the high frequency, contact impedance semicircle, making it difficult to resolve features and achieve reliable fitting results at high temperatures.
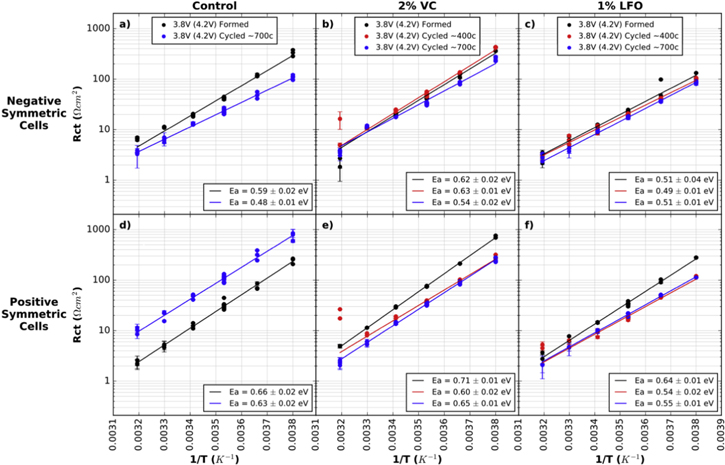
Figure 4. Rct plotted on a logarithmic scale vs the inverse of temperature for symmetric cells from formed and cycled pouch cells with 4.2 V UCV. (a) and (d) show cells with control electrolyte; (b) and (e) show cells with control + 2% VC electrolyte; (c) and (f) show cells with control + 1% LiPO2F2 electrolyte. (a)–(c) show (−/−) cells and (d)–(f) show (+/+) cells. Legends indicate the voltage at disassembly (always 3.8 V here), the UCV voltage in brackets (always 4.2 V here), and the approximate number of cycles done by the cell before disassembly. Duplicate and triplicate cell data is shown at each temperature, with additional points at 10 °C (0.0035 K−1) due to repeat tests at that temperature. The error bars shown are the statistical error from the fitting results, however the true error in the measurement is larger than this. Points at 40 °C (0.0032 K−1) were not used in the linear fit due to large errors in EIS fitting at high temperature.
Download figure:
Standard image High-resolution imageFor the negative electrode in control cells, Ea decreases from 0.59 (0.02) eV to 0.48 (0.01) eV after ∼700 charge-discharge cycles. This decrease in activation energy suggests a different SEI composition with a lower energy barrier to Li+ transport after cycling. Figure 3a also showed that Rct decreased by a factor of two after cycling in these control cells. Perhaps these decreases in Rct and Ea are caused by increasing negative electrode SEI porosity after cycling in control cells. This is discussed further below in relation to capacitance data.
Figure 4b shows that Ea for negative electrode cells with 2% VC remains constant after ∼400 cycles (0.62 (0.02) eV after formation and 0.63 (0.01) eV after ∼400 cycles), and then starts to decrease after ∼700 cycles (0.54 (0.02) eV). Figure 3b showed no major changes in Rct values for these cells. Figure 4c shows that Ea remains constant after cycling for LiPO2F2 cells. The mean and standard deviation across the formed cell, cell after ∼400 cycles, and cell after ∼700 cycles was 0.50 (0.01) eV. This suggests that cells containing LiPO2F2 form the most stable negative electrode SEI.
Figure 4d shows a significant increase in Rct magnitude for the positive electrode after cycling in the cells with control electrolyte. Although the magnitude of Rct changes dramatically, the slope of the line, and therefore the magnitude of Ea, remains the same which may surprise the reader. The increase in Rct suggests that the SEI becomes more resistive after cycling. The similarity in Ea before and after cycling suggests similar SEI compositions on these electrodes, however, the XPS results in Fig. 7 below indicate that the SEI surface composition changes after long term cycling.
Figures 4e and 4f show changes in positive electrode Ea after cycling for cells with 2% VC and 1% LFO respectively. Figure 4e shows that Ea decreases from 0.71 ± 0.01 eV (after formation) to 0.63 (0.04) eV after cycling (mean and standard deviation of the two cycled cells). Figure 4f shows that Ea decreases from 0.64 ± 0.01 eV (after formation) to 0.55 (0.01) eV after cycling (mean and standard deviation of the two cycled cells with 1% LiPO2F2). These Ea decreases are accompanied by Rct decreases for the positive electrode. Figures 4e and 4f showed that Rct decrease by about a factor of two after cycling for cells containing 2% VC and 1% LFO. These decreases indicate better Li+ transport through the positive electrode SEI after cycling, which may be due to changes in SEI composition or morphology.
The behavior of the SEI on negative and positive electrodes does appear to differ upon cycling. In control cells, Ea for the negative electrode decreased after cycling, while Ea for the positive electrode remained the same. In cells containing 2% VC, Ea for the negative electrode remained the same after ∼400 cycles and then decreased after ∼700 cycles, while Ea for the positive electrode decreased after ∼400 cycles and then stayed the same after ∼700 cycles. In cells containing 1% LiPO2F2, Ea for the negative electrode saw no change as a function of cycling, while Ea for the positive electrode noticeably decreased between formation and cycling. While the mechanisms for these differences may not be clear, the differences between the behavior of the two electrodes is consistent with reports of differing SEI composition between positive and negative electrodes. XPS results for electrode samples from these cells are examined below.
Figure 5 shows Rcontact vs temperature for the cells formed and cycled to 4.2 V in this comparison. No major differences are seen across (−/−) cells. Rcontact for the (+/+) cells with control electrolyte appears to increase with cycling. However, for (+/+) cells with 2% VC and 1% LiPO2F2 electrolyte additives, Rcontact appears to increase after ∼400 cycles and then decrease after ∼700 cycles. Differences are more prominent in cells cycled to higher voltages, which will be discussed below.
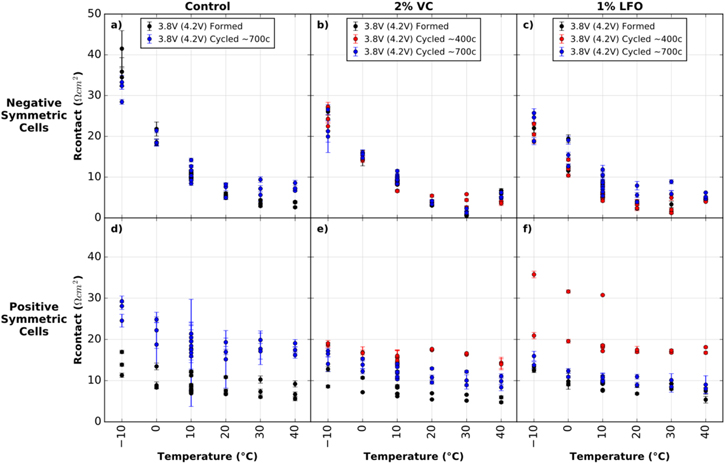
Figure 5. Rcontact vs temperature for symmetric cells from formed and cycled pouch cells with 4.2 V UCV. (a) and (d) show cells with control electrolyte; (b) and (e) show cells with control + 2% VC electrolyte; (c) and (f) show cells with control + 1% LiPO2F2 electrolyte. (a)–(c) show (−/−) cells and (d)–(f) show (+/+) cells. Legends indicate the voltage at disassembly (always 3.8 V here), the UCV voltage in brackets (always 4.2 V here), and the approximate number of cycles done by the cell before disassembly. Duplicate and triplicate cell data is shown at each temperature, with additional points at 10 °C (0.0035 K−1) due to repeat tests at that temperature. The error bars shown are the statistical error from the fitting results, however the true error in the measurement is larger than this.
Download figure:
Standard image High-resolution imageFigure 6 shows capacitance vs temperature for these cells. Capacitance values were calculated using Eq. 2. The characteristic frequencies associated with the charge transfer impedance used to calculate these capacitance values can be seen in Fig. S3 in the supplementary material. Using the parallel plate capacitor equation—Eq. 3—to model SEI capacitance suggests that a strong temperature dependence is not expected since neither the area of the SEI (A), the thickness of the SEI (d), or the dielectric constant of the SEI (ε) should vary with temperature for a stable SEI film over the temperature range tested. Only small changes in capacitance are observed here over the temperature range under study, excluding high temperature data due to large fitting errors—fitting becomes less accurate at high temperatures with this data as contributions from contact impedance and charge transfer impedance overlap.

Figure 6. Calculated capacitance (associated with Rct) vs temperature for symmetric cells from formed and cycled pouch cells with 4.2 V UCV. (a) and (d) show cells with control electrolyte; (b) and (e) show cells with control + 2% VC electrolyte; (c) and (f) show cells with control + 1% LiPO2F2 electrolyte. (a)–(c) show (−/−) cells and (d)–(f) show (+/+) cells. Legends indicate the voltage at disassembly (always 3.8 V here), the UCV voltage in brackets (always 4.2 V here), and the approximate number of cycles done by the cell before disassembly. Duplicate and triplicate cell data is shown at each temperature, with additional points at 10 °C (0.0035 K−1) due to repeat tests at that temperature. The error bars shown are the statistical error from the fitting results, however the true error in the measurement is larger than this.
Download figure:
Standard image High-resolution imageEquation 3 suggests that capacitance should decrease with increased SEI thickness. Capacitance values are about an order or magnitude different between positive and negative electrodes, suggesting a thinner positive electrode SEI. Figure 6a shows that the negative electrode capacitance decreases by > 60% after cycling in control cells. In contrast, Figs. 6b and 6c show no changes in negative electrode capacitance in cells with VC and LiPO2F2 additives. This suggests that SEI thickening is happening on the negative electrode in the control cell, which is consistent with the literature.10,27 Since SEI thickening consumes Li+, this is consistent with reports of Li+ inventory loss leading to capacity fade.48,49 Figure 3a showed a decrease in Rct for the control cell after cycling, and Fig. 4a showed a decrease in Ea after cycling. Perhaps this suggests a highly porous, thick SEI after cycling. Compared to a dense SEI, a porous SEI could have better Li+ transport, leading to a smaller measured Rct.
Figure 6d shows that the capacitance of the positive electrode SEI increases slightly after cycling in control cells. This increase in capacitance would indicate a decrease in SEI thickness, which will be discussed in the next section where increases in positive electrode capacitance are larger.
Figure 7 shows the F 1 s, O 1 s, C 1 s, P 2p, Ti 2p, and "TM + Li" (transition metals and lithium) XPS spectra for NMC532 electrodes. Spectra from a fresh, uncharged NMC532 electrode are shown in the top row. The following rows contain spectra from electrodes extracted from cells after formation and after ∼700 cycles. These are electrodes from the same cells that underwent temperature dependent EIS studies shown above in this section. All formed and cycled cells were disassembled at 3.8 V. Spectra for electrodes from control cells are shown in the second and third rows; 2% VC cells are shown in the fourth and fifth rows; 1% LiPO2F2 cells are shown in the sixth and seventh rows. Note that y-axes for similar spectra are the same (i.e. all F 1 s spectra, all O 1 s spectra etc.), allowing for the comparison of similar peaks between spectra.
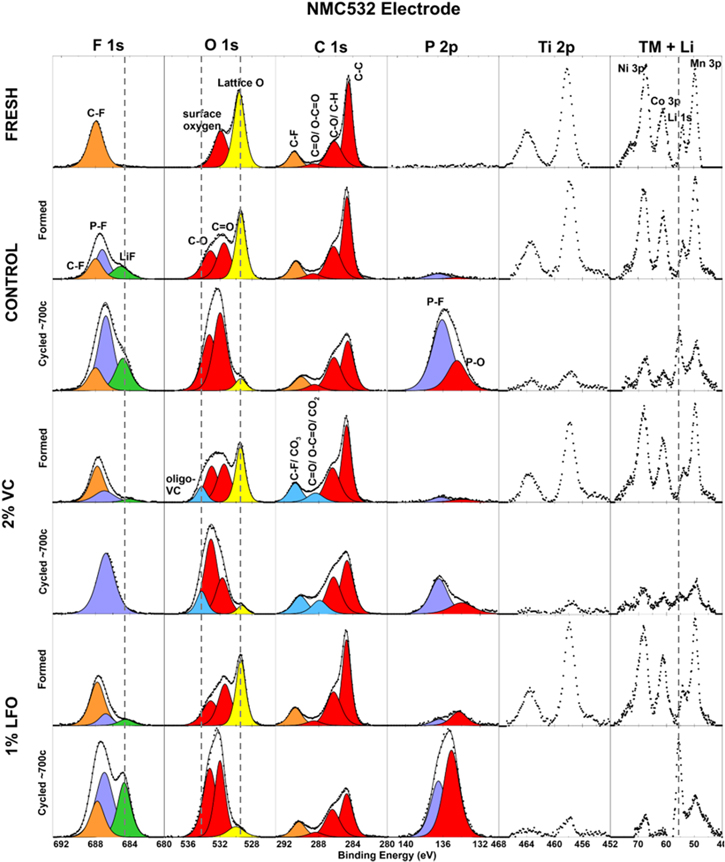
Figure 7. XPS data for NMC532 electrodes extracted from fresh, formed, and cycled pouch cells. Formed cells were formed to 4.2 V; cycled cells were cycled between 3.0 V and 4.2 V; all formed and cycled cells were disassembled at 3.8 V and contained control, control + 2% VC, or control + 1% LiPO2F2 (called LFO in the legend) electrolyte. Each row contains data from one electrode sample. F 1 s, O 1 s, C 1 s, P 2p, Ti 2p, and "TM + Li" (transition metals and Li) spectra are shown. The y-axis scales are equal for spectra of the same type (columns). Components are labeled based on BE and literature assignments.
Download figure:
Standard image High-resolution imageThe O 1 s spectra will be highlighted first. In the fresh electrode, two peaks are observed at 532 eV and 529.5 eV. The peak at 532 eV is typically assigned to surface oxygen,10,29 and the peak at 529.5 eV is due to lattice oxygen anions in the NMC active material (shown in yellow here).10,50 In formed and cycled cells, peaks at ∼533 eV and ∼531.5 eV are attributed to C–O and C=O bonds respectively. These peaks may be assigned to carbonaceous species from oxidation of electrolyte solvents at the NMC electrode.10 These peaks increase by different amounts in all cell types after cycling.
Compared to the fresh electrode, the lattice oxygen peak reduces slightly after formation, and a significant reduction is seen after cycling for all electrolytes. The lattice oxygen peak can be used as an indicator of SEI thickness. Upon SEI thickening, the active material gets covered in SEI, thus this peak signal weakens. Additionally, the Ti 2p spectra for all electrodes show two peaks which are associated with TiO2 from the NMC electrode coating. The "TM + Li" spectra shows Ni, Co, and Mn peaks from the NMC active material. The TiO2 and TM peaks are significantly smaller after cycling, in agreement with the decrease in the lattice oxygen peak. The magnitudes of both the lattice oxygen and TiO2 peaks do not differ substantially between electrolytes after cycling. This suggests that SEI thickness on the NMC532 electrode may be similar for all electrolyte systems after cycling. Major differences in cycling data for control cells compared to cells with 2% VC and 1% LiPO2F2 additives were presented above for these cells. Additionally, Rct magnitudes differed for (+/+) cells containing the three electrolytes after cycling. After cycling, Rct of 2% VC cells was about two times larger than Rct of 1% LiPO2F2 cells, and Rct of control cells was nearly three times larger than Rct of 2% VC cells. This suggests that SEI thickness alone may not be a major contributor to impedance and to capacity fade.
An additional peak at ∼534.3 eV is observed in the electrodes from 2% VC cells. This peak is associated with an oligomer of VC (oligo-VC) formed at the surface, and is highlighted in blue here.10,29,30 This peak increases slightly after cycling, suggesting continued oligo-VC production during cycling.
Blue peaks are also shown in the C 1 s spectra as they may also be associated with the production of oligo-VC. Ouatani et al.,29 Ota et al.,30 and Madec et al.9,10 associated peaks around these binding energies with CO3 and CO2 in oligo-VC. However, it is difficult to deconvolute these peaks from other peaks in the C 1 s spectrum. In the C 1 s spectrum of the fresh electrode, four peaks are shown with their assignments. The C-C peak appears to reduce after cycling for all electrolytes. The C-F peak at ∼290.8 eV is associated with the PDVF binder in the NMC electrodes and is highlighted in orange.51,52
In the F 1 s spectrum, C-F appears around 688 eV and is also highlighted in orange.51,52 C-F, associated with PVDF binder is the only visible peak in the fresh electrode, however, after formation and cycling, two more peaks appear in the F 1 s spectra. A peak at ∼687 eV is associated with fluorophosphates such as LiPF6 and LixPOyFz (purple).9,50 A fluorophosphate peak is also seen in the P 2p spectra at ∼137 eV.9,50 The fluorophosphate peaks increase significantly after cycling for all electrolytes. The P 2p spectra show a second peak around 134 eV associated with phosphates (PxOy).9,50 When comparing the electrodes with different additives after formation, it is clear that this PxOy is more prominent in the cell containing 1% LFO. After cycling, the cell with 1% LFO has the largest increase in PxOy.
Finally, LiF production is seen in the F 1 s spectra around 685 eV (green).9,32 LiF results from the degradation of LiPF6 salt in the electrolyte2,20 and production of LiF has been observed to increase with electrolytes containing LFO additive due to the additional fluorine.27 Fig. 7 shows LiF in all cells after formation, with the control cell having the most. After cycling, the control cell gains some LiF, the 2% VC cell has no visible LiF, and the 1% LiPO2F2 cell has the largest LiF peak. LiF peak intensities correlate well with the Li peak intensities in the "TM + Li" spectra. While the 2% VC cell lacks a clear LiF peak, the large P-F peak for this cell indicates that there has been LiPF6 degradation. The lack of a visible LiF peak in the cycled 2% VC cell suggests either that 2% VC suppresses LiF production in comparison with the other electrolytes tested, or that LiF is no longer present in the surface layer of the SEI.
The biggest differences in SEI composition between electrolyte additives appears to be in inorganic compounds such as fluorophosphates and LiF. The PxOy peak also shows differences between cycled cells with different electrolytes, and oligo-VC may be a factor in the SEI of cells containing VC additive. Figures 3d and 3f show significantly different positive electrode charge transfer impedance after cycling for control cells and 1% LiPO2F2 cells respectively. Figures 4d and 4f showed different activation energies for cycled positive electrode control cells (0.63 (0.02) eV) and 1% LiPO2F2 cells (0.55 (0.01) eV for both cycled cells). In contrast, XPS results in Fig. 7 showed small differences in the SEI composition on the NMC532 electrodes of these cells. Further research is required to determine the cause of the SEI differences. It should also be noted that XPS is a surface technique, and therefore the composition of the entire depth of the SEI is not captured.
Figure 8 shows the F 1 s, O 1 s, C 1 s, and P 2p XPS spectra for the graphite (AG) electrodes. Spectra from a fresh AG electrode are shown in the top row. The following rows contain spectra from AG electrodes extracted from the same formed and cycled cells shown in Fig. 7.

Figure 8. XPS data for graphite electrodes extracted from fresh, formed, and cycled pouch cells. Formed cells were formed to 4.2 V; cycled cells were cycled between 3.0 V and 4.2 V; all formed and cycled cells were disassembled at 3.8 V and contained control, control + 2% VC, or control + 1% LiPO2F2 electrolyte. F 1 s, O 1 s, C 1 s, and P 2p spectra are shown. The y-axis scales are equal for spectra of the same type (columns). Components are labeled based on BE and literature assignments.
Download figure:
Standard image High-resolution imageThe C 1 s spectrum for the fresh electrode shows a peak at 284.2 eV associated with graphite.9,10 After formation, the graphite is lithiated, shifting the peak to ∼282.5 eV.9,10 The lithiated graphite peak is shown in dark gray. In a similar manner to the lattice oxygen peak in NMC532 electrodes, the lithiated graphite peak is an indicator of SEI thickness. After formation, the 2% VC cell has the smallest lithiated graphite peak, suggesting that it also has the thickest SEI. This is in agreement with the work of Madec et al.10 and Qian et al.27 After cycling, the lithiated graphite peak is no longer observed for all electrolytes, indicating that the SEI is too thick for the photoelectrons to penetrate from below the SEI on the electrode. A minor increase in the C–O/C–H peak and a more significant decrease in the C–C peak is observed after cycling for all electrolytes. Again, peaks that may be associated with oligo-VC are shown in blue. In the C 1 s spectra, it is difficult to distinguish these peaks from C-F and C=O peaks. However, the additional peak in the O 1 s spectra at ∼534.5 eV is apparent for cells with 2% VC, suggesting the presence of oligo-VC in the SEI. The O 1 s spectra contain two peaks associated with carbonaceous species from the decomposition of solvents on the graphite electrode.10,29 In both control and 1% LiPO2F2 cells, the C-O peak increases significantly after cycling.
Fluorophosphates appear in all F 1 s and P 2p spectra after formation (purple). The cell with 2% VC initially has more P-F than control and 1% LFO cells, but the P-F peaks increase to roughly the same magnitude in all electrolyte systems after cycling. P-O peaks also begin with different intensities after formation with the 1% LiPO2F2 cell showing a significantly larger peak. P-O peaks also increase to roughly the same magnitude after cycling. Lastly, the LiF peak in the F 1 s spectra is of interest. After formation, LiF appears with different intensities following: 2% VC > control > 1% LiPO2F2. After ∼700 charge-discharge cycles, the peak intensities of LiF follow: 1% LiPO2F2 > control > 2% VC.
The differences in SEI composition on the graphite electrodes with different electrolyte additives after cycling include differences in: LiF content, C-O content, C-C content, and oligo-VC for the cell containing VC. Figure 3 showed that the 2% VC cell had the largest negative electrode Rct after cycling, while the control and 1% LiPO2F2 cells had similar, smaller negative electrode Rct. Qian et al. have suggested that inorganic compounds, such as LiF, create SEIs with lower impedance by lowering the energy barrier and favoring Li+ diffusion.27 Figure 8 shows higher LiF content in control and 1% LiPO2F2 negative electrode SEIs after cycling. Figure 4 also showed low Ea for control (0.48 (0.01) eV) and 1% LiPO2F2 cells (0.50 (0.01) eV) after cycling. Along with the small Rct measurements, this may support Qian et al.'s hypothesis.
Formed cells vs cycled cells to 4.4 V
Table IV shows the matrix of cells in this comparison. All cells were formed or cycled to 4.4 V and disassembled at 3.8 V. The number of cycles and capacity retention are indicated in the table. Cycled cells are labeled by approximate cycle number (∼300c, ∼400c, or ∼700c) in future figures. Nyquist plots for negative and positive symmetric cells and full coin cells at −10 °C, 10 °C, 30 °C and 40 °C are shown in Figs. S8–S22.
Table IV. Matrix of pouch cells formed and cycled to 4.4 V.
| Additive | Formed/Cycled | Formed/Cycled to (V) | Voltage at disassembly (V) | No. of cycles | Capacity retention (%) |
|---|---|---|---|---|---|
| Control | formed | 4.4 | 3.78 | — | — |
| cycled | 3.69 | 322 | 80.9 | ||
| 2% VC | formed | 3.79 | — | — | |
| cycled | 3.71 | 385 | 97.8 | ||
| 1% LFO | formed | 3.79 | — | — | |
| cycled | 3.74 | 384 | 98.2 | ||
| cycled | 3.78 | 678 | 98.6 |
Figure 9 shows the logarithm of Rct vs 1/T for all cells in this 4.4 V comparison. Ea values and errors are shown in each panel of Fig. 9. In contrast to the cells cycled to 4.2 V shown in Fig. 4, no significant changes to positive electrode Ea are seen for these 4.4 V cells with all electrolytes after cycling. However, changes are seen in negative electrode Ea values after cycling for all electrolyte types. For negative electrodes, Ea reduces from 0.62 (0.01) eV (after formation) to 0.50 (0.01) eV (after ∼300 cycles) in control cells; 0.65 (0.02) eV (after formation) to 0.52 (0.01) eV (after ∼400 cycles) in cells with 2% VC; and 0.55 (0.02) eV (after formation) to 0.44 (0.01) eV (averaged over both cycled cells) in cells with 1% LiPO2F2. These reductions in Ea after cycling are consistent with reductions in Rct after cycling in these cells, and the activation energy is lowest in cells with 1% LiPO2F2, supporting the improved transport qualities of SEIs containing LiPO2F2.
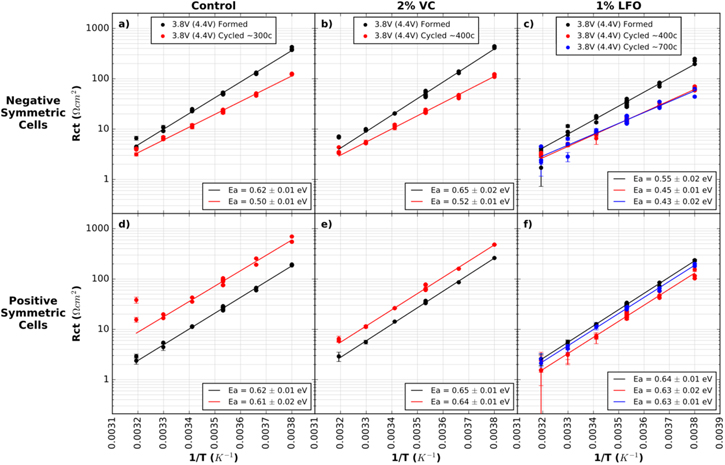
Figure 9. Rct plotted on a logarithmic scale vs the inverse of temperature for symmetric cells from formed and cycled pouch cells with 4.4 V UCV. (a) and (d) show cells with control electrolyte; (b) and (e) show cells with control + 2% VC electrolyte; (c) and (f) show cells with control + 1% LiPO2F2 electrolyte. (a)–(c) show (−/−) cells and (d)–(f) show (+/+) cells. Legends indicate the voltage at disassembly (always 3.8 V here), the UCV voltage in brackets (always 4.4 V here), and the approximate number of cycles done by the cell before disassembly. Duplicate and triplicate cell data is shown at each temperature, with additional points at 10 °C (0.0035 K−1) due to repeat tests at that temperature. The error bars shown are the statistical error from the fitting results, however the true error in the measurement is larger than this. Points at 40 °C (0.0032 K−1) were not used in the linear fit due to large errors in EIS fitting at high temperature.
Download figure:
Standard image High-resolution imageFigures 9d and 9e show a significant increase in Rct magnitude for the positive electrode after cycling in the cell with control and control + 2% VC electrolytes. However, Ea values do not differ significantly between formation and cycling. Averaged over all formed and cycled cells shown, the means and standard deviations for (+/+) cells are: 0.61 (0.01) eV for control cells, 0.65 (0.01) for control + 2% VC cells, and 0.63 (0.01) eV for control + 1% LiPO2F2 cells. There are only minor differences between values for all three electrolytes, suggesting similarities in Li+ transport through the positive electrode SEI for all three additives, despite very different Rct behavior.
Nyquist plots at 10 °C, Rcontact vs temperature, capacitance vs temperature, and characteristic frequency vs temperature plots can be seen in Figs. S4–S7 of the supplementary material. Figure S4 shows that negative electrode Rct decreased after cycling in all electrolyte systems. Positive electrode Rct increases significantly for control cells after cycling. Rct also increased for the positive electrode with control + 2% VC electrolyte. This is different than the 2% VC results for the 4.2 V cells, where Rct decreased after cycling. Ma et al. have observed higher impedance in full NMC111/graphite cells containing 2% VC additive cycled to 4.4 V, compared with cells cycled to 4.2 V.13 For cells with 1% LiPO2F2 additive, positive electrode Rct initially decreases after ∼400 cycles, and then increases after ∼700 cycles to almost the same magnitude as after formation.
Figure S5 shows that Rcontact for the negative electrode again did not show significant changes over cycling. However, Rcontact for the positive electrode did increase after cycling which will be discussed with Fig. 11 below.
Figure S6 shows consistent capacitance values across the evaluated temperature range (excluding high temperature data due to large errors in fitting). Again, positive electrode capacitance is an order of magnitude larger than negative electrode capacitance, suggesting a thinner positive electrode SEI. Panels (d) and (e) show slightly increased capacitance after cycling for positive electrode symmetric cells with control and control + 2% VC additives. This suggests somewhat thinner SEI layers after cycling, which contradicts the literature,9,10,28 and thus capacitance measurements may be an inaccurate indicator of SEI thickness in cases where the dielectric constant is unknown and could be changing with cycle number.
Summary of Rct and Rcontact over cycle life
Two figures are presented in this section to summarize Rct and Rcontact results for all cells in this study. Figures 10 and 11 show Rct vs cycle number and Rcontact vs cycle number respectively. Only 10 °C measurements are presented in these figures for simplicity. Duplicate and triplicate cells data is shown and repeat measurements at 10 °C are also included.
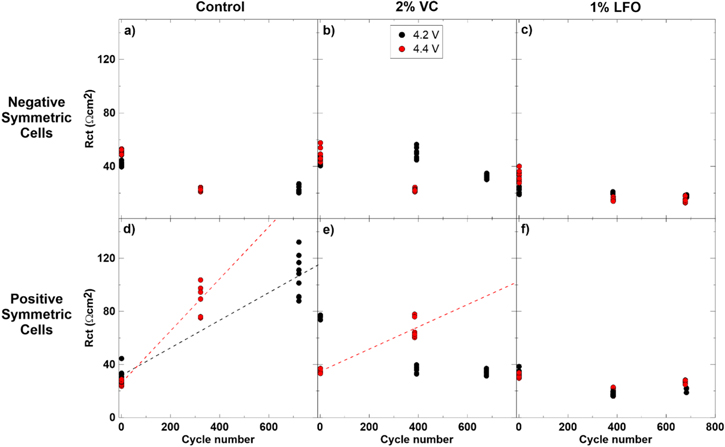
Figure 10. Rct measured at 10 °C vs cycle number for symmetric cells from formed and cycled pouch cells with 4.2 V and 4.4 V UCV. (a) and (d) show cells with control electrolyte; (b) and (e) show cells with control + 2% VC electrolyte; (c) and (f) show cells with control + 1% LiPO2F2 (called LFO in the legend) electrolyte. (a)–(c) show (−/−) cells and (d)–(f) show (+/+) cells. All data from repeat measurements at 10 °C are shown. Plots (d) and (e) contain dashed lines which were calculated based on the averages of the data they are connecting. Lines were extrapolated to future cycle numbers.
Download figure:
Standard image High-resolution image
Figure 11. Rcontact measured at 10 °C vs cycle number for symmetric cells from formed and cycled pouch cells with 4.2 V and 4.4 V UCV. (a) and (d) show cells with control electrolyte; (b) and (e) show cells with control + 2% VC electrolyte; (c) and (f) show cells with control + 1% LiPO2F2 (called LFO in the legend) electrolyte. (a)–(c) show (−/−) cells and (d)–(f) show (+/+) cells. All data from repeat measurements at 10 °C are shown. Plots (d) and (e) contain dashed lines which were calculated based on the averages of the data they are connecting. Lines were extrapolated to future cycle numbers.
Download figure:
Standard image High-resolution image
Figures 10a–10c show generally stable or decreasing negative electrode Rct values over cycling for 4.2 V and 4.4 V cells with all additives. Figure 10d shows a significant increase in (+/+) Rct after cycling in both the 4.2 V and 4.4 V cells with control electrolyte. A larger increase in impedance is observed for the cell cycled to 4.4 V, and dashed lines are shown in this plot as a guide to the eye. Figure 10e shows that (+/+) Rct decreases with cycling for the 4.2 V cells with 2% VC but increases with cycling for the 4.4 V cells. This agrees with the higher impedance growth observed by Ma et al.13 in cells containing 2% VC electrolyte additive tested above 4.3 V. Figure 10f shows stable or decreased (+/+) Rct throughout cycling for the cells with 1% LiPO2F2. This data suggests that cells with 2% VC cycled to 4.2 V and cells with 1% LiPO2F2 cycled up to 4.4 V suppress impedance growth over cycle life. This is consistent with the good cyclability of these cells, shown in Fig. 2 above.
Figures 11a–11c show no significant changes in negative electrode Rcontact over cycle life for all electrolyte mixtures. Figure 11d shows increases in positive electrode Rcontact after cycling for both the 4.2 V and 4.4 V cells containing control electrolyte. The increase is more sizeable for the 4.4 V cell after cycling. Landesfeind et al.53 have shown increasing contact impedance with cycling in LiNi0.5Mn1.5O4 cells (cycled to 4.9 V at 40 °C). The authors suggest that loss of contact between active cathode material and the current collector occurs under aggressive cycling conditions in these cells.53 Atebamba et al. also suggest that volume change during repeated Li+ intercalation may affect the distribution of active particles and conductive additives.54 Perhaps this may lead to the increased contact impedance after aggressive cycling observed here.
Figures 11e and f also show an increase in positive electrode Rcontact over cycle life for the 4.4 V 2% VC and 1% LiPO2F2 cells. The trend is not the same for the 4.2 V 2% VC and 1% LiPO2F2 cells which show an initial increase followed by a decrease in Rcontact over cycle life. The reason for this behavior is unclear.
Conclusions
This paper has presented comparisons of cells formed and cycled to 4.2 V and cells formed and cycled to 4.4 V. Cells with control, control + 2% VC, and control + 1% LiPO2F2 electrolytes were studied in both comparisons. Temperature dependent EIS was performed on negative and positive symmetric cells and impedance contributions from each electrode were studied separately. XPS data was collected for negative and positive electrode samples of cells cycled to 4.2 V to study the surface chemistry of the SEI. Some general conclusions may be made based on the data presented:
- 1.Rcontact did not see any significant changes over cycling for negative electrodes but appeared to increase slightly over cycling for positive electrodes. This may be due to loss of electrical contact between positive electrode active particles and the current collector during aggressive cycling.
- 2.Rct decreased or remained constant after cycling for (−/−) cells with all electrolyte systems, while Rct in (+/+) cells showed different behavior based on the electrolyte additive. Impedance growth was most significant in cells with control electrolyte, which correlated well with capacity fade seen in cycling data.
- 3.Rct as a function of temperature followed the Arrhenius relationship in all cases. Activation energies were calculated. After cycling, Ea either remained constant or decreased, indicating similar or better transport properties. Ea for the negative electrode decreased for all electrolytes in cells cycled to 4.4 V compared to formed cells. Ea for the positive electrode after cycling to 4.4 V did not differ from the positive electrode Ea after formation. Compared to cells after formation, Ea for the negative electrode decreased for cells cycled to 4.2 V containing control and control + 2% VC electrolyte. Negative electrode Ea for 1% LiPO2F2 cells cycled to 4.2 V remained unchanged compared to formed cells. Compared to formed cells, Ea for the positive electrode from cells cycled to 4.2 V remained constant for the control electrolyte and decreased for cells with 2% VC or 1% LiPO2F2 additives. LiPO2F2-containing cells had the lowest negative electrode Ea for all tests.
- 4.XPS showed increasing SEI thickness for both the positive and negative electrodes after cycling. The composition of the SEI had slight variations based on electrolyte additive. The relationship between SEI composition, thickness, Ea, and Rct appears to be quite complicated and requires further study.
Acknowledgments
This work was funded under the auspices of the NSERC/Tesla Canada Industrial Research Chair program.