Abstract
Natural graphite (NG) negative electrode materials can perform poorly compared to synthetic, or artificial, graphite (AG) negative electrodes in certain lithium ion cells. LiNi0.5Mn0.3Co0.2O2(NMC532)/(AG or NG) pouch cells were tested with various loadings of an electrolyte additive blend to study the effect of the graphite type as well as the formed solid electrolyte interphase (SEI). Cells underwent testing using ultra-high precision coulometry, isothermal microcalorimetry, in-situ pressure measurements, long term cycling and in-situ gas measurements. In short term experiments NMC532/AG and NMC532/NG cells showed similar coulombic efficiencies, parasitic heat flows, and gas production with large electrolyte additive loadings, but NG cells showed worse capacity retention in long-term tests. With low additive loadings NMC532/NG cells showed lower coulombic efficiency, higher capacity fade, more parasitic heat flow, and more gas production. In-situ cell stack pressure measurements showed that NMC532/NG cells irreversibly expanded during cycling while NMC532/AG cells did not. Although these results lead one to propose a simple model for the poor performance of NMC532/NG cells, NMC622/NG and NMC622/AG cells showed very different behavior in long term tests suggesting that positive/negative interactions play a strong role in governing the behavior of graphites in Li-ion cells.
Export citation and abstract BibTeX RIS

This is an open access article distributed under the terms of the Creative Commons Attribution 4.0 License (CC BY, http://creativecommons.org/licenses/by/4.0/), which permits unrestricted reuse of the work in any medium, provided the original work is properly cited.
Next generation lithium ion batteries require higher energy density, longer life, better safety, and lower cost to fulfill the ever-increasing demand for electric vehicles and renewable grid-level energy storage. By increasing the energy density of cells while keeping lifetime consistent, one can in turn decrease the cost of Li-ion cells. Much work has been focused on increasing the upper cutoff voltage of cells in order to achieve this increase in energy density. However, increasing the upper cutoff potential increases the rates of unwanted reactions in cells which can compromise lifetime.1–3 These unwanted reactions are commonly termed parasitic reactions.
Another way of addressing the issue of cost is to use higher energy density materials, such as natural graphite (NG) as a negative electrode material instead of synthesized graphite, here called artificial graphite (AG). NG is known to perform poorly in some cells, which has in the past been attributed to surface exfoliation and cracking of particles.4–7 Park et al. found spherical natural graphite showed signs of particle swelling and cracking caused by mechanical strain during cycling, which could be suppressed using a carbon coating process.5 Carbon coatings on natural graphite negative electrodes have been studied in the past to avoid exfoliation from propylene carbonate-containing electrolytes, but these coatings may decrease the energy density.4,6 AG performance reported in the literature appears to outperform natural graphite, however, few direct comparisons of artificial and natural graphite exist in the literature. Lee et al.8 found that plasma treated AG performed better in long term cycling and rate testing, and had a similar irreversible capacity compared to the treated NG, while the NG material had a higher specific capacity. The purpose of this work is to elucidate the differences in electrochemical performance of artificial and natural graphite using non-destructive techniques, in identical electrochemical systems. To mitigate the effects of other cell components on electrochemical performance, a single-crystal LiNi0.5Mn0.3Co0.2O2 positive electrode material was used in machine-made pouch cells. Single-crystal NMC was shown by Li et al. to have superior electrochemical performance and fewer parasitic reactions than other common NMC grades, and was therefore used to proportionally increase the effect of graphite type on cell performance.9 The properties of the AG and NG graphites used in this work are summarized in Table I. Figures 1a and 1b show SEM images of the AG electrode and Figures 1c and 1d show the NG electrode. The imaged electrodes were taken from disassembled cells before cycling. Cracked particles on the surface are due to the electrode calendaring process, and are also present in cycled cells.
Table I. Physical properties of AG and NG used in this study (provided by suppliers).
| Graphite Type | D50 (μm) | Tap Density (g/cm3) | Specific Surface Area (m2/g) | Press Density (g/cm3) | Reversible capacity (mAh/g) | First Cycle Efficiency (%) | Pr* | Pt^ |
|---|---|---|---|---|---|---|---|---|
| AG | 16 (3) | 1.1 | 1.2 (5) | N/A | ∼345 | ∼92.1 | 0.13 | 0.02 |
| NG | 18 (2) | 1.1 (1) | 3.8 (8) | 1.80 (5) | ∼360 | ∼94 | 0.06 | 0.07 |
*Probability of random stacking. ^Probability of 3R (rhombohedral) stacking.

Figure 1. SEM images of a,b) artificial and c,d) natural graphite electrodes.
A well-known ternary electrolyte additive blend, here called PES211 (2% wt prop-1-ene-1,3-sultone (PES), 1% wt 1,3,2-dioxathiolane-2,2-dioxide (DTD) and 1% wt tris(trimethylsilyl)phosphite (TTSPi)) in 1.09 molal LiPF6 ethylene carbonate (EC):ethyl methyl carbonate (EMC) (3:7 wt) was used in different ratios to provide different levels of solid electrolyte interphase (SEI) protection (i.e. x = 0.5 PES211 would use half of the weight percent of additive loading: 1% PES, 0.5% DTD, 0.5% TTSPi). Li et al. recently provided an in-depth study on the electrochemical properties of the materials studied in this work and found that AG containing cells performed better than NG cells in long term cycling experiments from 3.0 V to 4.2 V and 4.3 V at 20°C and 40°C, and typically showed better performance in ultra-high precision coulometry (UHPC) testing.10 However, UHPC and cycling experiments alone were not sufficient to explain the differences in performance between AG and NG cells. The current work expands on Li's work, providing in-situ measurements of parasitic heat flow using isothermal microcalorimetry, as well as in-situ gas and in-situ stack pressure measurements of pouch cells.
Experimental
Pouch cells
Dry (no electrolyte), sealed single-crystal NMC532/natural and artificial graphite pouch cells were obtained from Li-Fun Technology (Xinma Industry Zone, Golden Dragon Road, Tianyuan District, Zhuzhou City, Hunan Province, PRC, 412000). Details of the electrochemical performance of single crystal NMC532 can be found in Reference 9. The properties of the AG and NG graphites used in this work are summarized in Table I. Additional cells using Al2O3-coated NMC622 (called NMC622A here) and proprietary coated NMC622 (called NMC622B here) positive electrodes (Umicore, Cheonan, Korea) and the same NG or AG negative electrodes were also used in this work. The NMC622A is described in detail in Reference 11. The base electrolyte used in the NMC532 cells was 1.09 molal LiPF6 (BASF, purity 99.94%, water content 14 ppm) in EC:EMC (3:7 wt). Varying amounts of a ternary additive blend called xPES211 were used, where x represents a ratio of the full additive loading of 2% wt prop-1-ene-1,3-sultone (PES) (Lianchuang Medicinal Chemistry Co., 98.20%), 2% wt 1,3,2-dioxathiolane-2,2-dioxide (DTD) (Sigma Aldrich, 98%), and 1% wt tris(trimethylsilyl)phosphite (TTSPi) (TCI America, >95%). For example, an electrolyte called 0.5PES211 would contain 1% PES, 0.5% DTD, and 0.5% TTSPi. Values of x = 0.25, 0.5 and 1.0 were used in this work. Shorthand cell names are used throughout the rest of this work for the NMC532 cells, and refer to the additive loading and graphite type. For example, 0.5 NG corresponds to 1% PES, 0.5% DTD, and 0.5% TTSPi in an NMC532/natural graphite cell. The NMC622/AG and NMC622/NG cells used 1.0PES211 electrolyte.
Before filling, cells were cut beneath the heat seal and placed directly into a vacuum oven and heated under vacuum for 14 hours at 100°C to remove residual moisture. The cells were then transferred into an argon-filled glove box without exposure to air. All cells used in this study underwent the following formation procedure: All cells were filled with 0.97 g of electrolyte. After filling, cells were sealed with a compact vacuum sealer (MSK-115A, MTI Corp.) for 5 seconds at 165°C, and −90 kPa. Cells were then clamped between rubber spacers to displace any gas formed in the electrode stack during formation and held at 1.5 V for 24 hours at room temperature to ensure proper wetting. Cells were then placed on a Maccor 4000 series cycler (Maccor Inc., Tulsa, OK, USA) and charged at 10 mA (∼C/20) to 4.2 V (4.3 V for in-situ gas cells), held at top of charge for one hour before being discharged to 3.8 V and held for one hour. Cells were then transferred back into the argon glove box, cut open and re-sealed using the same vacuum sealing conditions to release gas produced during formation.
Isothermal microcalorimetry
After formation, cells for isothermal microcalorimetry measurements were inserted into a TAM III microcalorimeter at 40 C (TA Instruments: stability ±0.0001°C, accuracy ±1 μW, precision ±1 nW) and connected to a Maccor 4000 series cycler. The baseline drift over the course of the experiments did not exceed ±0.5 μW. All specifications and information regarding microcalorimetry calibration, cell connections, and operation procedures can be found in previous literature.12,13 Cells were cycled four times using a C/20 rate between 3.0 V and 4.2 V to ensure a well formed, stable SEI on the negative electrode and were then cycled three times between 3.65 V and 3.85 V to investigate the effect of low voltage parasitic reactions at the negative electrode, to avoid large amounts of parasitic reactions associated with a highly delithiated positive electrode. Cells were then cycled between 4.0 V and different upper cutoff limits: 4.2 V, 4.3 V (twice), 4.4 V (twice) and again 4.2 V (twice) at 1 mA to investigate the performance and the parasitic heat flow in different high voltage ranges. A description and references of the analysis techniques is provided in the results and discussions section.
Ultra high precision cycling (UHPC)
UHPC cycling was performed between 3.0 V and 4.1V, 4.2 V, 4.3 V, and 4.4 V at C/20, 40.0 ± 0.1°C for 16 cycles. Information regarding UHPC measurements can be found in the literature.3,14
In-situ gas measurements
In-situ gas measurements were made using the apparatus and procedure described by Aiken et al.15 Cells were suspended in silicone vacuum pump oil and the change in weight was measured using sensitive strain gauges during electrochemical tests in a 40.0 ± 0.1°C temperature controlled box.
Scanning electron microscopy
Scanning Electron Microscopy (SEM) was performed with a NanoScience Phenom Pro G2 Desktop SEM. Uncycled dry NMC532/AG and NMC532/NG pouch cells were disassembled and small pieces of the negative electrodes were cut out and mounted on double-sided carbon tape and stuck to the SEM sample stubs. These were the same negative electrodes used in the NMC622 cells.
Pressure measurements
In-situ stack pressure measurements were made in the apparatus described in Reference 16. Pouch cells were volumetrically constrained in an aluminum enclosure such that any volume expansion of the cell would exert a force on the enclosure. The force was measured with subminiature load cells (LCKD - OMEGA Engineering), with capacities of 100 or 250 lbs (445 and 1112 N), connected to DP25B-S-A (OMEGA Engineering) strain gauge panel meters. The load cells were fastened in the enclosure with the pouch cell, separated by a force distributing plate. The measured force was converted to Pa using the pouch cell area of ca.6.0 cm2. For in-situ measurements, the pouch cells were connected to an E-One Moli Energy Canada battery testing system. The analog 0–10 V output of the strain gauge panel meter was connected to a "slave channel", allowing for simultaneous voltage and pressure measurements. These measurements were performed in a 40.0 ± 0.1°C temperature box.
Table II. dV/dQ fitting results of AG and NG cells.
| Graphite | Cycle number | Normalized Capacity | Negative Slippage (mAh) | Positive Slippage (mAh) | Negative Mass (g) | Positive Mass (g) | Total Slippage (mAh) |
|---|---|---|---|---|---|---|---|
| AG | 2 | 1.00 | −4.09997 | 0.25996 | 0.88 | 1.154 | 13.45 |
| 559 | 0.946 | −3.3 | −13.39108 | 0.8863 | 1.158 | ||
| NG | 2 | 1.00 | −3.62 | 0.08 | 0.886 | 1.14 | 31.33 |
| 587 | 0.866 | −1.8 | −29.43404 | 0.894 | 1.13971 |
Total Slippage = (pos. at cycle 2) – (pos. at end) + (neg. at end) – (neg. at cycle 2).
Results and Discussion
Figure 2 provides the summarized details of 16 UHPC cycles performed at 40C ± 0.1°C at a C/20 rate from 3.0 V to 4.1 V, 4.2 V, 4.3 V and 4.4 V. Each metric is shown as the linearly interpolated value at the 16th cycle using results of the previous five cycles, plotted as a function of upper cutoff voltage. A recent in-depth study of the electrochemical performance of xPES211 cells can be found in the literature.10 Figures 2a, 2c, and 2e show the fractional fade per hour, fractional charge slippage per hour, and coulombic inefficiency (CIE) per hour, respectively, for 1.0 AG (black), 0.5 AG (red) and 0.25 AG (orange). Figures 2b, 2d and 2f show the UHPC metrics for 1.0 NG (blue), 0.5 NG (magenta) and 0.25 NG (light blue) cells. This color scheme is consistent throughout this work. In each plot for NG cells, 1.0 NG and 0.5 NG cells use the same y-axis as AG cells, and the 0.25 NG cells use the light blue y-axis on the right. Figures 2a and 2b show 1.0 AG and 1.0 NG cells have comparable charge end point capacity slippage, which may suggest the magnitude of parasitic reactions at the positive electrode in these cells is similar. In Figure 2c the capacity fade in NG cells is always larger than in AG cells. Table I shows that the surface area of NG is larger than AG, which could suggest more surface reactions could occur on NG due to a less protective SEI, leading to this higher fade, which would make the comparison between these graphite types difficult. However, the surface area was obtained using Brunauer–Emmett–Teller (BET) analysis, and may not be a good indication of the electrochemically active surface area. This is because a nitrogen molecule, used in the BET method, is much smaller in size than electrolyte solvent and additive molecules used in Li-ion cells. To be convinced the additive loadings were appropriate to compare, Figure 3 shows the normalized differential capacity (dQ/dV) versus voltage during cell formation for 0.25, 0.5, and 1.0 AG and NG cells. In each case, the additive (2.5 V) and solvent (2.8 V–3.0 V) reduction peaks are very similar between cells with the same additive loading, and the NG solvent reduction peaks even tend to be smaller than in AG. This suggests that regardless of the BET surface area, the electrochemically active surface area between the graphite samples is virtually the same.
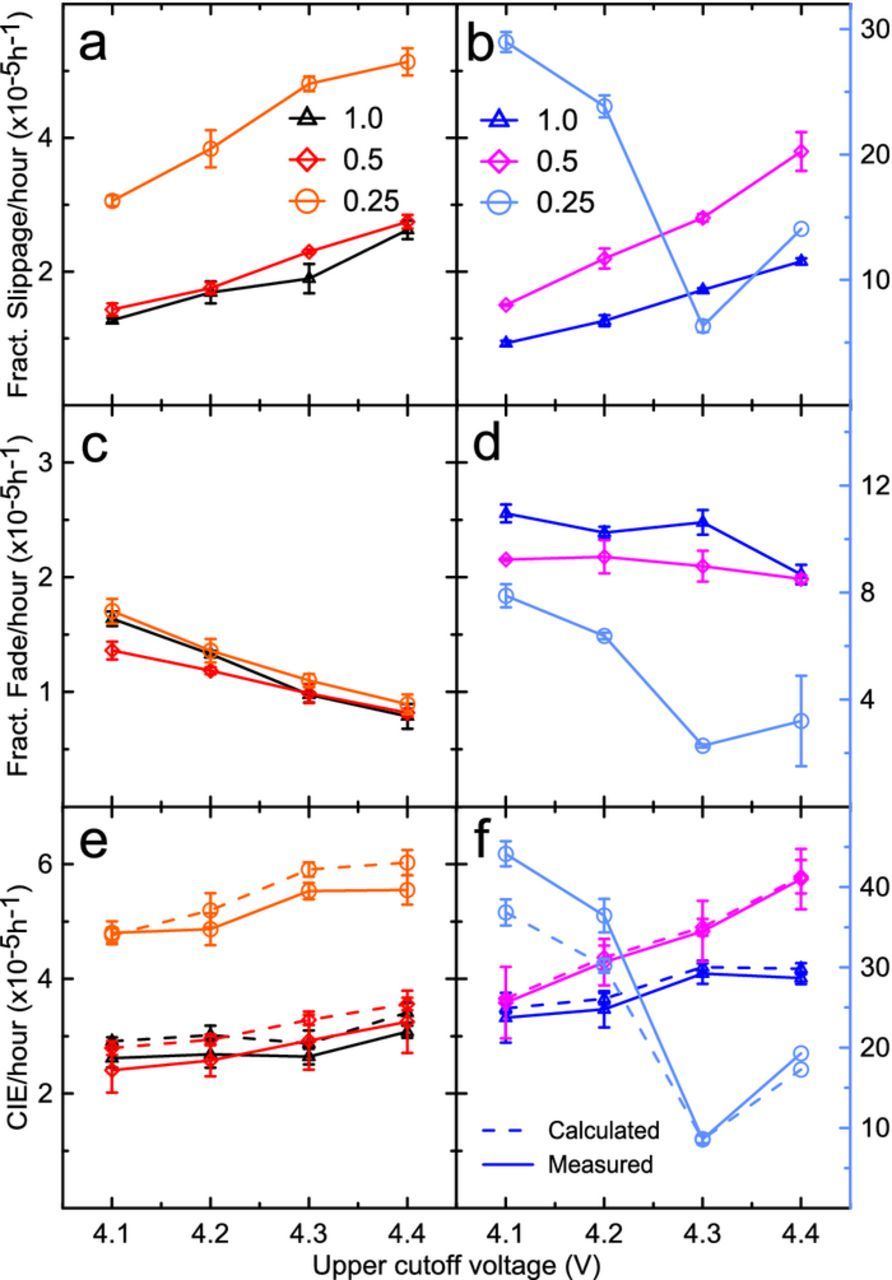
Figure 2. UHPC results of artificial graphite cells (left column) and natural graphite (right columns – only 0.25 NG is represented on the right y-axis): a) Fractional charge end point slippage per hour, b) fractional discharge capacity fade per hour, and c) coulombic inefficiency per hour from cycling between 3.0 V and 4.1 V, 4.2 V, 4.3 V, and 4.4 V. Points represent the value at the 16th cycle (slippage and fade) and the projected 16th cycle value based on a linear fit of the last 5 cycles (CIE), plotted as a function of upper cutoff voltage. Calculated CIE is shown as a dotted line and represents the sum of the fractional slippage and fade results.
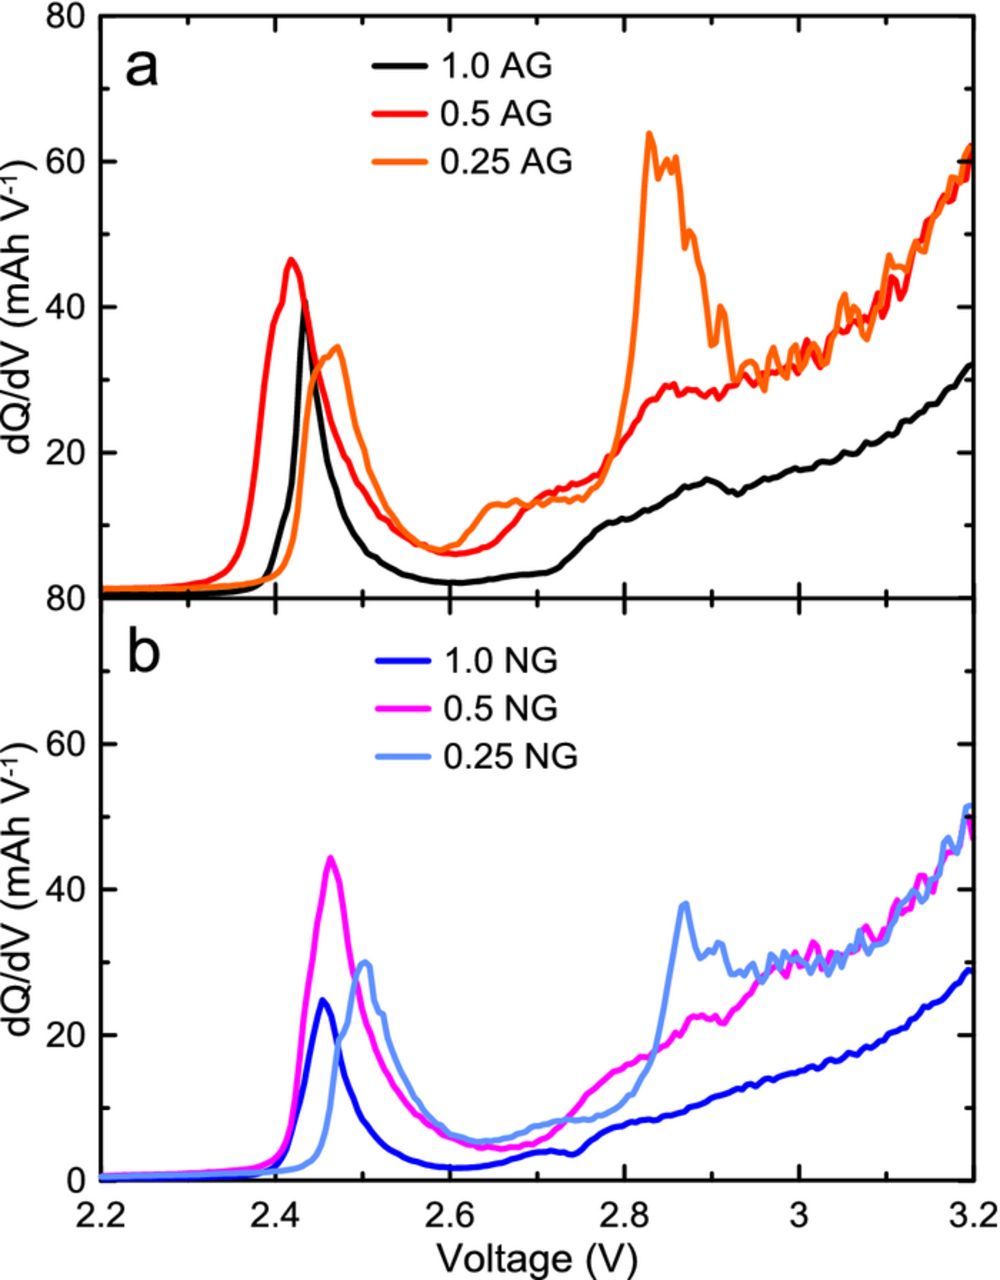
Figure 3. Differential capacity dQ/dV plotted against voltage for a) AG cells and b) NG cells.
In Figure 2, as the additive loading is decreased to 0.5, NG cells tend to have corresponding increase in charge end point capacity slippage, however, both AG and NG see relatively little change in fade. When the additive loading is further decreased to 0.25, fade more than doubles in NG cells and stays about the same in AG cells. At the same time, charge end point capacity slippage increases in AG cells while increasing by an order of magnitude in NG cells. In all cells other than 0.25 NG cells the slippage and fade increased with upper cutoff voltage. At 4.3 V, 0.25 NG cells showed a dramatic decrease in slippage and fade, however, not enough to remain competitive with 0.5 and 1.0 loading cells. This curious behavior may be due to a large onset of reactions >4.2 V, such as oxygen evolution from the NMC532 surface as recently reported by Xiong et al.17 and by Jung et al.18 which could result in a decent SEI layer. This is purely speculation, but is an interesting observation for future studies. Due to the slightly higher fade in NG cells and the larger effect of decreased additive loading on NG cells, the CIE in NG cells was higher at all additive loadings and under all cycling conditions. A possible explanation for the observed performance may reside in the structural properties of the graphite types.
The typically low Pr-value (the probability of random stacking between layers of graphite, or turbostratic misalignment) of natural graphite may suggest that there is less "pinning" between adjacent graphene layers and that more local exfoliation occurs during lithiation/delithiation, creating more surface to passivate and more electrolyte reduction products. Electrolyte reduction products such as lithium alkoxides can migrate to the positive electrode and be oxidized there creating charge end point capacity slippage in UHPC experiments. Low charge end point capacity slippage in 1.0 NG UHPC results could be explained by few parasitic reactions at the surface of graphite particles with a protective SEI, regardless of the possible internal particle strain and or expansion. When the additive content was decreased, the SEI layer was less protective and mechanical strain or expansion may have weakened the SEI, exposing new graphite surface where solvent was reduced to create new SEI and other reactants. Both 1.0 AG and 0.5 AG cells performed similarly in UHPC tests, suggesting a more stable SEI and a graphite structure less likely to exfoliate, probably because of the larger Pr-value of AG compared to NG. Following these assumptions, the large increase in slippage and fade in 0.25 NG cells may originate from continual formation of unstable SEI and associated reduction products, causing continual loss of lithium inventory resulting in significant capacity loss. The migration of reduction products like alkoxides to the positive electrode increases the charge end point capacity slippage. The increase in charge end point capacity slippage for both the 0.25 AG and 0.25 NG cells apparently indicates an insufficient amount of additive in order to fully passivate the graphite electrodes. This is also observed in Figure 3, where solvent reduction occurs for both 0.25 AG and 0.25 NG.
In order to probe the reasons for differing behavior of AG and NG cells in Figure 2, techniques which decouple the unwanted parasitic reactions occurring in cells from the electrochemical measurements were necessary. Isothermal microcalorimetry offers a unique method to observe unwanted reactions in cells by measuring the parasitic heat flow of a cell in operation. In addition, in-situ stack pressure and gas measurements can be used to infer the cell volume, separating the volume expansion components due to gas production and material expansion. Each of these techniques is in-situ and non-destructive, meaning experiments may be done using real cells under normal testing conditions to measure the same processes happening during electrochemical measurements.
Isothermal microcalorimetry has proven to be a useful tool in understanding the voltage and time dependence of parasitic reactions in high voltage lithium ion pouch cells. Past works by Downie et al. and Glazier et al. have shown that the extracted parasitic heat flow of pouch cells is a reliable way of predicting long-term cell performance when optimizing electrolyte solvents and additives.12,19–21 When current is applied to a cell during charge and discharge, the heat flow is given by22,23
![Equation ([1])](https://content.cld.iop.org/journals/1945-7111/164/14/A3545/revision1/d0001.gif)
where I is the applied current, η is the cell overpotential, e is the electron charge, T is the temperature, s+ and s- are the positive and negative electrode entropies respectively, x is the stoichiometric content of lithium in the electrode materials and  is the parasitic heat flow. Figure 4a demonstrates the total heat flow for a 1.0 AG cell cycled at a C/20 rate between 3.0 and 4.2 V. The entropic heat flow term is proportional to the current and is reversible during charge and discharge. By cycling at a low rate, the overpotential and entropic components of heat flow can be minimized and the parasitic heat flow can be extracted with higher accuracy. The parasitic heat flow can be calculated by exploiting the reversible nature of entropic heat flow as a function of voltage during charge and discharge, and is shown in Figure 4b. The heat flows during the charge and discharge segments at 1 mA (∼C/200) were averaged and the average overpotential term is calculated from electrochemical measurements and subtracted to obtain the average parasitic heat flow as a function of cycle voltage. This method is discussed in detail by Glazier et al.24 Since entropic heat flow is not exactly matched during charge and discharge as a function of voltage, this technique is more accurate when cells are charged and discharged over two-phase graphite voltage curve plateaus, where entropic heat flow changes minimally, as seen in Figure 4a between ∼3.6 V and 3.9 V (stage 2L-stage 2) and >4.0 V (stage 2-stage 1). This averaging method over large voltage ranges was also discussed by Krause et al. and provided accurate results even at higher cycling rates where the entropic heat flow voltage misalignment can be larger.25
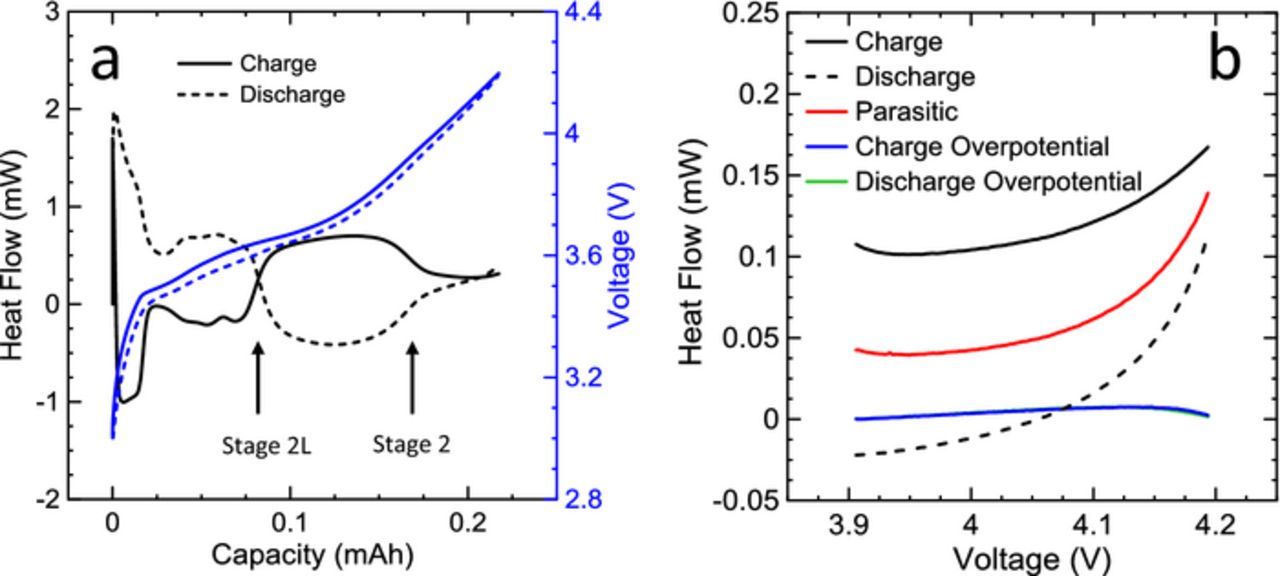
Figure 4. a) Total measured heat flow (black) and voltage (blue) vs capacity of an NMC532/AG cell charged (solid) and discharged (dashed) at a C/20 rate in the microcalorimeter. Graphite staging transitions are shown to illustrate the origin of entropic heat flow features. b) An example of the parasitic heat flow extraction method during a 1 mA (C/200) cycle between 3.9 V and 4.2 V: measured heat flow during charge and discharge are averaged and the average charge and discharge overpotential heat flow (overlapping) is subtracted, yielding the extracted parasitic heat flow (red).
The extracted parasitic heat flows from three consecutive low voltage cycles (3.65 V to 3.85 V) at 1 mA are shown in Figure 5. This low potential range was selected to try to minimize effects of electrolyte oxidation at the positive electrode and only probe reactions occurring at the negative side. It must be stressed, however, that species created by reduction reactions at the negative electrode could migrate to the positive and still be oxidized at 3.65 V. Results for pair cells are not shown but are nearly identical in every case. A summary image later in this work (Figure 7) shows the differences between pair cell results. 1.0 AG, 1.0 NG and 0.5 AG cells yielded nearly identical heat flows through the voltage range in all three cycles, except between 3.8 V and 3.85 V, where 1.0 NG cells have slightly higher parasitic heat flow. 0.25 AG cells showed slightly higher parasitic heat flow throughout the voltage range in all cycles. However, the 0.25 NG cells had much higher parasitic heat flow than 0.25 AG: over five times higher at 3.65 V and three times as high at 3.85 V. This initial rise in parasitic heat flow likely originated immediately after formation during the four initial precycles to 4.2 V. The similar parasitic levels between 1.0 AG and 1.0 NG suggest the full additive loading was sufficient to provide an effective SEI on both negative electrodes. 0.25 AG cells show only a small increase in parasitic heat flow over 1.0 and 0.5 AG, while much higher parasitic heat flow in 0.25 NG indicates a large rate of parasitic reactions.
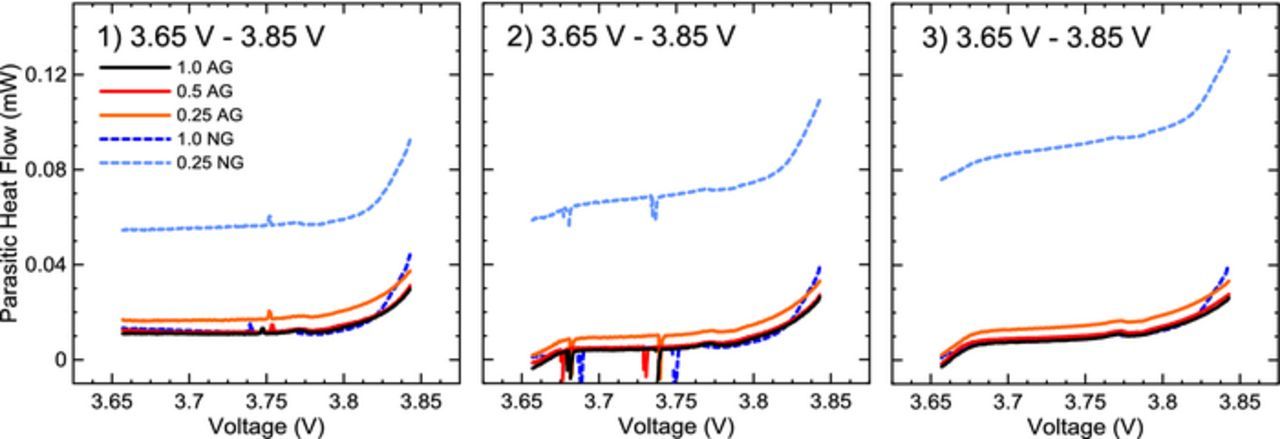
Figure 5. Extracted parasitic heat flow of each cell and electrolyte type during 3 cycles between 3.65 V and 3.85 V. Noise seen during the first and second cycles were due to power interruptions. Numbers in each panel correspond to the 1 mA cycle number in the microcalorimetry protocol.
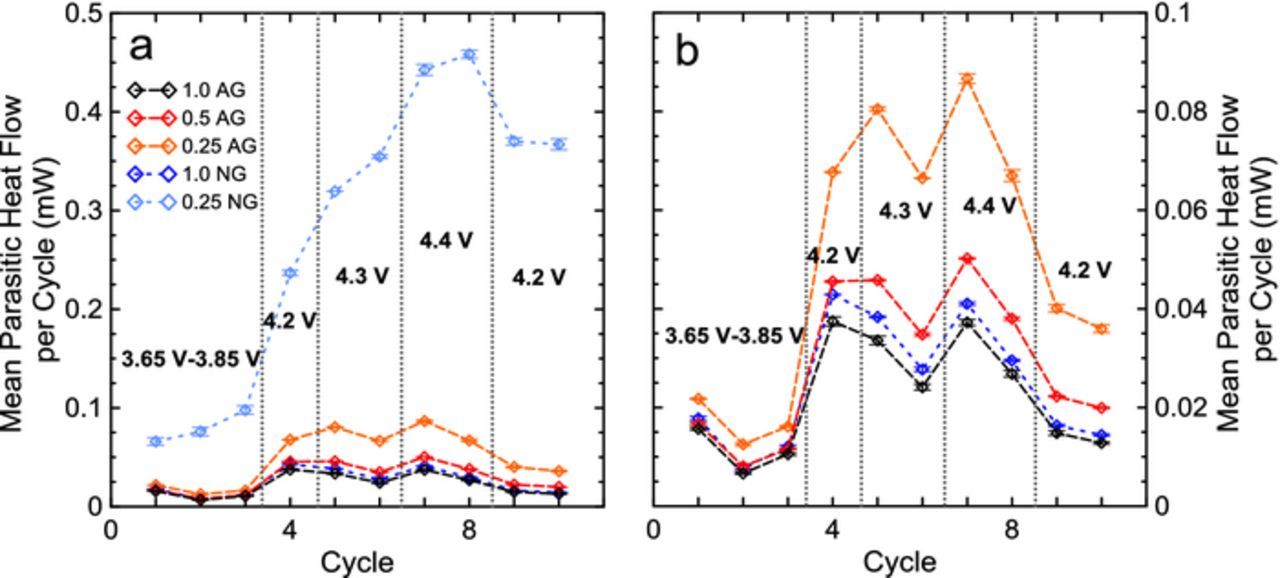
Figure 7. Summary of all microcalorimetry cycles. The mean parasitic heat flow over each cycle is shown for all cells in a), and b) shows a zoomed in view of cells excluding the 0.25 NG cells.
Parasitic heat flows measured during high voltage cycles between 4.0 V and 4.3 V (two cycles) and 4.0 and 4.4 V (two cycles) are shown in Figure 6. Numerical labels in each panel indicate the 1 mA cycle number, i.e. 4.3 V occurred before 4.4 V cycles. At high voltage, the effects of additive loadings did not change significantly from low voltage results suggesting that processes initiated at the negative electrode are being probed. 1.0 AG and 1.0 NG cells still show equivalent parasitic heat flows, which suggests the oxidized products from high voltage reactions at the positive electrode did not have different effects on the two negative electrode materials if a sufficient SEI was present. As the additive loading was decreased, AG cells showed a gradual increase in parasitic heat flow, indicating either more oxidation products were reducing at the less protected negative electrode, more reduction products from the negative were oxidizing at the positive or that the lower additive loading prevented the growth of a protective positive electrode SEI protecting the delithiated positive electrode-electrolyte interface at high voltage. Either option could explain the difference in parasitic heat flow of 1.0 AG and 0.5 AG when cells were exposed to high voltage. The 0.25 NG cells were not plotted in Figure 6 as to appropriately show differences between the AG cells and 1.0 NG cells. The 0.25 NG cells contained parasitic heat flow an order of magnitude larger than that of the 1.0 AG cells, and are shown in a summary in Figure 7. In Figure 7, the heat flow is integrated over the entire voltage range for each cell and averaged to give the mean heat flow per cycle. Figure 7a shows the summarized results including the 0.25 NG cells and Figure 7b shows the results excluding the 0.25 NG cells to compare the results clearly. Points in Figure 7 indicate the average between two pair cells and error bars show the range between pair cells. 0.25NG cells continued to deviate and increase in heat flow from other cells from the low voltage cycling, increasing significantly at high voltage. While all AG cells and 1.0 NG cells decreased in parasitic heat flow during the second cycle to high voltages, 0.25 NG increased, indicating a runaway-like, or irreversible process. Due to the increase in parasitic heat flow even at low voltages and the large deviation from the performance of 0.25 AG cells, these parasitic reactions/processes are attributed to originating at the negative electrode.
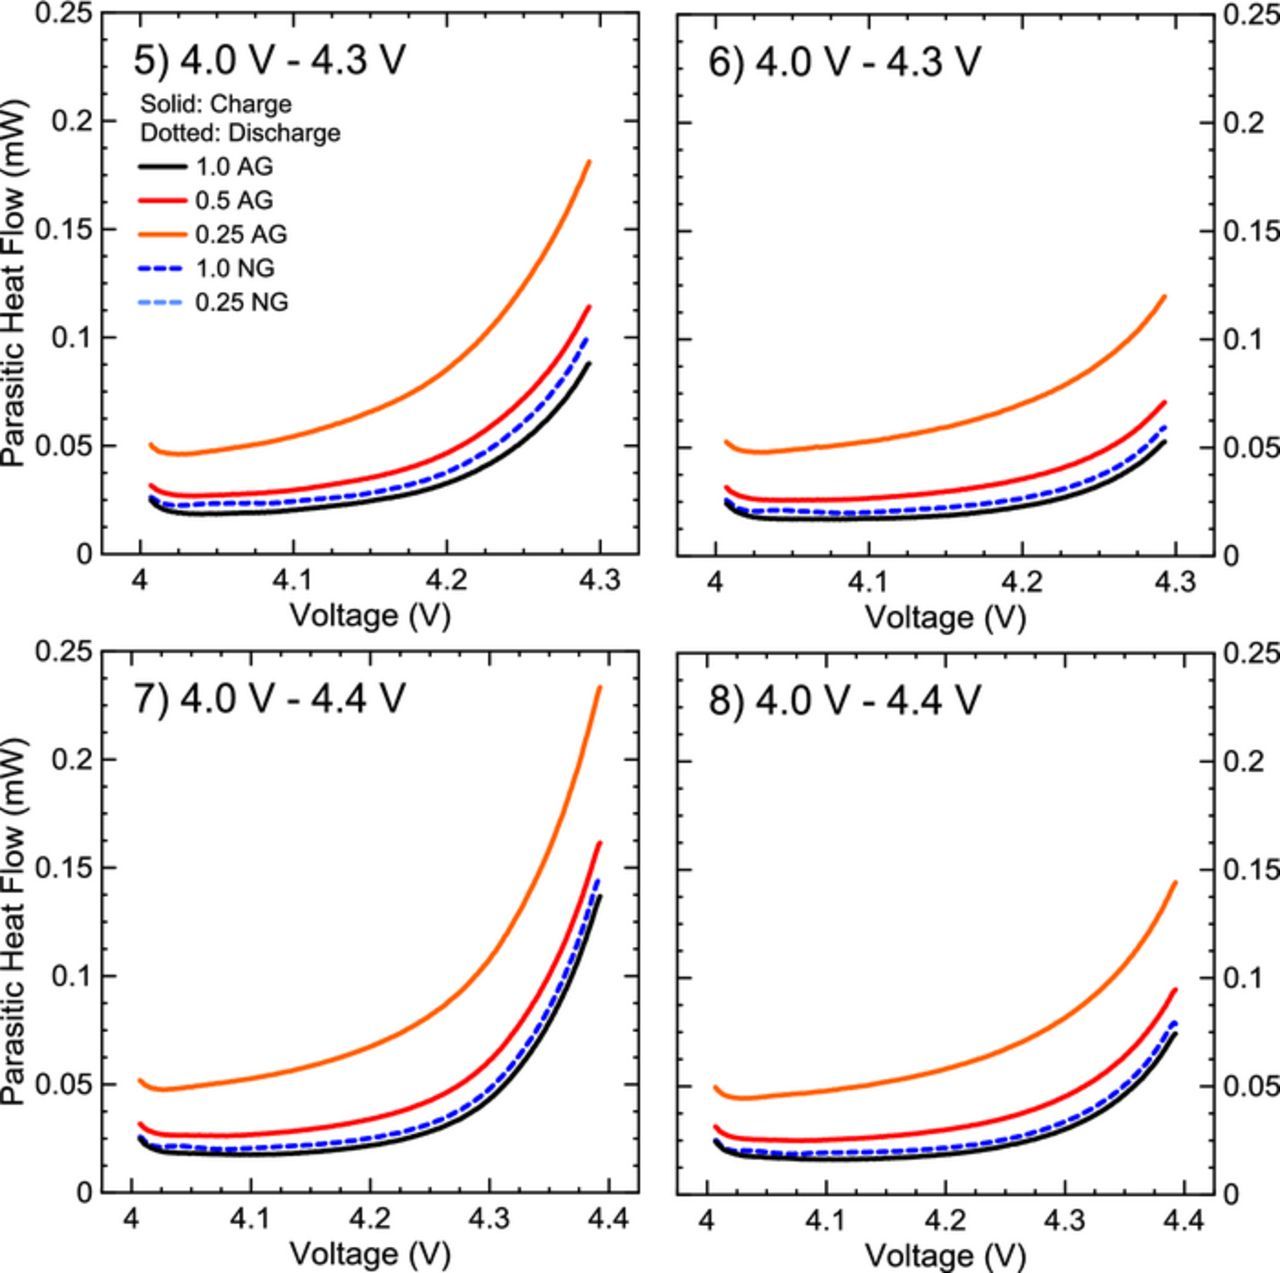
Figure 6. Extracted parasitic heat flow for two cycles from 4.0 V to 4.3 V and 4.0 V to 4.4 V. Numbers in each panel correspond to the 1 mA cycle number in the microcalorimetry protocol.
Figure 8 shows the in-situ volume measurements of 1.0 and 0.25 AG and NG cells during 2 cycles from 3.0 V to 4.3 V at 40. ± 0.1°C measured at a C/20 rate followed by 100 h voltage holds at 4.4 V and 4.5 V. 1.0 AG and 1.0 NG cells show no gas evolution during both voltage holds. 0.25 AG cells show no gas evolution at 4.4 V and until approximately 30 and 50 h into the 4.5 V hold. 0.25 NG cells show a small amount of gas production at 4.4 V and a steadily increasing amount of gas at 4.5 V. Increased gas production at high voltage suggests an increase in parasitic reactions. These cells have identical positive electrodes so the increased gas production must result from interactions between the negative and positive electrodes. Species created at the negative must move to the positive and react there, generating at least some of the gas. These results suggest that a full additive loading is sufficient to protect the negative electrode from creating these species. However, the 0.25 loading was insufficient to protect NG from generating these species while AG cells did not produce gas until long after exposure to 4.5 V. These results agree with microcalorimetry results, which showed continually increasing parasitic reactions in 0.25 NG cells at high voltage while all other cells decreased in parasitic heat flow with time.

Figure 8. In-situ volume measurements during 4.4 V and 4.5 V holds for 100 hours each. a) The voltage vs time for a 1.0 AG cell. b) cell volume change vs time, normalized to the bottom of discharge of the first cycle.
To investigate the effect of mechanical strain and particle swelling in NG cells, in-situ stack pressure measurements were performed. Cells were placed in aluminum cell holders between a metal plate and a pressure sensor. The cell thickness was therefore constrained so that swelling would cause a stack pressure increase as compliant materials in the cells compressed. Cells were cycled between 3.0 V and 4.2 V at a C/6 rate at 40°C. This method and apparatus are described in detail by Louli et al.16 The raw voltage and pressure vs time for one of each cell are shown in Figure 9a (1.0 AG and 1.0 NG) and in Figure 9b (0.25 AG and 0.25 NG). Figure 9c and 9d summarize this data by plotting the change in average pressure integrated over cycle time vs cycle number and the change in pressure at top of charge vs cycle number, respectively. 1.0 AG cells show minimal change in average pressure and top of charge pressure over the course of over 1 month of cycling. 0.25 AG cells show a small increase over 1.0 AG cells during cycling. Conversely, 1.0 and 0.25 NG cells both show large increases in average pressure and pressure at top and bottom of charge. The increase in stack pressure at top of charge could indicate the continual mechanical strain and swelling of graphite particles, as well as SEI growth. If this method is sensitive enough to measure SEI growth, this may also be the reason behind the slightly higher pressure in 0.25 AG cells. The increase in pressure at bottom of charge suggests the expansion of NG and possibly the increase in SEI thickness was irreversible. When comparing the pressure results in Figure 9c to UHPC and calorimetry results it may seem surprising that 1.0 NG and 0.25 NG exhibited nearly identical pressure evolution, while 0.25 AG showed larger pressure growth than 1.0 AG. Pressure measurements may suggest that parasitic reactions occurring in 0.25 NG which cause the large difference in parasitic heat flow and slippage from 1.0 NG do not form solid products, which is further evidenced by only 0.25 NG cells producing gas under 4.5 V in Figure 8. In contrast, the parasitic reactions occurring in 0.25 AG which lead to higher parasitic heat flow and slippage may form solid products, leading to the increased pressure growth over 1.0 AG and the absence of gas evolution. However, Li et al. found that 0.25 NG and 0.5 NG cells experienced large impedance growth during long term cycling, which was likely due to continual SEI formation, larger than that of 1.0 NG.10 This may suggest that along with gaseous products, reactions in NG cells could form a different SEI which is either dense or more compressible and is not detectable using in-situ pressure measurements. However, this interpretation is speculative, and more work must be done to understand what can be learned about SEI growth from pressure evolution measurements. Although in-situ stack pressure measurements are not yet mature enough (at least in this laboratory) to elucidate all of the mechanisms behind the increases in pressure, these results can be used to connect to the findings of both UHPC and calorimetry measurements. Thus, it is a simple and valuable technique to adopt when trying to understand electrochemical performance of materials.

Figure 9. In-situ pressure measurements of a) 1.0 AG and 1.0 NG cells, b) 0.25 AG and 0.25 NG cells vs time. c) The averaged pressure over each cycle. d) The change in pressure at top of charge.
To probe the mechanism responsible for the observed capacity loss in NG cells, 1.0 AG and 1.0 NG cells which underwent UHPC cycling to 4.2 V were tested using dV/dQ analysis.26,27 The full additive loading 4.2 V cells were chosen to minimize the influence of electrolyte oxidation and to observe the impact of graphite expansion on the full additive loading after many cycles at a high rate, which was not possible in calorimetry studies. After UHPC cycling, AG and NG cells were cycled at a C/3 rate with a constant voltage hold at top of charge until the current reached a value of C/20 for 558 and 586 cycles, respectively, on a NEWARE cycler at 40.0 ± 0.1°C. Cells were then cycled on the UHPC system once again for two cycles at C/20. Figures 10a, 10b, and 10c show the discharge capacity, normalized discharge capacity, and ΔV (average charge voltage – average discharge voltage), respectively, during the long-term cycling. Figure 10 shows that even with the full additive loading, 1.0 NG cells have higher capacity fade and impedance growth than 1.0 AG cells. dV/dQ analysis results are shown in Table I. Fits to the dV/dQ and dQ/dV data using the reference materials for AG cells, shown in Figures 11a and 11b, and NG shown in Figures 11c and 11d, demonstrate good fitting of all voltage curve features. The AG cells had approximately 95% capacity retention after 560 cycles while the NG cell had 87% capacity retention. The total relative electrode slippage (both electrodes relative to cycle 2) for AG and NG cells was 13.45 mAh and 31.33 mAh respectively, and the electrode material mass loss was found to be negligible for both cells. Therefore, the observed capacity fade in NG cells was not due to mass loss caused by particle expansion and damage, but due to lithium inventory loss at the negative electrode, which is worse for the NG cells. The loss of lithium inventory can be supported by the impedance growth seen in NG cells, likely caused by a thickening SEI.
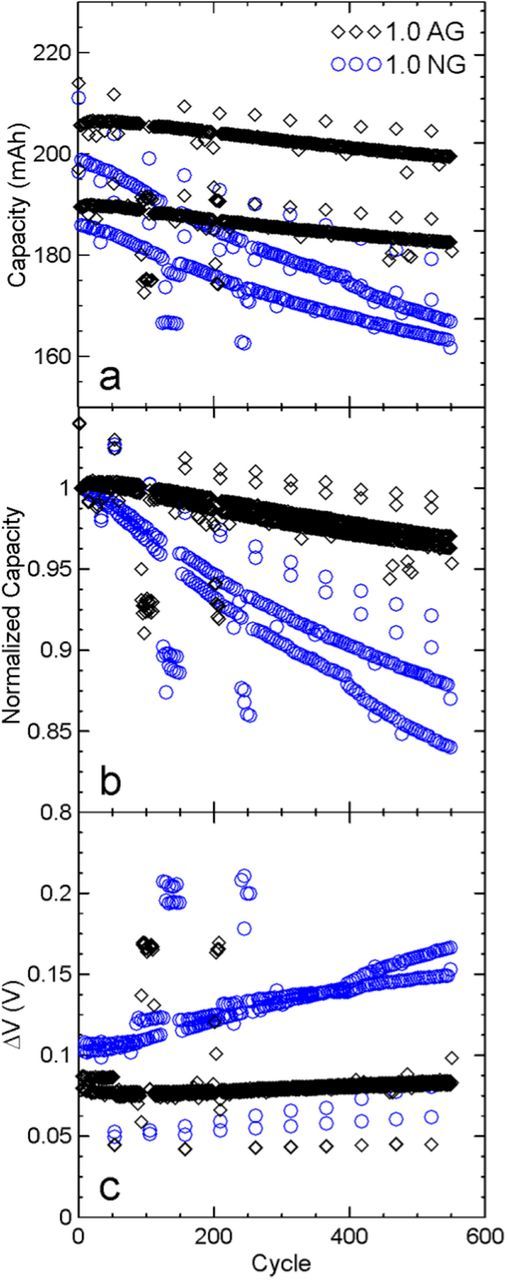
Figure 10. Long term cycling results for NMC532/AG and NMC532/NG cells a) discharge capacity, b) fractional discharge capacity, and c) ΔV of 1.0 AG (black diamonds) and 1.0 NG (blue circles) cells used for dV/dQ analysis.
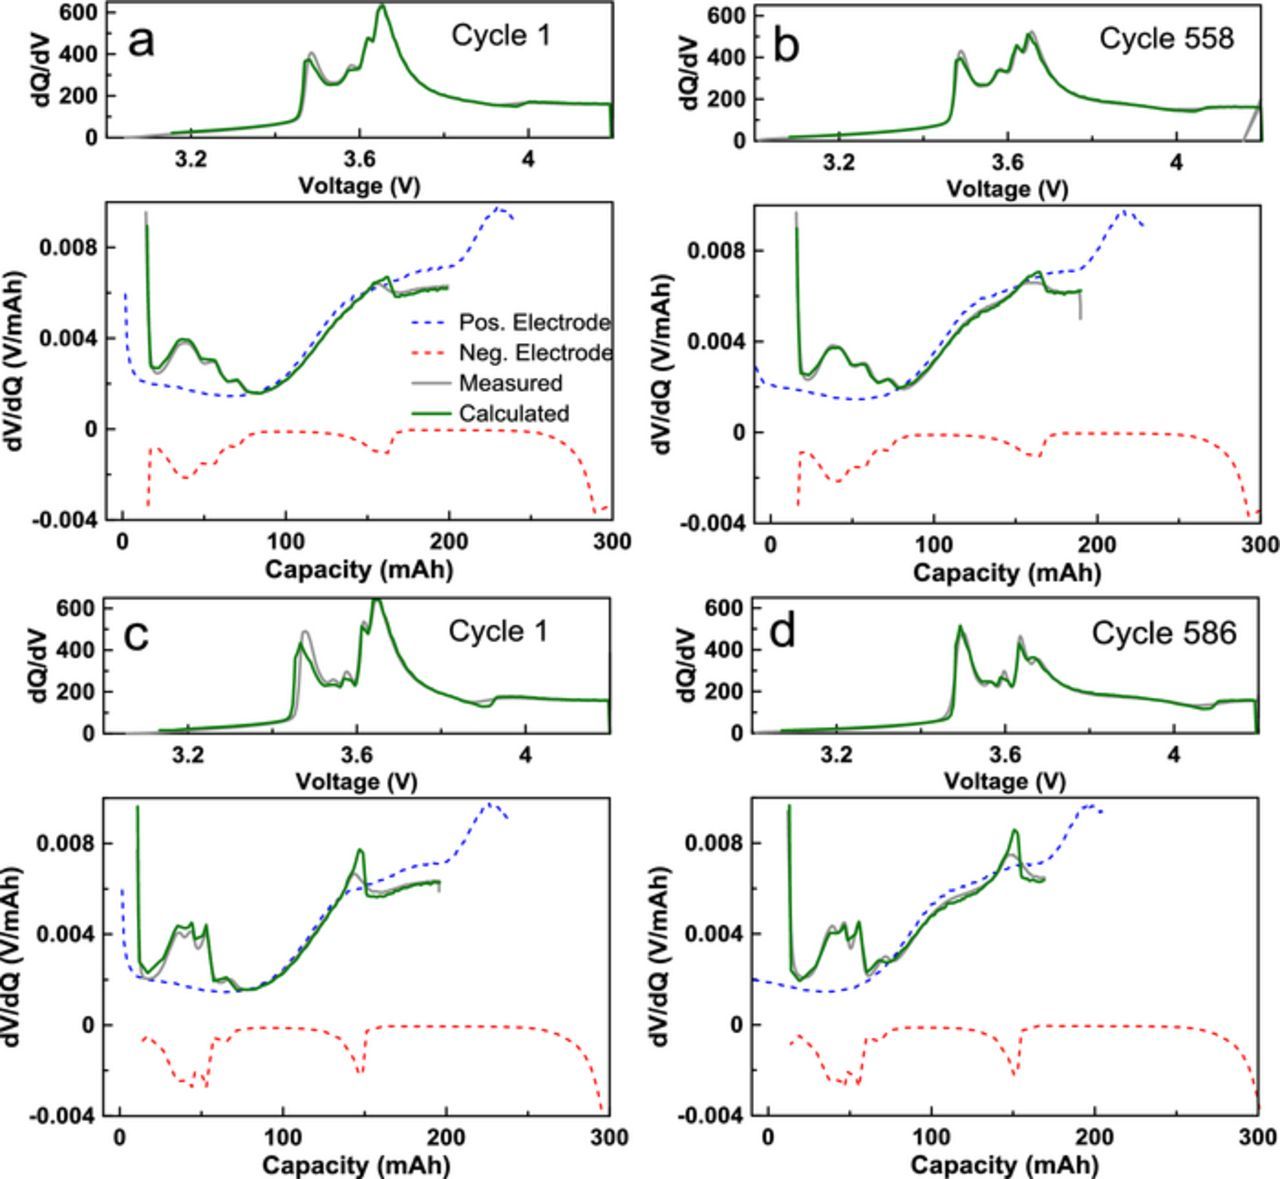
Figure 11. dV/dQ fitting results of 1.0 AG cells before (a) and after 550 cycles (b), and 1.0 NG cells before (c) and after (b). The positive electrode reference curves are shown in blue, negative reference in red, fitted results in green, and experimental results in gray.
Figures 12a and 12c demonstrate the fitted relative positions of the positive and negative electrode voltage curves of AG and NG cells, respectively, during the first full UHPC cycle, and Figures 12b and 12d show the results for post long term cycling. The NG cells initially had slightly more negative electrode capacity than AG cells, and contained a larger stage-2-stage-1 voltage plateau. The NG cells may therefore have spent a slightly longer amount of time in the two-phase plateau during high voltage cycling in early cycles. It is unknown if different times in graphite stages may have influenced the amount of particle swelling, and thus the parasitic heat flow or cycling performance, though the similar trends in AG and NG cells in microcalorimetry results suggest that it does not. Additionally, due to the large amount of relative electrode slippage caused by lithium inventory loss in a growing negative electrode SEI, seen in Figures 12b and 12d, the time spent in the stage-2-stage-1 plateau was smaller in NG than AG cells after cycling. Future work could investigate the effects of the amount of time spent in specific graphite stages in NG, where internal stress in particles could be higher when graphite enters the stage-1 phase.
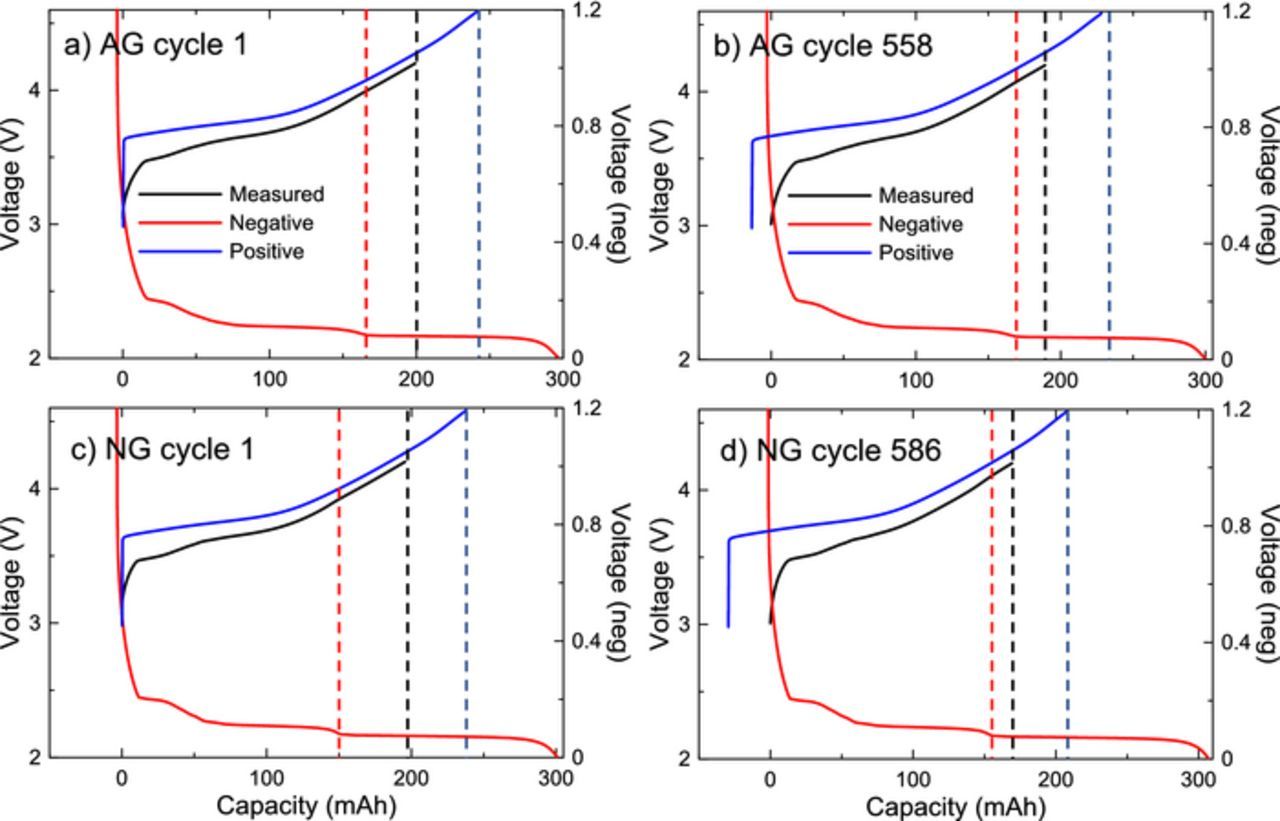
Figure 12. dV/dQ fitting of the first cycle of a) AG and b) NG. The full cell voltage curve is shown in black, the fitted positive electrode curve in blue, and the fitted negative electrode in red. The relative end point positions for the positive electrode and the full cell, and the position of the stage 2 graphite feature are shown as dotted lines.
Considering the results obtained from UHPC, microcalorimetry, in-situ pressure and gas measurements, and dQ/dV fitting, the proposed mechanism for the poor observed performance of NG is shown in Figure 13. In Figure 13a, a graphite particle in a 0.25 NG cell has a thin SEI layer (red) after formation. During cycling the particle expands and contracts, breaking the SEI and reducing solvent or products of electrolyte oxidation from the positive electrode to form new SEI or other reaction products, including gas. This is supported by the large parasitic heat flow and gas production of 0.25 NG cells, as well as the large slippage seen in UHPC measurements. Over time the products of the continual SEI formation may lead to the increased impedance of 0.5 NG and 0.25 NG cells found in long term cycling by Li et al.10 Figure 13b proposes that a sufficiently thick SEI such as on 1.0 NG could sustain the strain of expansion and supress surface area exposure, preventing reduction of solvent or other electrolyte species on the graphite surface. Low slippage, no gas production, and low parasitic heat flow, all close to that of AG cells suggest that a sufficient SEI can help mitigate some unwanted performance characteristics of NG cells.

Figure 13. The proposed mechanism responsible for the observed UHPC performance of natural graphite. a) 0.25 NG cells with a thin or incomplete SEI film does not fully protect the electrode particles during expansion and contraction, causing electrolyte solvent or oxidized species to reduce at the exposed surface. b) 1.0 NG cells likely have a thick and fully formed SEI which is sufficient to withstand mechanical strain and does not expose new areas of electrode.
The above data in this paper are all consistent with the model presented above. However, when the same graphites are used in cells with different positive electrode materials, such as Al2O3-coated NMC622A and high-voltage coated NMC622B, major differences can be seen. In 622A cells the two graphites behave similarly or even oppositely! Figures 14a, 14b, and 14c show the long term cycle testing of 622A/AG and 622A/NG and Figures 14d, 14e, and 14f show data for 622B/AG and 622B/NG, all with the full loading PES211 electrolyte at 40°C, C/3 CCCV, 3.0 to 4.2 V. Figure 14 clearly shows that just by changing the positive electrode coating dramatic differences between the capacity retention and impedance growth of cells with the different graphites are observed. The impedance growth (Figure 14c) for NMC622A cells with AG negative electrodes is worse compared to that of the cells with NG negative electrodes which is completely opposite to the behavior observed in Figure 9c for the NMC532 cells. The capacity fade rate seen in Figure 13b of 622A/NG cells after 700 cycles is also smaller than with AG, also opposite to the behavior in NMC532 cells. Interestingly, NMC622B/AG cells show slightly worse impedance growth than NMC622B/NG cells (Figure 13f), but the capacity retention and fade rate are much better in NMC622B/AG cells than NMC622B/NG cells. An earlier microcalorimetry study on the parasitic heat flow in various coated NMC/NG cells with PES211 electrolyte found that NMC622A/NG cells had a much larger parasitic heat flow than NMC622B/NG cells but performed similarly in long term cycling (just as for the blue data in Figures 13b and 13e), suggesting the presence of shuttle-like reactions in NMC622A/NG cells.24 These shuttle-like reactions may be responsible for keeping the cell impedance small (See Figure 14c). The entire suite of experiments presented in this paper for the NMC532 cells have not yet been applied to the NMC622 cells. The purpose of Figure 14 is to alert readers that everything in a Li-ion cell matters and it is dangerous to create explanatory models for one cell chemistry and apply them, without verification, to other cell chemistries. Comparing Figures 10 and 14 strongly suggests that inter-electrode interactions and electrode coatings play a strong role in determining the response of the graphite electrode.

Figure 14. Long term cycling results for coated NMC622/AG and NMC622/NG cells with 1.0PES211 electrolyte a,d) discharge capacity, b,e) fractional discharge capacity, and c,f) ΔV of NMC622A cells are shown in the left panels (a,b, and c) and NMC622B are shown in the right panels (d, e, and f). AG cells are shown as black diamonds and NG cells are shown as blue circles. Cells all plotted versus cycle number.
Conclusions
The electrochemical performance of NMC532/graphite cells with natural and artificial graphite was studied using ultra-high precision coulometry and in-situ isothermal microcalorimetry, gas volume, and pressure measurements. Cells contained varying amounts of a 2% wt PES, 1% wt DTD, 1% wt TTSPi additive blend to study the effect of the negative electrode material and the impact of the SEI. When additive loading was decreased in cells containing artificial graphite there was little increase in parasitic heat flow, minimal impact on coulometry metrics, very little irreversible cell expansion measured by in-situ pressure measurements, and no gas production during in-situ high voltage holds. In contrast, natural graphite cells showed similar electrochemical and parasitic heat flow performance when a full additive loading was used, but massive amounts of parasitic heat flow, very poor electrochemical performance, and gas production when the additive loading was decreased. Pressure measurements showed irreversible expansion in all NG cells. The results suggest that natural graphite undergoes irreversible particle strain and expansion, which does not increase the amount of parasitic reactions provided a protective SEI film is present, as was the case in natural graphite cells with a full additive loading. When the additive loading is decreased, the SEI layer is insufficient to protect newly created surface area on the expanding natural graphite particles. Solvent and oxidation products from high voltage reactions at the positive electrode then continually reduce on the negative electrode, forming an unstable SEI, which causes the observed high parasitic heat flow, charge slippage, capacity fade and low CIE. dV/dQ analysis showed that the capacity fade observed in NG cells was due to relative electrode slippage caused by parasitic reactions, not by active mass loss caused by particle expansion.
Al2O3-coated and high-voltage coated NMC622/graphite cells were also studied and the results found were different to those found for the NMC532/graphite cells. In particular, Figures 9 (NMC532) and 13 (NMC622) show the long term cycling comparisons for cells with AG and NG negative electrodes and demonstrate dramatic differences in capacity retention between the graphites in NMC532 and high-voltage coated NMC622 cells, and virtually no difference in Al2O3-coated NMC622 cells. In addition, Figures 9c, 13c, and 13f show that impedance growth is worse for NG in NMC532 cells and worse for AG in NMC622 cells. These results suggest the importance of inter-electrode interactions and coatings in determining the response of the graphite negative electrode.
Acknowledgments
The authors thank NSERC and Tesla Canada for funding this work under the auspices of the Industrial Chairs program. SLG and AJL thank NSERC and SLG thanks the Walter C. Sumner foundation for support. The authors acknowledge William Stone and Kathlyne Nelson for their contribution measuring some of the cells used in these tests. The authors thank Dr. Jing Li at BASF for providing the LiPF6 salt and the solvents used in this work. Dr. Jian Tu of LiFUN provided expert cell assembly.