
Abstract
Unwanted parasitic reactions in lithium-ion cells lead to self-discharge and inefficiency, especially at high temperatures. To understand the nature of those reactions this study investigates the open circuit storage losses of LFP/graphite and NMC811/graphite pouch cells with common alkyl carbonate electrolytes. The cells perform a storage test at 40 °C with a 500 h open circuit period after formation at temperatures between 40 °C and 70 °C. Cells formed at elevated temperature showed a high reversible storage loss that could be assigned to a redox shuttle generated in the electrolyte during formation. A voltage hold after formation can reduce the shuttle-induced self-discharge as indicated by significantly lower reversible storage losses, the absence of shuttling currents in cyclic voltammetry and improved metrics in ultra-high precision cycling. The addition of two weight percent vinylene carbonate can prevent redox shuttle generation and leads to almost zero reversible self-discharge.
Export citation and abstract BibTeX RIS

This is an open access article distributed under the terms of the Creative Commons Attribution 4.0 License (CC BY, http://creativecommons.org/licenses/by/4.0/), which permits unrestricted reuse of the work in any medium, provided the original work is properly cited.
Lithium-ion batteries play an essential role in the world's transition to sustainable energy, as evidenced by the increasing rate of electric vehicle adoption and battery deployment for stationary storage of renewable energy. 1 The ability of lithium-ion cells to hold their charge over extended periods of time is obviously important for customer-oriented applications like portable electronics and electric vehicles. However, avoiding self-discharge also has important implications from an energy savings and energy security perspective, as we increase the installed capacity of battery-based stationary storage of renewable energy.
The olivine phosphate LiFePO4 (LFP) has gained renewed interest as a positive electrode active material for lithium-ion batteries in electric vehicles and stationary energy storage due to cost and sustainability considerations. However, Logan et al. showed that LFP/graphite cells can have high self-discharge rates, especially at elevated temperatures and in the absence of effective electrolyte additives. 2 Thus, the understanding of self-discharge in lithium-ion cells is crucial.
Different self-discharge mechanisms were proposed in the literature 3 ; they can be divided into irreversible and reversible mechanisms. Irreversible self-discharge is caused by lithium inventory loss, e.g., due to thickening of the passivating solid electrolyte interphase (SEI) layer on the negative electrode. Reversible self-discharge is not associated with lithium inventory loss and can, for example, be caused by a redox shuttle molecule that is oxidized at the positive electrode and reduced at the negative electrode. For every electron that is shuttled from the negative electrode to the positive electrode in that way, a Li+-ion moves from the negative electrode to the positive electrode, which effectively causes self-discharge. In principle, redox-shuttle induced self-discharge is fully reversible, since no species are consumed in the reaction. 3
Recent work by Boulanger et al. showed that electrolyte extracted from LFP/graphite cells (without electrolyte additives) after formation at temperatures between 40 °C and 70 °C exhibits significant discoloration. 4 Extracted electrolytes with intense red and brown color showed relatively large shuttling currents in cyclic voltammetry (CV) sweeps as well as low coulombic efficiency (CE) and high charge slippage in ultra-high precision coulometry (UHPC) experiments. 4 It was concluded that the in situ generation of a redox shuttle in the electrolyte of the lithium-ion cells could explain the observed phenomena. The shuttling currents measured by Boulanger et al. 4 were in quantitative agreement with the self-discharge rates reported by Logan et al. 2 in LFP/graphite cells without electrolyte additives. Other groups also ascribed reversible self-discharge to a shuttle reaction, 5,6 but the exact conditions that lead to redox shuttle generation remained unclear.
This study will investigate the self-discharge of LFP/artificial graphite (AG) and LiNi0.8Mn0.1Co0.1O2 (NMC811)/AG pouch cells in storage experiments designed to differentiate between reversible and irreversible losses. The storage losses will be measured as a function of formation at elevated temperatures between 40 °C and 70 °C. We will investigate the role of different graphite types, electrolyte additives, conducting salts, and voltage holds on self-discharge.
Experimental
Electrolyte preparation
Four different electrolytes are used in this study. The solvent mixture for all electrolytes consists of ethylene carbonate (EC) and dimethyl carbonate (DMC) in a weight ratio of 3:7. Control electrolyte (CTRL) uses 1.5 M LiPF6 as lithium salt. CTRL + 2 wt% vinylene carbonate is referred as 2VC. The two other electrolytes use 1.5 M lithium bis(fluorosulfonyl)imide (LiFSI) instead of LiPF6 as lithium salt. They will be referred to as CTRL-LiFSI and 2VC-LiFSI. All electrolyte components were used as-received (<20 ppm water, Shenzhen Capchem, China) and mixed in an Ar-filled glovebox.
Pouch cell assembly
402035-size lithium-ion pouch cells with LFP (nominal capacity 220 mAh to 3.65 V) or NMC811 (nominal capacity 175 mAh to 4.06 V) positive electrodes and AG negative electrodes were obtained vacuum sealed without electrolyte (LiFUN Technologies, China). The pouch cells were dried under vacuum at 120 °C for 14 h, filled with 1 ml (LFP/AG) or 0.85 ml electrolyte (NMC811/AG), and vacuum sealed at −90 kPa gauge pressure. LFP/AG cells receive more electrolyte because their active electrode area is larger than that of NMC811/AG cells (85.0 cm2 for LFP/AG, 52.3 cm2 for NMC811/AG). Furthermore, some LFP/AG cells were overfilled with 2 ml of electrolyte in order to extract electrolyte after formation for CV experiments.
Three different artificial graphites, referred to as AGA, AGB, and AGC, were used in the respective pouch cells. The physical properties (average particle diameter, specific surface area and tap density) can be found in Table I of Ref. 7. Extensive cycling data and characterization of these graphites paired with NMC811 positive electrodes can be found in Refs. 7 and 8.
Formation protocols
All cells were charged to 1.5 V and held at constant voltage for 16 h to ensure wetting of the electrode pores with electrolyte while avoiding dissolution of the negative electrode current collector. The cells then completed a single C/20 formation cycle and a C/10 recharge to 50% state of charge (SOC) on a Maccor Series 4000 test system at different formation temperatures, TF = 40 °C, 55 °C and 70 °C. LFP/AG cells were formed between 2.5 and 3.65 V and NMC811/AG cells between 3.0 and 4.06 V. After formation some cells were kept at the respective formation temperature of 40 °C, 55 °C or 70 °C and charged at C/10 to 4.2 V or 4.4 V, with a subsequent 14 h voltage hold followed by a C/10 discharge to 50% SOC.
Self-discharge experiments
Open circuit voltage (OCV) measurements were performed on a custom-built high-precision charger to characterize self-discharge at storage temperatures, TS = 40 °C and 60 °C. The procedure follows the storage protocol by Sinha et al. and is shown in Fig. 1. 3 After formation, the cells complete two full cycles at a rate of C/10 to precisely determine the initial discharge capacity (D0). Then they are charged to the upper cut-off potential and are held at that voltage for 10 h before going into open circuit storage for 500 h. After the storage period, the cells are discharged (D1), charged, and discharged again (D2) at C/10 to determine the irreversible (D0-D2) and reversible capacity loss (D2-D1) during storage. LFP/AG cells were cycled between 2.5 and 3.65 V and NMC811/AG cells between 3.0 and 4.06 V. Some NMC811/AG cells were cycled between 3.0 and 4.2 V; they are labeled accordingly.
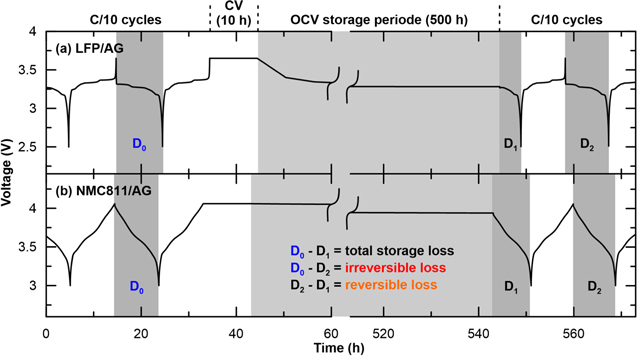
Figure 1. Voltage curves illustrating the storage protocol used for (a) LFP/AG and (b) NMC811/AG pouch cells filled with CTRL electrolyte. After formation and full discharge, the cells undergo two C/10 cycles from (a) 2.5 to 3.65 V and (b) 3.0 to 4.06 V, a constant voltage hold for 10 h at the upper cut-off voltage, 500 h of storage at OCV, a discharge of the remaining capacity, and a final C/10 cycle. Note that only the second one of the initial C/10 cycles is shown. D0, D1 and D2 are the discharge capacities of the half-cycles shaded in dark gray. D0-D1 represents the total storage loss, D0-D2 the irreversible loss and D2-D1 the reversible loss during the 500 h storage period shaded in light gray.
Download figure:
Standard image High-resolution imageUltra-high precision coulometry (UHPC)
Coulombic efficiency and charge slippage measurements were done on the UHPC system at Dalhousie University. 9,10 The cells were cycled at C/20 and 40 °C from 2.5 to 3.65 V for LFP/AG cells and 3.0 to 4.06 V for NMC811/AG cells.
Cyclic voltammetry (CV) in coin cells
CVs were recorded for electrolytes in their pristine state or as extracted from LFP/AG pouch cells after formation at different conditions. Overfilled pouch cells were brought to 50% SOC and stored at 25 °C for 1 week to allow for electrolyte equilibration. 4,11 Subsequently, they were cut open in an Ar-filled glovebox to squeeze the electrolyte into dried polypropylene vials. Then, 0.1 ml of the extracted electrolyte were added to 2325-size coin cells consisting of a 12.75 mm diameter aluminum foil (working-electrode), a metallic lithium foil (counter-electrode) and two pieces of Celgard 2320 as separator. Three CV cycles were measured using a VMP3 potentiostat (Bio-Logic, France) at 0.1 mV s−1 and 25 °C between 2.6 and 3.75 V vs Li+/Li. The second and third cycles are shown in the CV plot.
Results
Storage of LFP and NMC811 cells at 60 °C with different graphites
Figure 2 shows the initial discharge capacity (blue), irreversible loss (red) and reversible loss (orange) of LFP/AG and NMC811/AG pouch cells with different graphite types in a 500 h storage experiment at TS = 60 °C. The cells were formed at TF = 40 °C and use CTRL, 2VC, CTRL-LiFSI or 2VC-LiFSI electrolyte. The initial discharge capacity of cells with different graphite types varies between ∼200 mAh for LFP/AGA CTRL and ∼225 mAh for LFP/AGC CTRL (see Fig. 2a-1). These cells have the same design capacity, but batch-to-batch variations during fabrication can account for the observed differences.
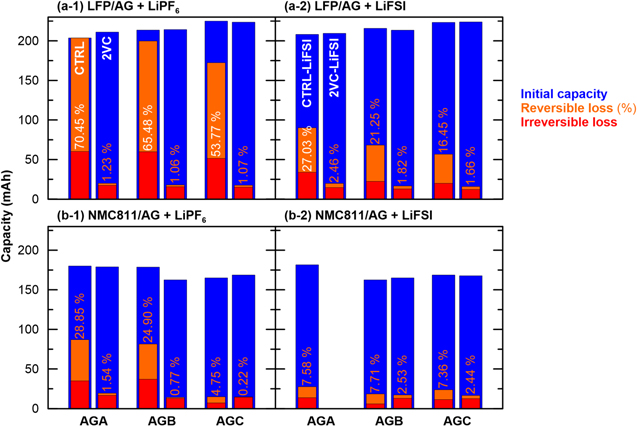
Figure 2. Initial discharge capacity (blue), irreversible loss (red) and reversible loss (orange) during 500 h storage experiments at TS = 60 °C of (a) LFP/AG and (b) NMC811/AG pouch cells. The reversible loss is also reported as a percentage of the initial discharge capacity. Three types of artificial graphite were used (AGA, AGB, AGC). The cells were filled with EC:DMC 3:7 and either (a-1), (b-1) 1.5 M LiPF6 (CTRL) or (a-2), (b-2) 1.5 M LiFSI (CTRL-LiFSI). Some cells had 2 wt% VC added to the electrolyte (2VC and 2VC-LiFSI). Formation was done at C/20 and TF = 40 °C from 2.5 to 3.65 V for LFP/AG and from 3.0 to 4.06 V for NMC811/AG cells.
Download figure:
Standard image High-resolution imageFigure 2 shows that the storage losses strongly depend on the type of artificial graphite, the presence of VC in the electrolyte, the lithium salt, and the positive electrode active material. LFP/AG CTRL cells show rapid self-discharge for all three graphite types, as indicted by the high irreversible (red) and reversible (orange) storage losses (see Fig. 2a-1). Regardless of the type of artificial graphite used, the cells show irreversible losses of more than 50 mAh during the 500 h OCV period. The reversible losses are between 53.77% and 70.45% of the initial discharge capacity for AGC and AGA, respectively. For AGA this leads to a complete self-discharge of the cell. Eldesoky et al. have shown a significant impact of these three graphite types on various performance metrics of NMC811/AG cells, e.g., first cycle efficiency (FCE) and capacity retention. 7,8 The authors concluded that AGC has a lower electrochemically active surface area which results in higher FCE and reduced capacity fade. Higher FCE is typically associated with improved passivation of the negative electrode and can explain the lower storage losses observed with AGC (see Fig. 2a-1).
The LFP/AG 2VC cells in Fig. 2a-1 show much smaller self-discharge for all graphite types, with irreversible losses below 20 mAh and nearly no reversible losses (1.07%–1.23%). Irreversible self-discharge is due to lithium inventory loss, which is likely caused by thickening of the negative electrode SEI during storage. 7,12 The 2VC cells have much lower irreversible losses than CTRL cells, because the SEI-forming additive VC ensures a sufficiently stable SEI after formation to prevent further electrolyte decomposition during high temperature storage. 13 In contrast, the higher irreversible losses of the CTRL cells indicate a poorly passivated negative electrode after formation leading to further electrolyte decomposition and lithium loss during high temperature storage. Interestingly, the presence of 2VC almost completely suppresses reversible storage losses, which amount to ≤1.23% in LFP/AG cells with 2VC as opposed to ≥53.77% in LFP/AG with CTRL electrolyte (see Fig. 2a-1). Boulanger et al. have shown that the in situ generation of a redox shuttle during high temperature formation or storage can explain large reversible self-discharge in lithium-ion cells without electrolyte additives. 4 It was also shown that 2VC suppresses the generation of such a redox shuttle. 4
Figures 2a-2 shows a similar set of storage experiments for LFP/AG cells with LiFSI conducting salt. The LiFSI containing cells exhibit a similar storage loss behavior as the LiPF6 containing cells, but the overall losses are smaller (see Fig. 2a-2). The reversible losses of the CTRL-LiFSI cells are about one-third to one-quarter of their LiPF6 counterparts. Nevertheless, they are still significant and range from 16.45 to 27.03% of the initial discharge capacity for AGC and AGA, respectively. Hence, the rapid self-discharge of LFP/AG cells at high temperature with CTRL electrolyte is not unique to LiPF6, which is known to have a lower thermal stability than LiFSI. 14 It is likely that similar redox shuttle species are produced in LiPF6 and LiFSI electrolyte that account for the large reversible self-discharge observed with both salts. The irreversible losses with CTRL-LiFSI (see Fig. 2a-2) are approximately half of those with CTRL-LiPF6 (see Fig. 2a-1). This indicates a better passivating SEI layer on the negative electrolyte and less lithium inventory loss during storage when LiFSI is used, consistent with high temperature storage and cycling data by Logan et al. 14
Similar to cells with LiPF6, the 2VC-LiFSI cells show significantly lower reversible and irreversible self-discharge than the CTRL-LiFSI cells (see Fig. 2a-2). LFP/AG cells with 2VC-LiFSI (see Fig. 2a-2) have about the same irreversible losses as cells with 2VC-LiPF6 (see Fig. 2a-1). However, the 2VC-LiFSI cells have consistently higher reversible losses than the 2VC-LiPF6 cells, with up to 2.46% for AGA. Logan et al. replaced LiPF6 with LiFSI in LFP/AG cells with 2% VC and found a lifetime benefit in high temperature cycling experiments. 14 This was attributed to a better passivating SEI layer on the negative electrode with LiFSI. However, the authors also found that 2VC-LiFSI cells exhibit inferior metrics in UHPC and storage experiments—consistent with our results—which was attributed to the presence of a redox shuttle. To summarize, while 2VC greatly suppresses redox shuttle-induced reversible self-discharge in cells with either LiPF6 or LiFSI, the remaining reversible self-discharge is higher in 2VC-LiFSI cells.
Figure 2b shows remarkably similar trends for NMC811/AG cells. Reversible losses are significant for NMC811/AG CTRL cells with up to 28.85% for AGA (see Fig. 2b-1). Hence, reversible self-discharge is not just a problem in LFP/AG cells, but a similar shuttle mechanism may apply in NMC811/AG cells. 2VC greatly suppresses reversible self-discharge in NMC811/AG CTRL cells (see Fig. 2b-1). This is in agreement with Boulanger et al. who show greatly suppressed shuttling currents in CV experiments with electrolyte extracted from NMC811/AG cells containing 2VC. 4
NMC811/AG cells with CTRL-LiPF6 (see Fig. 2b-1) have higher irreversible and reversible self-discharge than cells with CTRL-LiFSI (see Fig. 2b-2; the AGC cell with CTRL-LiPF6 electrolyte might be an outlier). When 2VC is added, cells with LiPF6 show negligible reversible losses (≤1.54%), but cells with LiFSI still show ∼2.5% reversible loss.
Figure 2 clearly illustrates a problem with reversible self-discharge at an elevated temperature of TS = 60 °C in LFP/AG and NMC811/AG cells that contain common alkyl carbonate electrolyte and no additives. Boulanger et al. have demonstrated that a redox shuttle generated in such cells at high temperature can quantitatively account for the observed rate of reversible self-discharge. 4 They formed LFP/AG and NMC811/AG pouch cells without electrolyte additives at various temperatures between TF = 25 °C and 70 °C and found increasing shuttling current as a function of formation temperature by cyclic voltammetry. 4 To investigate whether such a redox shuttle is indeed responsible for the high reversible losses, the storage temperature is now reduced to TS = 40 °C and self-discharge is studied as a function of formation temperature, TF = 40 °C, 55 °C, and 70 °C. Boulanger et al. have shown that redox shuttle generation is relatively small at 40 °C. 4 Thus, one would expect to generate the redox shuttle molecule during formation rather than storage for the above set of temperatures. The lower storage temperature should also lead to fewer irreversible losses associated with SEI thickening, making the shuttle induced self-discharge more prominent. All subsequent experiments are done with AGC and LiPF6 in order to reduce complexity and ensure comparability with Boulanger et al. who used the same graphite type and conducting salt. 4
Storage of LFP/AG cells at 40 °C with different formation temperatures
Figures 3a-1 and 3b-1 show the initial discharge capacity (blue), irreversible loss (red) and reversible loss (orange) of LFP/AG pouch cells in a 500 h storage experiment at TS = 40 °C with prior formation at TF = 40 °C, 55 °C or 70 °C. Figures 3a-2 and 3b-2 show the corresponding voltage curves during the 500 h OCV period. The cells in Fig. 3a started their storage experiments immediately after formation, whereas the cells in Fig. 3b did a 14 h voltage hold at 4.2 V and the respective formation temperature before storage. Boulanger et al. have shown that a 70 °C 4.2 V hold can reduce redox shuttle activity in the electrolyte, which should lead to lower reversible self-discharge. 4 Table I lists the values for the irreversible and reversible losses as a percentage of the initial discharge capacities presented in Figs. 3a-1 and 3b-1.

Figure 3. (Upper panels) Initial discharge capacity (blue), irreversible loss (red) and reversible loss (orange) of LFP/AG pouch cells with CTRL or 2VC electrolyte during 500 h storage at TS = 40 °C and formation at TF = 40 °C, 55 °C, or 70 °C. The reversible loss is reported as a percentage of the initial discharge capacity. (Lower panels) Corresponding voltage vs time during storage. Formation was done at C/20 from 2.5 to 3.65 V with (a) no voltage hold or (b) a 14 h hold at 4.2 V. Data for 4.2 V hold at TF = 40 °C not available.
Download figure:
Standard image High-resolution imageTable I. The values for the irreversible and reversible losses as a percentage of the initial discharge capacity of the cells presented in Figs. 3 and 4.
| Electrolyte | TF (°C) | Irreversible loss (%)/Reversible loss (%) | |||
|---|---|---|---|---|---|
| LFP/AG (Fig. 3) | NMC811/AG (Fig. 4) | ||||
| No hold | 4.2 V hold | Start at 4.06 V | Start at 4.2 V | ||
| CTRL | 40 | 11.36/26.82 | — | 5.07/5.47 | 2.55/4.90 |
| 55 | 9.47/34.05 | 6.62/47.39 | 5.63/8.05 | 3.17/8.20 | |
| 70 | 4.82/34.38 | 5.14/18.13 | 4.20/9.94 | 3.84/13.66 | |
| 2VC | 40 | 4.10/1.11 | — | 4.94/0.94 | 2.27/1.17 |
| 55 | 3.65/1.15 | 2.49/0.57 | 5.02/0.07 | 2.62/1.27 | |
| 70 | 3.27/1.03 | 2.59/0.67 | 5.32/0.03 | 2.27/1.14 | |
The CTRL TF = 40 °C cell in Fig. 3a shows an initial discharge capacity of nearly 225 mAh, which decreases to 200 mAh for TF = 70 °C. This is consistent with Buechele et al., who saw lower FCE and thus lower discharge capacity when increasing the formation temperature beyond 40 °C. 15 The initial discharge capacities of 2VC cells also decrease with increasing formation temperature, but not as much as for CTRL cells, since VC contributes to the buildup of a well-passivating SEI, making the influence of formation temperature less apparent. 13 An additional 4.2 V hold after formation does not have a strong influence on the initial capacities (see Fig. 3b-1), since LFP has no capacity beyond 3.65 V. 16,17
CTRL cells show high reversible losses even at TS = 40 °C (see Fig. 3a-1). Interestingly, the losses are approximately half of those at TS = 60 °C (see Fig. 2a-1). The reversible losses increase with formation temperature from 26.82% at TF = 40 °C to 34.38% at TF = 70 °C. As expected, the reversible losses for 2VC cells are much lower (1.03%–1.15%). The above observations are consistent with CV and UHPC tests by Boulanger et al. 4 and point to an increasing redox shuttle activity in CTRL cells the higher the formation temperature and an absence of redox shuttle activity in 2VC cells. The irreversible losses of CTRL cells decrease with increasing formation temperature from 11.36% at TF = 40 °C to 4.82% at TF = 70 °C. Yet, they are greater than those of 2VC cells (3.27%–4.10%).
Figure 3a-2 shows that the voltage of CTRL cells drops more rapidly, the higher the formation temperature, TF, indicating faster self-discharge. In particular, the first voltage step on discharge associated with the staging mechanism of lithium removal from graphite occurs after 470 h for TF = 40 °C, 350 h for TF = 55 °C, and 300 h for TF = 70 °C. 18 For the 2VC cells, the voltage drops are significantly smaller and the self-discharge is not sufficient to show staging behavior.
The CTRL TF = 70 °C cell that did a 4.2 V hold shows nearly half of the reversible loss of a pair cell without 4.2 V hold (18.13% vs 34.38%, see Fig. 3b-1 and 3a-1, respectively). This is in agreement with Boulanger et al., who showed significantly lower redox shuttle currents for electrolyte extracted from cells after a 70 °C 4.2 V hold. 4 However, the CTRL TF = 55 °C cell shows a higher reversible loss compared to its pair cell without 4.2 V hold (47.39% vs 34.05%). Therefore, the 4.2 V hold seems to have no effect at 55 °C and even increases self-discharge. Figures 3b-2 shows this effect very clearly, since the voltage of the CTRL TF = 55 °C cell after 4.2 V hold drops more rapidly than voltage of the CTRL TF = 70 °C cell after 4.2 V hold. Presumably, the oxidative decomposition of the shuttle molecule is not activated yet at 4.2 V and 55 °C and instead the extra time spent at 55 °C increases the amount of redox shuttle in the electrolyte. It is possible that higher voltage (e.g., 4.4 V as in Fig. 5) is needed to decompose the molecule by electro-oxidation. Interestingly, for the 2VC cells the 4.2 V hold at both, 55 °C and 70 °C, can further reduce the already small reversible losses from ≥1.03% to ≤0.67%. This can be clearly seen in the slower voltage drops of the 2VC cells with voltage hold (see Fig. 3b-2) compared to the 2VC cells without voltage hold (see Fig. 3a-2). Lastly, it is interesting to note that the irreversible losses of the 2VC cells are also reduced by the 4.2 V hold. They decrease from ≥3.27% to ≤2.59% (see Table I).
Storage of NMC811/AG cells at 40 °C with different formation temperatures
Figures 4a-1 and 4b-1 show the initial discharge capacity (blue), irreversible loss (red) and reversible loss (orange) of NMC811/AG pouch cells in a 500 h storage experiment at TS = 40 °C with prior formation at TF = 40 °C, 55 °C or 70 °C. Figures 4a-2 and 4b-2 show the corresponding voltage curves during the 500 h OCV period. After formation, the cells immediately went on to the storage experiments, beginning with a 10 h hold at the upper cut-off voltage of 4.06 V for the cells in Fig. 4a and 4.2 V for the cells in Fig. 4b. Note that the formation cycle used an upper cut-off voltage of 4.06 V for all cells. Table I lists the values for the irreversible and reversible losses as a percentage of the initial discharge capacities presented in Figs. 4a-1 and 4b-1.

Figure 4. (Upper panels) Initial discharge capacity (blue), irreversible loss (red) and reversible loss (orange) of NMC811/AG pouch cells with CTRL or 2VC electrolyte during 500 h storage at TS = 40 °C and formation at TF = 40 °C, 55 °C, or 70 °C. The reversible loss is reported as a percentage of the initial discharge capacity. (Lower panels) Corresponding voltage vs time during storage. Formation was done at C/20 from 3.0 to 4.06 V. The storage protocol was performed with (a) 4.06 V or (b) 4.2 V as upper cut-off potential.
Download figure:
Standard image High-resolution imageThe NMC811/AG TF = 40 °C cells show an initial discharge capacity of ∼170 mAh when charged to 4.06 V (see Fig. 4a) and ∼200 mAh when charged to 4.2 V (see Fig. 4b). CTRL cells have slightly lower initial discharge capacities for higher formation temperatures, due to lower FCE (≥160 and ≥195 mAh for 4.06 and 4.2 V, respectively). The initial discharge capacities of 2VC cells are mostly unaffected by the formation temperature, due to the better passivation of the negative electrode with VC (≥165 and ≥200 mAh for 4.06 and 4.2 V, respectively). 13,15
The reversible losses of the NMC811/AG CTRL cells in Fig. 4 are smaller than those of the LFP/AG cells in Fig. 3 (≤13.66% vs ≥18.13%). This is consistent with results by Boulanger et al. who found less redox shuttle current with electrolyte extracted from NMC811/AG cells compared to LFP/AG cells. 4 Interestingly, there is a clear correlation between formation temperature and reversible loss, both for cells starting storage at 4.06 V (see Fig. 4a-1) and 4.2 V (see Fig. 4b-1). This is also consistent with Boulanger et al. who detected larger shuttling currents with electrolytes extracted from cells formed at higher temperature. 4 Moreover, the CTRL cells charged to 4.2 V (see Fig. 4b-1) show similar or even higher reversible losses than the cells charged to 4.06 V (see Fig. 4a-1), e.g., 13.66% vs 9.94% for TF = 70 °C. Consequently, the 10 h 4.2 V hold at 40 °C at the beginning of the storage protocol does not reduce reversible losses. At both cut-off voltages, the reversible losses are greatly reduced for 2VC cells (0.03%–1.27%) compared to CTRL cells (4.90%–13.66%).
All NMC811/AG cells show small irreversible losses ≤5.63% independent of the formation temperature or the presence of VC. Interestingly, the irreversible losses of the 2VC cells that start storage at 4.2 V are about half of those that start at 4.06 V (≤2.62% compared to ≥4.94%), showing a similar trend as the LFP/AG cells in Fig. 3. This difference could stem from the fact that the cells charged to 4.2 V may have a slightly better passivation of the negative electrode, since they were charged to higher voltage in the intial two C/10 cycles of the stroage protocol compared to the 4.06 V cells. It may also be the case that oxidative decomposition of reaction products at 4.2 V OCV storage in NMC811/AG cells (see Fig. 4) or 4.2 V hold in LFP/AG cells (see Fig. 3) reduces the irreversible capacity loss. However, the nature of such reaction products and the exact mechanism is not understood at this point.
The voltage curves in Figs. 4a-2 and 4b-2 show that the CTRL cells have a more rapid voltage drop the higher the formation temperature. As expected, the voltage drop is very slow for 2VC cells. Comparing Figs. 3 and 4 in their entirety, it is clear that self-discharge in the absence of effective electrolyte additives is a bigger problem for LFP/AG cells than for NMC811/cells.
Storage of LFP/AG cells at 40 °C with different voltage holds
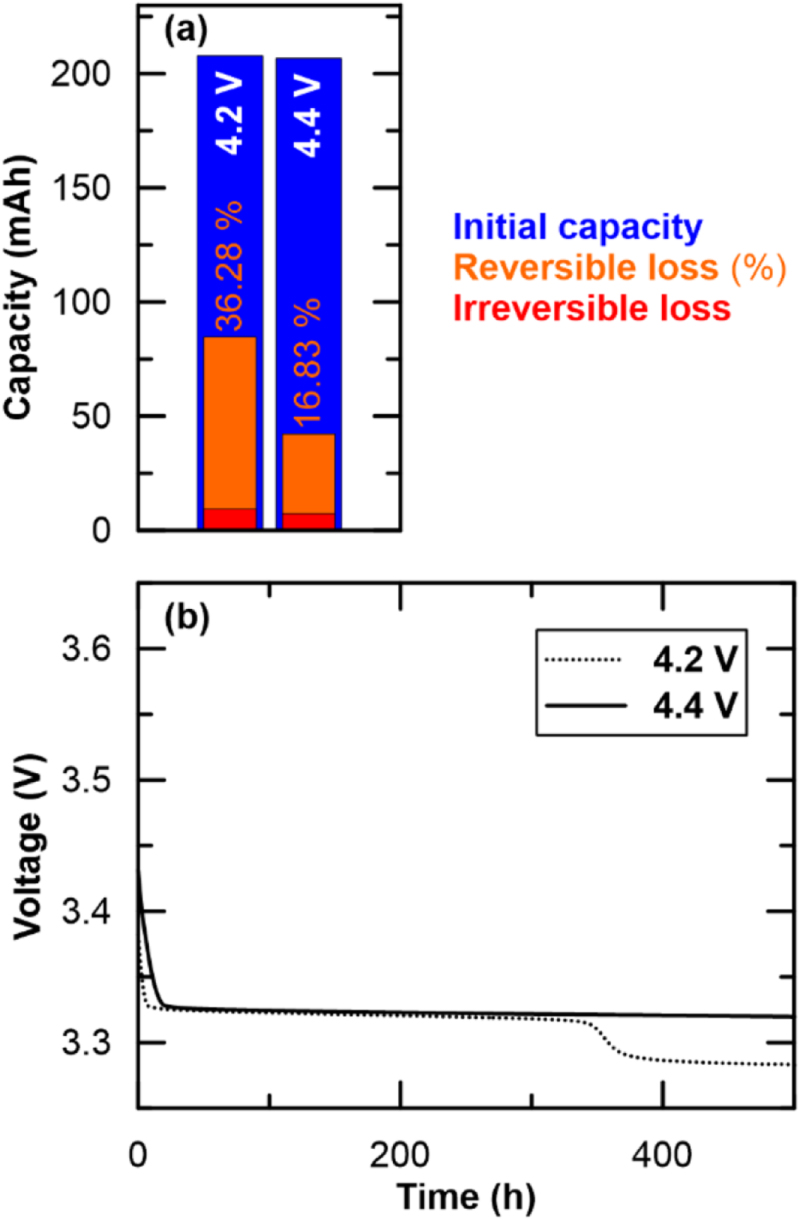
Figure 5a shows the initial discharge capacity (blue), irreversible loss (red) and reversible loss (orange) of LFP/AG CTRL pouch cells in a 500 h storage experiment at TS = 40 °C with prior formation at TF = 70 °C. These cells did a 40 °C 14 h hold at either 4.2 V or 4.4 V before they started storage. It is expected that the formation at TF = 70 °C creates a significant amount of redox shuttle, so that the effect of high voltage holds can be explored.

Figure 5. (a) Initial discharge capacity (blue), irreversible loss (red) and reversible loss (orange) during 500 h storage of LFP/AG CTRL pouch cells at TS = 40 °C. The reversible loss is reported as a percentage of the initial discharge capacity. (b) Corresponding voltage vs time during storage. Formation was done with C/20 from 2.5 to 3.65 V at TF = 70 °C with an additional 14 h voltage hold at 40 °C and 4.2 V or 4.4 V.
Download figure:
Standard image High-resolution imageThe initial discharge capacity of both cells is ∼207 mAh since LFP has no capacity beyond 3.65 V. The irreversible loss is only slightly higher for the 4.2 V cell (4.47% vs 3.56%). The reversible loss, however, reduces dramatically from 36.28% for the 4.2 V cell to 16.83% for the 4.4 V cell. This shows that higher voltage is more effective at reducing reversible storage losses, presumably by oxidative decomposition of the redox shuttle molecule as proposed by Boulanger et al. 4
Figure 5b shows the corresponding voltage curves, with the voltage drop of the 4.4 V cell being significantly slower than that of the 4.2 V cell.
UHPC experiments with different voltage holds
Figure 6a shows UHPC results at C/20 and 40 °C for LFP/AG CTRL pouch cells that did the same formation procedures as the ones in Fig. 5, i.e., one C/20 cycle at TF = 70 °C followed by either a 4.2 V (dark purple) or 4.4 V (light purple) hold for 14 h at 40 °C.

Figure 6. (a) Ultra-high precision cycling profiles, charge endpoint capacity slippage and CE for LFP/AG CTRL cells after a 14 h voltage hold at 40 °C and 4.2 V (dark purple) or 40 °C and 4.4 V (light purple). The data in (b) are from Boulanger et al. 4 and show the same cells with no voltage hold (black) or a 14 h voltage hold at 70 °C and 4.2 V (green). All cells were formed at TF = 70 °C and C/20 from 2.5 to 3.65 V. UHPC data was recorded at C/20 and 40 °C in the same voltage limits.
Download figure:
Standard image High-resolution imageFigure 6a-1 shows the voltage-capacity curves of the cells. As stated above, the steps in the voltage profiles are due to the staged Li intercalation into graphite. 18 The first discharge step at ∼3.3 V has been used to compare self-discharge rates in Figs. 3, 4, and 5. Figure 6a-1 shows slightly less slippage of the voltage-capacity curves for the 4.4 V cell compared to the 4.2 V cell, indicating lower self-discharge during cycling. Figure 6a-2 quantifies the charge endpoint capacity slippage as a function of cycle number for cells that do a 4.2 or 4.4 V hold. There is less slippage for the 4.4 V cell, indicating lower self-discharge during cycling. Figure 6a-3 shows the CE as a function of cycle number. Consistent with the previous findings, the 4.4 V cell has a higher CE, suggesting less self-discharge during cycling. The UHPC results in Fig. 6a are consistent with the storage experiments in Fig. 5, which showed lower reversible self-discharge for the 4.4 V cell compared to the 4.2 V cell.
For reference, Fig. 6b shows UHPC data from Boulanger et al. for LFP/AG CTRL cells that did formation at TF = 70 °C followed by immediate transfer to the UHPC system (black) or a 14 h 4.2 V hold at 70 °C (green). 4 Note that Fig. 3 includes storage data for LFP/AG cells with an identical formation and voltage hold procedure.
The cell without voltage hold shows the highest charge endpoint capacity slippage and the lowest CE of all UHPC cells, indicating the largest amount of redox shuttle. In contrast, the cell with a 70 °C 4.2 V hold shows the lowest slippage and highest CE, indicating that this procedure is more effective at reducing redox shuttle activity than the voltage holds at 40 °C. These findings are in good agreement with the significantly reduced reversible self-discharge after a 70 °C 4.2 V hold (see Fig. 3).
CVs of coin cells with extracted electrolytes
Figure 7 shows CVs for pristine CTRL electrolyte (blue), CTRL electrolyte extracted from LFP/AG pouch cell after formation at TF = 70 °C (black) and after formation at TF = 70 °C with subsequent voltage hold at 4.2 V for 14 h (green). The electrolytes were filled into coin cells with an aluminum foil working-electrode and a metallic lithium foil counter-electrode. The coin cells did three CV sweeps from 2.6 to 3.75 V vs Li+/Li at 0.1 mV s−1 and 25 °C. The voltage limits are chosen to mimic the voltage window of LFP/AG cells (2.5 to 3.65 V), considering that lithiated graphite is approximately at 0.1 V vs Li+/Li. This experiment was developed by Boulanger et al. to measure the current caused by a redox shuttle molecule in the electrolyte. 4 By using lithium metal as a counter-electrode one can be sure that the redox shuttle molecule can always be reduced. By increasing the voltage of the working-electrode the redox shuttle molecule can eventually be oxidized, so that a redox shuttle current can be measured. CVs of CTRL electrolyte extracted from LFP/AG pouch cells formed at TF = 70 °C (black line) show a clear redox shuttle current. The net-positive shuttling current of almost 3 μA is significantly higher than the capacitive current of +/−0.3 μA with pristine CTRL electrolyte (blue line). Electrolyte extracted from LFP/AG CTRL pouch cells that did a 70 °C 4.2 V hold after formation (green line) shows only ∼0.6 μA, which is significantly lower than the cells without voltage hold and close to the capacitive current of the pristine electrolyte.
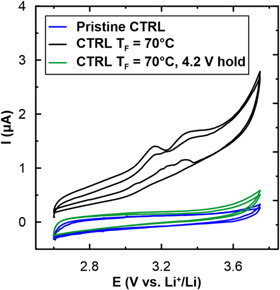
Figure 7. CVs for pristine CTRL electrolyte (blue), CTRL electrolyte extracted from LFP/AG pouch cell after formation at TF = 70 °C (black) and after formation at TF = 70 °C with subsequent voltage hold at 4.2 V for 14 h (green). The cells were stored for 1 week at 25 °C before electrolyte extraction to allow for electrolyte equilibration. All CVs were recorded in Al/Li coin cells at 0.1 mV s−1 and 25 °C. The data used for the blue and green lines are from Boulanger et al. 4
Download figure:
Standard image High-resolution image
Figure 8. Schematic of (a) electrolyte oxidation at the positive electrode and (b) one-electron redox shuttle activity in Li+-ion cells leading to self-discharge. Solid arrows indicate electrochemical reactions and dashed arrows diffusion processes. 4
Download figure:
Standard image High-resolution image
Discussion
Storage loss model
According to Sinha et al. there are four major parasitic reactions that can cause reversible and irreversible self-discharge in lithium-ion cells. 3 These reactions can also occur during galvanostatic cycling or potentiostatic holds, where electrons can flow in the closed external circuit. During OCV storage, however, these parasitic reactions lead to self-discharge.
- 1.Li can be consumed in a chemical reaction between the intercalated Li in the negative electrode and the electrolyte, creating new SEI and leading to a parasitic current (closed circuit) or self-discharge (open circuit). This is an irreversible loss, as the Li is no longer available for intercalation reactions. (Note that the parasitic current at closed circuit might be absent if graphite is on the stage 1 to stage 2 plateau and its voltage does not change as Li is consumed. 18 ).
- 2.Li can be transferred from the negative to the positive electrode to compensate for transition metals that dissolve from the positive electrode and deposit on the negative electrode. Although this is an irreversible reaction, it would appear as a reversible loss in storage experiments because the amount of cyclable Li is not directly reduced.
- 3.Figure 8a shows a one-electron oxidation of an electrolyte component, e.g., EC or common impurities like ethylene glycol (EG), at the positive electrode. Charge is balanced by intercalation of a Li+-ion into the positive electrode. 19 Since the Li+-ion is replaced with Li from the negative electrode it would appear as a reversible loss in the storage experiment, even though it is an irreversible consumption of electrolyte.
- 4.Figure 8b shows a one-electron shuttle mechanism of a redox shuttle molecule, which is created as a dissolved species in the electrolyte. The shuttle molecule, S, can be oxidized at the positive electrode (P) and diffuse to the negative electrode (N), where the oxidized shuttle molecule, S+, is reduced back to its original state. Alternatively, the shuttle molecule could first be reduced at the negative electrode and then be oxidized back to its original state at the positive electrode. If the shuttling process happens continuously in a charged battery at open circuit, e.g., in a charged LFP/AG pouch cell during storage at TS = 60 °C, one Li+-ion would be intercalated into the positive electrode for every one-electron oxidation of the shuttle molecule and one Li+-ion would be removed from the negative electrode for every one-electron reduction of the shuttle molecule. Since the cell is at open circuit, no current can flow in the external circuit; instead, the continuous shuttling process causes the cell to self-discharge. In principle, this parasitic reaction is completely reversible.
Other parasitic reactions are possible, e.g., current collector corrosion, but they are less common and not able to explain the storage results in this work. 3
Reversible self-discharge is caused by redox shuttle
Based on the storage loss model by Sinha et al. 3 and the data shown in the Results section, the actual self-discharge mechanism shall be determined. Only lithium inventory loss (reaction 1) would show up as an irreversible loss in the storage experiments, so the observed irreversible losses are most likely due to SEI thickening. The reversible loss, however, could be due to parasitic reactions 2, 3 and 4. Transition metal dissolution (reaction 2) can be excluded by looking at reversible losses of up to 13.66% for the NMC811/AG CTRL cell in Fig. 4a. Boulanger et al. found negligible amounts of transition metals dissolved in the electrolyte or deposited on the negative electrode for similar cells using the same formation procedure. 4 Hence, the large reversible losses seen in CTRL cells (see Figs. 2, 3 and 4) are not due to transition metal dissolution.
In principle, sustained electrolyte oxidation (reaction 3) could explain a large reversible self-discharge. If all the 70.45% or 143.48 mAh reversible loss of the LFP/AGA CTRL cell in Fig. 2a-1 were due to a one-electron oxidation of EC, it would consume the following number of moles:

This corresponds to an EC mass of

Clearly, this is not possible because there are only 0.34 g EC in our cells filled with 1 ml of CTRL electrolyte. In general, any one-electron oxidation reaction of an electrolyte component is very unlikely to be the cause of reversible self-discharge, since it would consume a high percentage of the electrolyte. For example, a one-electron oxidation of the typical electrolyte contaminant EG would mean that it has to be present at a concentration of
Clearly, this is much higher than typical electrolyte contamination. 20,21 If this were the case, one could measure a change in contaminant signals in gas chromatography mass spectrometry (GC-MS) or nuclear magnetic resonance spectroscopy (NMR), which is neither seen by Boulanger et al. nor Buechele et al. 4,15
By excluding the other three parasitic reactions, it is very likely that the reversible losses during storage are due to the in situ generation of a redox shuttle molecule. Considering that the highest self-discharge rates are observed after high temperature formation and storage and in the absence of effective SEI forming additives, e.g., VC, it is likely that the shuttle molecule is generated by parasitic reactions at the negative electrode. Unwanted redox shuttles have previously been identified as a possible cause of self-discharge in lithium-ion cells. 4,5 A follow-up article by Buechele et al., will focus on the chemical structure of the redox shuttle and its formation mechanism. 15
Redox shuttle concentration increases with TF and is greater in LFP/AG cells
The high reversible losses in Figs. 3 and 4 point to the presence of a redox shuttle molecule in LFP/AG and NMC811/AG cells with CTRL electrolyte formed at 40 °C ≤ TF ≤ 70 °C. The magnitude of reversible self-discharge also suggests that the concentration of the redox shuttle molecule increases with formation temperature. This is in agreement with CV experiments by Boulanger et al. 4 The reversible losses of LFP/AG CTRL cells (see Fig. 3a) are more than 20% higher than those of NMC811/AG CTRL cells (see Fig. 4a). This is consistent with the GC-MS data of Buechele et al. showing that the concentration of shuttle molecule in the electrolyte of LFP/AG cells is indeed higher than in NMC811/AG cells. 15
Oxidative decomposition of the redox shuttle at higher voltage and lower temperature
Figures 3, 6 and 7 show that a 70 °C 4.2 V hold can substantially reduce the redox shuttle concentration in LFP/AG cells. This was previously shown by Boulanger et al. in CV and UHPC experiments with LFP/AG and NMC811/AG cells. 4 While the CTRL electrolyte extracted from LFP/AG cells after a 70 °C 4.2 V hold has virtually no redox shuttle activity in the CV sweeps of Fig. 7 (green line), there is some residual redox shuttle activity in the storage and UHPC experiments of Figs. 3 and 6, even after a 70 °C 4.2 V hold (reversible loss of 18.13%; CE <99%). This apparent discrepancy can be explained by the fact that new shuttle molecules are likely created during the storage and UHPC experiments, which were performed at 40 °C, while there is no shuttle created during the CV experiments at 25 °C.
Figure 3b shows that a 55 °C 4.2 V hold is not able to reduce the redox shuttle concentration. The reversible loss of 47.39% of the LFP/AG CTRL cell is even higher than without the voltage hold (34.05%, see Fig. 3a-1). The same phenomenon is observed for the NMC811/AG cells in Fig. 4b-1 that did a 10 h 4.2 V hold at 40 °C before the OCV period. Again, the reversible losses are higher than for the cells that started their storage at 4.06 V (see Fig. 4a-1). The 40 °C 4.2 V hold cannot reduce the redox shuttle concentration. Instead, the longer charging time needed to reach 4.2 V (23 h charge) instead of 4.06 V (20 h charge) at same C-rate (C/20) leads to the creation of even more redox shuttle. For the storage protocol with 4.2 V cut-off this results in ∼40% more reversible self-discharge (14% vs 10%, see Fig. 4). Consistent with the above hypothesis, Fig. 5 shows that a 14 h 4.4 V hold at 40 °C can reduce the redox shuttle concentration in LFP/AG CTRL cells (16% reversible loss), while a 40 °C 4.2 V hold even increases the redox shuttle concentration (36% reversible loss) compared to a cell which does no voltage hold at all (27% reversible loss, see Fig. 3a).
Conclusions
This study uses open circuit storage experiments with LFP/AG and NMC811/AG pouch cells containing common alkyl carbonate electrolytes to investigate self-discharge after formation at different temperatures. Formation between TF = 40 and 70 °C leads to high reversible storage losses during 500 h at TS = 40 °C. Generally, LFP/graphite cells show higher reversible self-discharge than NMC811/graphite cells. Considering four prominent mechanisms of self-discharge in lithium-ion cells, it was concluded that the in situ generation of a redox shuttle molecule during high temperature formation in the absence of a SEI forming electrolyte additive, e.g., VC, is the most plausible way to explain the high reversible storage losses. A voltage hold after formation can reduce the shuttle-induced self-discharge as indicated by significantly lower reversible storage losses, absence of shuttling currents in CV sweeps and improved metrics in UHPC. The addition of 2 wt% VC can prevent redox shuttle generation and leads to almost zero reversible self-discharge.
Acknowledgments
This work was funded under the auspices of the NSERC/Tesla Canada Alliance Grant program. ERL and AE thank NSERC and The Nova Scotia Graduate Scholarship program for scholarship support.