
Abstract
This paper investigates the modeling, design, and task feasibility of V shape electrothermal actuators. In the first part, the force-deflection governing expressions are derived and the actuator performance is analyzed based on these expressions. The influence of the actuator dimensions and properties on its performance is clarified. In the second part, the task feasibility is further investigated. A performance measure is proposed for evaluating the capacity of the actuator to accomplish required tasks depending on the application. This measure is used for finding a feasible configuration and optimized design. A case study is finally presented, showing very good agreement between analytical model and finite element simulations, and demonstrating the robustness of the task feasibility measure.
Export citation and abstract BibTeX RIS
Since its first demonstration in the late nineties [1], the V shape electrothermal actuator is increasingly implemented in a wide spectrum of applications [2]. This actuator is among the most common actuators in micro- and nano-electro-mechanical systems (MEMS and NEMS) due to its simplicity, monolithic and compliant structure, compatibility with common fabrication processes, large force and displacement relative to other actuators at the same scale, linear motion, parallel stacking to increase forces, scalability, low driving voltage, small size, flexibility of design, easy integration with mechanical and electronic on-chip components, reliability, and long lifetime.
The V shape actuator consists of several thin inclined beams that are designed as expansion elements and are connected symmetrically to a middle shaft (shuttle). This creates a localized output lateral force and/or linear deflection at the shuttle when heating the beams. The output force and deflection are generally controlled electro-thermally using Joule's heating. Other heating modes are also possible, such as convection with a proximity parallel layer [3], using light or directive laser [4, 5], or with the environment temperature [6, 7] (for temperature sensing).
The design of actuators in general is more robust and accurate when it relies on accurate models. Several models were proposed for the V shape actuator in the literature using numerical [8–11] and analytical [12–26] approaches. The advantage of the analytical modeling is in the better understanding of the actuator behavior and the influence of the different parameters on its performance. This leads to an intuitive understanding on how the actuators dimensions can be varied to tune its properties according to the application.
Explicit analytical expressions are provided in this study governing the output force-deflection behavior of the V shape actuator. These expressions are derived based on the snap-through modeling of pre-shaped beams [27], and show very good agreement with finite element simulations. The advantage of these expressions compared to the cited models is in the consideration of all internal and external parameters and phenomena that affect the actuator behavior in practice. This includes the response to electrical input, interaction with external lateral load, and buckling, which leads to a crucial variation in the stiffness of the actuator.
The geometry of the V shape actuator can be chosen based on the intuition of the designer and by trial and error. However, this does not lead to efficient and optimized performance. Few studies [28, 29] presented formal optimization procedure for improving certain characteristics of the V shape actuator. The design optimization of a V shape electrothermal actuator is investigated in this paper from task feasibility perspective and based on the governing expressions from the modeling.
Firstly, the influence of the material properties and geometrical dimensions on the actuator behavior is analyzed. Afterwards, several design constraints related to the limitations on the voltage, temperature, dimensions, and fabrication resolution are elaborated. These constraints have to be considered in the design in order to ensure good fabrication and functioning of the actuator, and to avoid its failure. The task feasibility of the actuator is finally investigated.
The V shape actuator is generally fabricated in a micro- or nano-system to deal with one or limited number of loads. The versatility of changing the application once fabricated is not possible as for actuators at the macro-scale. Thus, a design-to-task approach is generally considered for the design of such actuators. From this perspective, relating the design to the specific task that the actuator is intended to deal with is a main concern.
In the task feasibility analysis in this paper, a performance index, named Z-value, is proposed for measuring the capacity of the actuator to provide the required forces and deflections. As it is developed based on the modeling expressions, the Z-value is also considering the relevant phenomena affecting the actuator behavior.
The rest of the paper is organized as follows. The force-deflection curve and the influence of the different parameters on the actuator performance are analyzed in section 1. Several design constraints, which are necessary for a feasible design, are elaborated in section 2. The task feasibility and optimization are finally investigated in section 3.
1. Force-deflection behavior
1.1. Force-deflection curve
Figure 1 shows top view schematics of a V shape electrothermal actuator in the initial configuration (Figure 1(a)), electrically heated with free load (Figure 1(b)), electrically heated with lateral load (Figure 1(c)), and electrically heated with lateral load and zero displacement at the middle position (figure 1(d)). The actuator consists usually of several V shape beams connected in parallel to a middle shuttle. The shuttle is not shown in figure 1 for clarity.

Figure 1. Schematics of a beam electrothermal actuator (V shape) in different configurations: initial (a), activated with free load (b), with lateral load (c), and at the zero deflection position (d).
Download figure:
Standard image High-resolution imageThe V shape actuator has a span l, in-plane thickness t, initial middle height h, and out-of-plane depth b. The voltage difference between boundaries ( ) is considered as the electrical input. The lateral deflection and load at the middle are denoted δ and f, respectively. f can be seen as the external load or the pushing force generated by the actuator, as both are equal in magnitude. δf
is the free load deflection due to heating (δ = δf
for f = 0), and f0 is the zero deflection load (f = f0 for δ = 0).
) is considered as the electrical input. The lateral deflection and load at the middle are denoted δ and f, respectively. f can be seen as the external load or the pushing force generated by the actuator, as both are equal in magnitude. δf
is the free load deflection due to heating (δ = δf
for f = 0), and f0 is the zero deflection load (f = f0 for δ = 0).
The actuator is usually used for pushing loads in the distance between δ = 0 and δf . Buckling may occur in this range of deflection depending on the electrical input. The f − δ relationship without buckling in this range of interest is expressed as follows:


where E is the Young's modulus, N is a parameter related to the axial force, and V is the normalized electrical input. Λa and Λe are functions of N as follows:


V is related to the beam length expansion due to heating Δsh , and is expressed as follows:

Considering a straight beam electrothermal model with conduction (appendix), V is approximated as follows:

Each value of N in (1) corresponds to one ( ) point. In the range of interest (
![$\delta \in [0,{\delta }_{f}]$](https://content.cld.iop.org/journals/2631-8695/2/3/035035/revision3/erxabb711ieqn3.gif) ), the f − δ expression in (1) applies for
), the f − δ expression in (1) applies for ![$N\in [{N}_{f},{N}_{0}]$](https://content.cld.iop.org/journals/2631-8695/2/3/035035/revision3/erxabb711ieqn4.gif) , whereas N increases monotonically from a minimum Nf
at free load position (δ = δf
) to a maximum N0 at zero deflection position (δ = 0). Nf
is in the range [0,2π], while
, whereas N increases monotonically from a minimum Nf
at free load position (δ = δf
) to a maximum N0 at zero deflection position (δ = 0). Nf
is in the range [0,2π], while ![${N}_{0}=\min [V,4\pi ]$](https://content.cld.iop.org/journals/2631-8695/2/3/035035/revision3/erxabb711ieqn5.gif) .
.
Buckling occurs in the range of interest (![$\delta \in [0,{\delta }_{f}]$](https://content.cld.iop.org/journals/2631-8695/2/3/035035/revision3/erxabb711ieqn6.gif) ) for V ≥ 4π (see figure 1(d)). The f − δ relationship with buckling is expressed as follows:
) for V ≥ 4π (see figure 1(d)). The f − δ relationship with buckling is expressed as follows:

The governing f − δ expressions in (1) and (7) are derived from the modeling of pre-shaped beams [27] after considering axial expansion due to heating, as clarified in appendix. Analyzing these expressions, we can differentiate three f − δ curve forms depending on the value of V, as shown in figure 2.
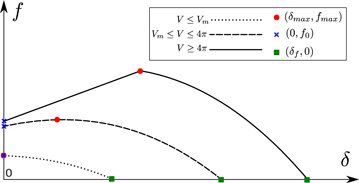
Figure 2. Force-displacement curves for the V shape actuator for different normalized electrical input V. For V ≤ Vm , the output force decreases with further deflection. For Vm ≤ V ≤ 4π, the output force increases slightly and then decreases with the deflection. For V ≥ 4π, the output force increases linearly in the buckling zone and then decreases with the deflection.
Download figure:
Standard image High-resolution imageFor V lower than a certain limit Vm , the pushing force of the actuator decreases with the generated deflection. For higher electrical input (V ≥ Vm ), the pushing force increases to a maximum and then starts to decrease until reaching the free load position. Vm is the root of the following equation:

where Q is the height-to-thickness ratio (Q = h/t).
For higher electrical input (V ≥ 4π), buckling occurs in the range of deflection where the pushing force increases with deflection. From (8), we can deduce that the pushing force only decreases with the deflection without buckling for  . Thus, only two forms for the f − δ curves exist after this value of Q.
1.2. Parameters variation influence
Three points with 4 coordinates (f0, fmax, δmax, and δf ) are mainly constituting the f − δ curve. This curve shows the force-deflection output that can be provided by the actuator. The influence of the material properties and geometrical dimension on the actuator output is analyzed in this part.
Note that, as the V shape actuator is micro- or nano-fabricated, the springback, which is a common effect related to the fabrication of V shape structures at the macroscale [30, 31], is not considered as a parameter affecting the design.
1.2.1. Zero deflection force
The pushing force at zero deflection f0 can be deduced from (2) and (7):

The variation of f0 with V is shown in figure 3.

Figure 3. Variation of the zero deflection force f0 with respect to V. f0 increases monotonically with V and becomes saturated for V ≥ 4π.
Download figure:
Standard image High-resolution image1.2.2. Maximum force
The maximum force point coordinates (δmax, fmax) in the range (![$\delta \in [0,{\delta }_{f}]$](https://content.cld.iop.org/journals/2631-8695/2/3/035035/revision3/erxabb711ieqn8.gif) ) are expressed as follows:
) are expressed as follows:
where (δm
, fm
) are determined by substituting the value of N (![$N\in [0,4\pi ]$](https://content.cld.iop.org/journals/2631-8695/2/3/035035/revision3/erxabb711ieqn9.gif) ) resulting in
) resulting in  into (1).
Figure 4 shows the variation of the maximum force fmax with respect to V for different values of Q.
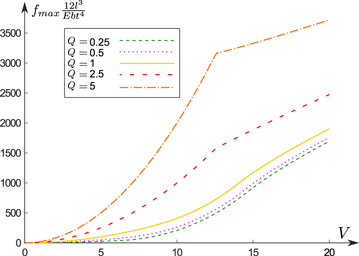
Figure 4. Variation of the maximum force fmax with respect to V for different values of Q. For constant value of t, fmax increases with higher values of Q and h, respectively.
Download figure:
Standard image High-resolution imageNote that the vertical axes in figures 3 and 4 are dependent mainly on the force quantity, but also dependent on dimension and material properties. For specific material and dimensions, these axes can be changed to show only the variation of the force quantity. We keep the parameters in the horizontal and vertical axes in figure 4 independent from h. Thereby, the variation with Q is proportional to the variation with h, while fixing the other dimensions. Hence, figure 4 shows that fmax increases with h, while keeping the other dimensions constant.
1.2.3. Free deflection
The free deflection δf is expressed as follows:

where Nf
is the root of the following equation in the range (![${N}_{f}\in [0,2\pi ]$](https://content.cld.iop.org/journals/2631-8695/2/3/035035/revision3/erxabb711ieqn11.gif) ):
):

Figure 5 shows variation of δf with respect to V for different values of Q. Similarly to figure 4, we keep the parameters in the horizontal and vertical axes in figure 5 independent from h.
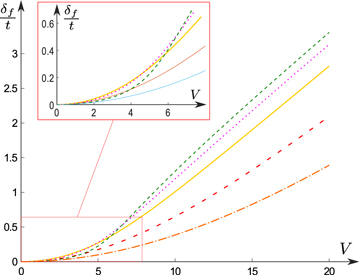
Figure 5. Variation of the free deflection δf with respect to V for different values of Q. The free deflection is higher with lower values of Q, except for low values of V, where the free deflection is higher for certain values of Q. The curves refer to different Q values according to the legend in figure 4.
Download figure:
Standard image High-resolution imageFor a fixed value of t and low electrical input (low V), there is a certain value of Q that maximizes δf , as shown in the inset of figure 5. For higher values of V, increasing h while fixing the other dimensions results in reducing the free displacement of the actuator. The value of Q that maximizes (δf /t) is calculated numerically for each value of V and shown in figure 6.

Figure 6. Variation of Q value maximizing (δf /t) with respect to V. This value of Q decreases with V, and becomes equal to zero at high values of V.
Download figure:
Standard image High-resolution image1.2.4. Summary of the parameters influence
The force and deflection of the actuator increase generally with higher electrical input V and thus with higher length-to-thickness ratio, since V is proportional to l/t (6). The actuator is stiffer with the Young's modulus E and the output force is proportional to the width b. Both force and deflection outputs increase when increasing t and h, while keeping Q constant. However, they vary differently with respect to Q and l. The force increases for higher Q, while it decreases for larger length. In contrast, the deflection decreases for higher Q, while it increases for larger length. For low value of V, the displacement is maximized at certain level of Q. Table 1 summarizes the influence for the variation of the Young's modulus and the dimensions on f0, ftop , δtop , and δf on the f − δ points in the range of interest.
Table 1. Variation of the characteristic curve points with the Young's modulus and different dimensions.
| f0 | fmax | δmax | δf | ||
|---|---|---|---|---|---|
| V < 4π | V ≥ 4π | V ≥ 4π | V ≥ 4π | V≫ | |
| E |

|

|

| _ | _ |
| b |

|

|

| _ | _ |
| t, h |

|

|

|

|

|
| Q |

|

|

|

|

|
| l |

|

|

|

|

|
The arrow  in table 1 means that the corresponding force or deflection level increases with the increase of the corresponding property or dimension. The arrow
  means the inverse. The index next to arrows (such as ↗3 or ↘2) means that the corresponding force or displacement in the column varies with the index order of the corresponding property or dimension in the row. The row for 't, h' shows the variation with respect to t and h while considering a constant ratio between them.
For very high values of V (V≫), the expressions for fmax, δmax, and δf can be further simplified as follows:

2. Design constraints
General restrictions on the actuator geometry and a maximum electrical input should be considered to avoid failure of the actuator during its functioning.
The actuator geometry is characterized by four parameters, including b, t, h, and l. b, t, and l are strictly positive since these are dimensions for a filled-material structure. A zero value of h means that the V shape is actually a straight beam, where the direction of motion is not controllable after heating. Thus, we also limits h to strictly positive values.

The span l is generally much higher than the other dimensions. This keeps valid the small deformation hypothesis considered in the structural modeling. Further, for large length-to-thickness ratio, the electrothermal input V is higher and the actuator deflection/pushing force is amplified.

The fabrication resolution, at the macro-, micro-, or nano-scale, constraints a minimum feature size that can be fabricated properly. This makes a minimum limitation on the thickness t, being the smallest in-plane dimension for a material-filled-structure.

The width b corresponds generally to the thickness of the device layer in the chip or the wafer. The out-of-plane deformation is limited for sufficiently high value of b. The force provided by the actuator is proportional to b. However, if the actuator is dealing with other components in the same device layer, the value of b is not critical for actuation since the forces from these components for in-plane motion (i.e. restoring force, electrostatic force, inertia force) are also proportional to b. In lithography-based fabrication (common in micro- and nano-fabrication), the minimum opening to be etched is usually equal to the minimum feature size, and both are limited by the maximum allowable aspect ratio (i.e. b/t).

In a design context, the maximum performance for the actuator is identified to ensure its capacity to provide the required force and deflection. According to the previous section, the maximum performance is reached considering the highest possible value of V.
One limitation in the functioning of the actuator is the maximum allowable temperature rise  . This limit is related to the material capacity to support high temperature. The relation between the applied voltages and the maximum temperature rise
  induced in the actuator is approximated as follows:

where (19) is calculated based on the electrothermal model of a straight beam [32].
Thereby, the maximum of Δv and V are defined based on the admissible temperature rise  :
:


Note that, as δ and f are proportional to V and EV (14), respectively, a material with higher value of  is able to provide higher deflection, while a material having higher value of
  is able to provide higher forces.
In addition to temperature, the stress inside the actuator should not exceed a certain limit. The stress calculation is not in the scope of this paper. This can be checked with finite element simulations. However, if an actuator design shows high stress value during deflection in its range of interest, this can be relaxed by increasing the dimensional ratio l/t [33].
The temperature and stress limits for the material have to be considered to avoid the fracture and failure of the actuator. A safety factor in the definition of these limits enhances the design robustness. For silicon, the fracture occurs at  stress or higher at room temperature [34, 35]. This varies depending on many parameters, including fabrication conditions, crystal orientation, geometry patterns, temperature, etc [36]. A failure stress around
  is measured on polysilicon structures at 800°C in [37]. Silicon electrothermal actuators keep a proper functioning with temperature and stress limits up to 650°C and
  , respectively.
3. Task feasibility
The V shape actuator is generally designed to deal with a specific task, where a set of force/deflection outputs need to be provided by the actuator. However, there is a lack of a formal measure evaluating the capacity of the actuator to provide the required force/deflection outputs. A task feasibility measure for the V shape actuator is derived in this section. A case study is presented showing the capacity of the task feasibility measure to find a feasible configuration and to optimize other characteristics while ensuring task feasibility.
3.1. Task feasibility measure
The f − δ curves (figure 2) visualize the performance capacity of the actuator in terms of force and deflection for a certain electrical input. The f − δ curve is called as the characteristic curve when considering the maximum electrical input (20). The characteristic curve shows the full performance capacity of the actuator. This means that the actuator is able to move any load fr a certain distance δr , where the point (δr , fr ) lies inside the characteristic curve. Thereby, a design objective/constraint is to expand the characteristic curve to include the required force-deflection points (δr ≥ 0, fr ≥ 0).
Depending on the application, the required force and deflection can be defined at one or several discrete points or in a continuous force-deflection closed area. Figure 7 shows different required points (r1, r2, r3, r4) with respect to the characteristic curve.
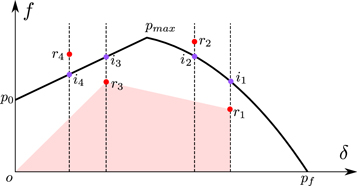
Figure 7. Required force-deflection points with respect to the characteristic curve. o(0,0), p0(0, f0), pmax(δmax, fmax), and pf (δf ,0) are the origin, zero displacement point, maximum force point, and free-deflection point, respectively.
Download figure:
Standard image High-resolution imageThe points r1 and r2 in figure 7 are in the no-buckling zone, while r3 and r4 are in the buckling zone. Let  is the projection of a required point r(δr
, fr
) on the characteristic curve with the same δ position. i1, i2, i3, and i4 are the projections of r1, r2, r3, and r4, respectively. Thereby, an actuator with characteristic curve as in figure 7 is not able to provide required points r2 and r4, since i2 and i4 are below them, respectively. Hence, the feasibility of a point (δr
, fr
) by the actuator can be directly checked as follows:
is the projection of a required point r(δr
, fr
) on the characteristic curve with the same δ position. i1, i2, i3, and i4 are the projections of r1, r2, r3, and r4, respectively. Thereby, an actuator with characteristic curve as in figure 7 is not able to provide required points r2 and r4, since i2 and i4 are below them, respectively. Hence, the feasibility of a point (δr
, fr
) by the actuator can be directly checked as follows:

where δf is calculated from (12), while f(δr ) is calculated from (1) when there is no buckling and from (7) in case of buckling. δf and f(δr ) are calculated considering V = Vmax.
As explained in section 1, the buckling occurs for  & δr
≤ δmax, where δmax is calculated from (10) considering V = Vmax. Subsequently, the following z-value needs to be negative to satisfy task feasibility for one required force-deflection point (δr
, fr
):
& δr
≤ δmax, where δmax is calculated from (10) considering V = Vmax. Subsequently, the following z-value needs to be negative to satisfy task feasibility for one required force-deflection point (δr
, fr
):

where N is calculated from (1) with δ = δr and V = Vmax.
Minimizing the z-value by changing the actuator dimensions leads to increasing  in case δr
> δf
, or otherwise to increase the force provided by the actuator at the required position δr
. In both cases, the characteristic curve tends to expand to contain the required point. The z-value becomes negative when the required point (δr
, fr
) is included in the characteristic curve.
in case δr
> δf
, or otherwise to increase the force provided by the actuator at the required position δr
. In both cases, the characteristic curve tends to expand to contain the required point. The z-value becomes negative when the required point (δr
, fr
) is included in the characteristic curve.
In case the actuator is required to deal with several loads at different positions (i.e. several required points), the z-value (23) needs to be satisfied for each required point. We define Z as the maximum of z considering the different required points. Accordingly, Z needs to be negative to satisfy the required force-deflection points:

where zi is the z value (23) for the ith required point.
Note that, if two points ri
and rj
are required, rj
lies under the line segment [o ri
], then rj
is necessarily feasible if ri
is feasible (i.e. the actuator is able to provide rj
if it is able to provide ri
). Further, as the area below the characteristic curve for positive δ and f (i.e.  ) is convex, if several points are included in this area, then the convex hull of these points is also included in the same area. The origin point o can be considered as a feasible point independently from the actuator performance. Considering these hypotheses, if several points are feasible (including the origin), then their convex hull in addition to the area underneath are also feasible. This can be seen in figure 7, where the red area is feasible as far as o, r1, and r3 are feasible.
Based on the aforementioned, the task feasibility measure is the Z-value (24), which is a maximum of the z-value calculated from (23) for each required f − δ point. This measure can be used to find feasible and optimized configurations for the V shape actuator, as shown in the next parts.
3.1.1. Optimization
Optimization algorithms search for an optimal solution in the space of feasible solutions. Starting an optimization from outside this space does not guarantee finding a feasible solution. Thus, optimization requires the knowledge of an initial feasible configuration, i.e. respecting the different constraints in terms of dimensions and task feasibility.
Based on the feasibility analysis in the previous part, a feasible configuration can be found by minimizing the Z value while varying the geometry within the dimension limits and considering the material properties.

The minimization in (25) can be carried using optimization software. A feasible configuration for the actuator can be found, if the minimization in (25) can lead to a configuration with negative value of Z. Otherwise, if (25) does not lead to a negative value of Z, no feasible configuration can be found within the range of dimensions allowed for the actuator. Recalling that fr is the force required from a single beam of the actuator. If several beams are connected together in parallel, fr is the total required force divided by the number of beams. Increasing the number of actuator beams in parallel is an option if higher forces are required.
Once a feasible configuration for the actuator is obtained, optimizing other aspects relevant to the actuator can be carried, while respecting the dimension limits and the task feasibility (Z ≤ 0). Depending on the application, several objectives can be targeted in the design optimization. The design optimization can target size miniaturization, maximizing output force and deflection, minimizing entropy, faster time response, etc.. The objective function is defined accordingly and the optimization is formulated as follows:

3.1.2. Case study
A case study is presented showing the capacity of the design tools investigated in this study to optimize an actuator characteristic, while satisfying the task feasibility and different constraints. The design objective in the case study is to determine the minimum thickness t for a V shape actuator while dealing with a high load ( ) at small distance (
 ) and smaller load (
 ) at farther distance (
 ) (i.e. required force-displacement points are
  and
and  ). The following parameters are considered: silicon material with
  , temperature dependent α [38],
  ,
,  , fixed width and length
  and
and  , and minimum feature size of
  .
.
Considering these parameters, the design optimization can vary only t and h. Starting from an initial guess of  and
and  , we can deduce from the Z value (24) that the actuator is not able to provide the require points r1 and r2. Thus, a feasible configuration is firstly explored with the method defined in (25).

The value of t and h obtained after running the optimization in (27) are  and
and  . The Z value for this configuration is negative. This indicates that there are feasible configurations for the actuator, respecting the design constraints. Afterwards, the thickness minimization is run starting from the configuration obtained in (27).

The value of t and h obtained from the optimization in (28) are  and
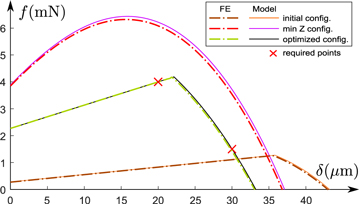
and  . The optimizations in (27) and (28) are carried out using MATLAB software based on sequential quadratic programming algorithm. Figure 8 shows the characteristic force-displacement curve for the initial configuration, minimum Z configuration (27) and the optimal configuration with minimum thickness (28).
Figure 8. Characteristic force-displacement curve for the initial configuration, minimum Z configuration and the optimal configuration. The characteristic curves are obtained from the analytical model and finite element (FE) simulations.
Download figure:
Standard image High-resolution image
The characteristic curves in figure 8 are obtained from the analytical expressions (i.e. (1) and (7)) and from finite element simulations using ANSYS software. The simulations on ANSYS are based on static analysis considering nonlinear large deformation and default solver type. The meshing is based on a tetrahedron planar element type (PLANE223) allowing a coupled structural-thermoelectric field analysis, with a fine mesh size defined with smart sizing function (level 2). The simulations are made in subsequent steps, starting by applying small deflection steps (up to δ > δf ), then increasing the applied voltages to Δvmax with small voltage steps, and finally applying small deflection steps backwards to the initial position δ = 0. This allows simulating the buckling without divergence issues.
The comparison in figure 8 shows a very good agreement between the analytical expressions and finite element simulations. Besides, figure 8 shows that the required points are inside the characteristic curves for the minimum Z and optimal configurations, while it is not the case for the initial configuration. This shows the usefulness and utility of the task feasibility measure provided in this study.
4. Conclusion
A formal task feasibility measure is derived for the design optimization of V shape electrothermal actuator. The governing analytical force-deflection expressions are firstly derived. The variation of the force and deflection with the geometry and material properties is then analyzed. General restrictions on the dimensions and electrical input are also elaborated to ensure good functioning without failure. The task feasibility measure is then proposed based on the force-deflection analysis for finding a feasible configuration and as a constraint for design optimization.
The modeling and design elements developed in this study provide a complete understanding of the actuator behavior, show the capacity and limitations of the actuator, and give insights on how the design can be changed to accomplish different tasks depending on the application.
: Appendix. Derivation of governing expressions
The expressions governing the variation of the actuator output force f with the deflection δ is given in (1) for the case of no-buckling and in (7) for case of buckling. Both f − δ governing expressions in (1) and (7) apply in the range of actuation between zero deflection position (δ = 0) and free load position due to heating (δ = δf ).
These expressions can be derived from the modeling study for the snap-through of pre-shaped beams (without being heated) developed in [27]. Due to electrothermal heating, an additional length expansion due to heating Δsh is added in the calculation of the axial force P. The latter can be calculated with the Hook's law as follows:

where s is the beam length and  is the initial beam length.
The length expansion Δsh is calculated as follows:

where α is the thermal expansion coefficient of the material.
Considering a straight beam electrothermal model with conduction [32], Δsh can be approximated as follows:

where Kp is the conduction coefficient, and ρ0 is the electrical resistivity.
Considering (A.1), the f − δ expressions in (1) and (7) can be derived by following the same procedure as in [27].