


Abstract
The magnetically frustrated manganese nitride antiperovskite family displays significant changes of entropy under changes in hydrostatic pressure near a first-order antiferromagnetic to paramagnetic phase transition that can be useful for the emerging field of solid-state barocaloric cooling. In previous studies, the transition hysteresis has significantly reduced the reversible barocaloric effects (BCE). Here we show that the transition hysteresis can be tailored through quaternary alloying in the Mn3Cu Sn
Sn N system. We find the magnitude of hysteresis is minimised when Cu and Sn are equiatomic (x = 0.5) reaching values far less than previously found for Mn3AN (
 Pd, Ni, Ga, Zn), whilst retaining entropy changes of the same order of magnitude. These results demonstrate that reversible BCE are achievable for p < 100 MPa in the Mn3(A, B)N family and suggest routes to modify the transition properties in compounds of the same family.
Export citation and abstract BibTeX RIS

Original content from this work may be used under the terms of the Creative Commons Attribution 4.0 license. Any further distribution of this work must maintain attribution to the author(s) and the title of the work, journal citation and DOI.
1. Introduction
Barocalorics are emerging as a potential competitor to conventional vapour-compression-based heating and cooling technologies, such as heat pumps, refrigerators and air conditioners. They offer opportunities for greater energy-efficiency without the need for environmentally harmful fluids with high global warming potential. This emerging field has been driven by an ever-increasing catalogue of materials that demonstrate entropy changes with magnitudes comparable to those used in vapour-compression systems [1–4]. However, device engineering challenges have limited the industrial feasibility of this technology due to large pressures required (p > 100 MPa).
This drawback is due to significant transition hysteresis, intrinsic to the first-order phase transitions of many barocaloric materials. As such, understanding and manipulating hysteresis in such materials remains a key challenge.
Although metallic systems display smaller barocaloric effects (BCE) compared to some other barocaloric families, they may combine giant BCE, large thermal conductivity, low thermal hysteresis, tunable transition temperatures and high density. Notable examples of metallic barocalorics include Heusler alloys [5–9], MnCoGe-type alloys [9, 10] and, the focus of this study, manganese nitride antiperovskites (Mn3
AN, where in this case  Ga and Ni) [11, 12]. The latter have received a resurgence of interest due to the variety of unusual functional properties they display, such as an anomalous coefficient of resistivity [13], negative thermal expansion [14], and piezomagnetism [12]. It should be noted here that the Mn3
AN family of materials demonstrate an inverse BCE [15], such that
Ga and Ni) [11, 12]. The latter have received a resurgence of interest due to the variety of unusual functional properties they display, such as an anomalous coefficient of resistivity [13], negative thermal expansion [14], and piezomagnetism [12]. It should be noted here that the Mn3
AN family of materials demonstrate an inverse BCE [15], such that  increases with increasing p. This is in contrast to the conventional BCE, which is characterised by a decrease in
  with increasing p. Recently, giant inverse BCE (hereafter simply referred to as BCE) have been reported in the
  Ga and Ni members of the family [11, 12]. These effects originate from a non-collinear antiferromagnetic (AFM) order born from frustrated spin interactions, which strengthen with changes of volume and via feedback with the underlying electronic structure as magnetic order develops [12]. Coupling between magnetovolume effects and electronic structure leads to a complex and rich mechanism that underpins the strongly first-order AFM to paramagnetic transition and, hence, the giant BCE [12].
Alloying multiple elements onto the A-site of the Mn3
AN family has previously been used as a method to tune their functional properties [14, 16, 17]. Our recent efforts have gone towards tailoring the BCE in Mn3(A,B)N to room temperature whilst maintaining large isothermal entropy changes [18]. Our atmospheric pressure measurements on a sample of Mn3Zn0.5In0.5N suggested that the transition hysteresis was  2 K, however it did not translate to a large reversible barocaloric entropy change. Here we focus on the antiperovskite series Mn3Cu
 Snx
N, which has previously been studied in relation to its anomalous thermal expansion [14]. Interestingly, for this series the x = 0 and x = 1 members go through magnetic transitions with zero concomitant volume change and therefore, no BCE associated with the transition will occur. However, Takenaka et al [14] showed that for
Snx
N, which has previously been studied in relation to its anomalous thermal expansion [14]. Interestingly, for this series the x = 0 and x = 1 members go through magnetic transitions with zero concomitant volume change and therefore, no BCE associated with the transition will occur. However, Takenaka et al [14] showed that for  it is possible to induce a large volume change at the magnetic transition, which is a prerequisite for the BCE. Here we show that (i) large BCE are indeed found in Mn3Cu
 Snx
N and (ii) the hysteresis of the transition is significantly reduced in comparison to Mn3
AN. For the latter, and in contrast to Mn3
AN, we show that the hysteresis is independent of the transitional volume change. This suggests that it may be due to an extrinsic effect and it may therefore be possible to further reduce hysteresis in these materials without compromising the BCE. Taken together, our results show that reversible entropy changes are possible in metallic barocaloric systems at p < 100 MPa.
Snx
N and (ii) the hysteresis of the transition is significantly reduced in comparison to Mn3
AN. For the latter, and in contrast to Mn3
AN, we show that the hysteresis is independent of the transitional volume change. This suggests that it may be due to an extrinsic effect and it may therefore be possible to further reduce hysteresis in these materials without compromising the BCE. Taken together, our results show that reversible entropy changes are possible in metallic barocaloric systems at p < 100 MPa.
2. Experimental
Samples were synthesised using the general procedure previously reported [12, 18]. Mn3CuN and Mn3SnN were individually prepared and then mixed together in the required ratios to form Mn3Cu Snx
N. This final reaction step was performed twice at 1053 K for 40 h with intermediate grindings.
Snx
N. This final reaction step was performed twice at 1053 K for 40 h with intermediate grindings.
Powder synchrotron diffraction data was collected on the I11 beamline (Diamond Light Source, UK) with E = 15 keV ( Å) synchrotron radiation. Data were collected using a 0.3 mm borosilicate capillary to minimise absorption effects (
 ). Temperature-dependent data were collected under continuous heating using the Oxford Cryosystems' 800 Series Cryosteam Plus. Samples were heated at 1 K min−1 while 2 s scans were collected continuously using the position sensitive Dectris Mythen2 detector. Data analysis was performed using GSAS2 [19]. Rietveld refinements were performed using two antiperovskite phases, due to the phase coexistence region, with the phase fraction of each allowed to refine freely and the sum of both set to unity.
Differential scanning calorimetry (DSC) at atmospheric pressure was carried out with a DSC Q100 (TA Instruments). A few tenths of a mg of ground samples were encapsulated in sealed aluminium pans. Ramps on heating and cooling across the first-order phase transition were performed at different rates in the range 2–10 K min−1. Heat capacity data were collected on a 3.09 mg sample using the heat capacity option on a quantum design physical property measurement system, performed isothermally with a temperature rise of 2%, and can be found in figure S1. The sample was fixed to the platform using thermal conductive grease (Apiezon N Grease). The heat capacity of the puck and grease were measured separately as an addenda and were subtracted from the total measured data to obtain the sample heat capacity.
Temperature-dependent calorimetry was performed using a MV1-30 high-pressure cell (Unipress, Poland) adapted as a thermal analyser, and operating from atmospheric pressure to 0.6 GPa and within a temperature range from 205 K up to 393 K. Ceramic samples were directly attached to Peltier modules acting as thermal sensors. Heating and cooling ramps were performed at ∼2 K min−1 using an external thermal jacket attached to a thermal bath (Lauda Proline RP1290). The pressure-transmitting fluid was DW-Therm M90.200.02 (Huber). Calculations of the entropy curves are detailed in the SI.
Magnetic susceptibility data were collected using a quantum design MPMS-3 magnetometer. Temperature-dependent data were collected with varying ramp rates between 1 and 10 K min−1, under an applied field of 0.05 T.
Scanning electron microscopy combined with electron backscatter diffraction (EBSD) and X-ray energy dispersive spectroscopy (EDS) were performed in a Thermo-Fisher Helios G4 dual-beam Xe plasma focussed ion beam instrument. Sintered pellets were polished using wet sandpaper and then finished with 5 µm Al2O3 suspensions on a polishing cloth.
3. Results and discussion
Our study involves samples of Mn3Cu Snx
N with a range of x values between 0.1 and 0.7, however the majority of our data were collected on samples with
Snx
N with a range of x values between 0.1 and 0.7, however the majority of our data were collected on samples with  where the paramagnetic to AFM transition temperature,
  , lies close to room temperature or below. Our results are structured into three parts: (i) characterisation at atmospheric pressure, (ii) determination of the BCE and (iii) discussion.
3.1. Characterisation at atmospheric pressure
The variation of the transition temperature as a function of x, determined using either magnetometry, DSC or X-ray diffraction, is shown in figure 1(a) and is in excellent agreement with previously reported data [14].
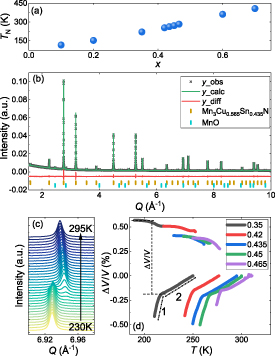
Figure 1. (a) Variation of transition temperature with Sn doping. (b) Refinement of synchrotron powder diffraction of a representative sample (x = 0.435). Vertical lines at the bottom are the calculated Bragg reflections for each phase indicated in the legend.  are the measured data points,
  is the calculated fit and
  is the difference between
  and
and  . (c) Temperature dependent synchrotron diffraction peaks, with temperature steps of ∼2 K, demonstrating the large volume change at the transition. (d) Temperature dependence of the volume change of samples with
  on cooling, relative to the highest temperature measured for each dataset. The dotted lines indicate the region used to determine
  . The dash dot lines indicate the two regions of different thermal expansions (1) within the transition region and (2) outwith the transition region.
Download figure:
Standard image High-resolution imageLab-based x-ray diffraction confirmed the presence of Bragg reflections consistent with the antiperovskite structure for all samples, with a minority phase of MnO that is challenging to eliminate in these materials. Further analysis of the crystal structure was performed for  using powder synchrotron diffraction as a function of temperature. A typical diffractogram and Rietveld refinement is shown in figure 1(b) for the sample x = 0.435. An excellent fit is achieved with the expected antiperovskite structure (
 , Cu/Sn Wyckoff 1a, N 1b and Mn 3c) and the refined fractional occupancies of Sn and Cu were close to the nominal values for all samples (see table S1 in the SI).
Synchrotron data were collected as a function of temperature in order to determine the relative volume change,  , for each sample. A typical thermodiffractogram is shown in figure 1(c), demonstrating a phase transition with a large peak position shift and a phase coexistence region where two clear peaks are evident. The refined volume change,
  , for all measured samples is shown in figure 1(d). All samples demonstrate similar temperature dependence with
  % at the PM-AFM transition However, it is clear that the transitional volume change decreases with increasing x (see table 1), as expected from previous results [14]. A remarkable observation from this plot is that the paramagnetic phase of all samples shows a significantly enhanced thermal expansion in the phase coexistence region (see dash dot lines in figure 1(d)). We had observed signs of similar behaviour in the material Mn3Zn0.5In0.5N, although it was inconclusive [18]. Here, the behaviour is much clearer although its origin remains an open question.
Table 1. Properties relevant to the barocaloric effects of Mn antiperovskites and other metallic barocaloric systems. For the latter, where a number of related materials exist, the member with the lowest hysteresis is shown here. Transition temperature,  ; relative transitional volume change,
  ; sensitivity of the transition to pressure,
  ; thermal hysteresis of materials studied in this work were determined as described in the text,
  ; transitional entropy change,
  ; minimum reversible pressure calculated from the (
 ) phase diagram,
  , as the value for which the endothermic transition temperature is equal to the exothermic transition temperature at atmospheric pressure. Values of
  in parenthesis were estimated from
  according to [20].
 (K) (K) |
 ( ( ) ) |
 (K GPa−1) (K GPa−1) |
 (K) (K) |
 (J K−1 kg−1) (J K−1 kg−1) |
 (MPa) (MPa) | References | |
|---|---|---|---|---|---|---|---|
| Mn3NiN | 262 | 0.40 | 13.5 | 4 | 52 | 600 | [12] |
| Mn3GaN | 290 | 1.00 | −65 | 6 | 22 | (92) | [11] |
| Mn3ZnN | 180 | 1.50 | −70 | 8 | 39 | (114) | [14, 18, 21] |
| Mn3PdN | 290 | 0.20 | −14 | 2 | 30 | 150 | [22] |
| Mn3Zn0.5In0.5N | 300 | 0.9 | −33 | 1 | 37 | 240 | [18] |
| Mn3Cu0.65Sn0.35N | 220 | 0.75 | −42 | 1.3 | 25 | 40 | This work |
| Mn3Cu0.58Sn0.42N | 253 | 0.65 | −40 | 0.5 | 22 | 20 | This work |
| Mn3Cu0.565Sn0.435N | 262 | 0.62 | −39 | 0.5 | 22 | 20 | This work |
| Mn3Cu0.55Sn0.45N | 271 | 0.60 | −37 | 0.3 | 22 | 50 | This work |
| Mn3Cu0.535Sn0.465N | 283 | 0.55 | −37 | 0.4 | 21 | 80 | This work |
| Ni0.85Fe0.15S | 303 | 1.6 | −75 | 11.5 | 53 | (153) | [23] |
| MnNiSi0.61FeCoGe0.39 | 311 | 2.7 | −70 | 4 | 63 | 175 | [24] |
| MnCoGe0.99In0.01 | 310 | 4.4 | −77 | 8 | 52 | (104) | [25] |
| Fe49Rh51 | 310 | 1 | 60 | 10 | 12 | 150 | [26] |
| Ni35.5Co14.5Mn35Ti15 | 249 | 1.6 | 58 | 7 | 40 |
 100 100 | [27] |
| Ni1.99Mn1.37In0.64 | 329 | 0.6 | 19.5 | 4 | 40 |
 250 250 | [7] |
| La1.2Ce0.8Fe11Si2H1.86 | 310 | 1.7 | −260 | ∼1 | — | 50 | [28] |
Atmospheric pressure DSC measurements were performed to investigate the entropy changes at the magnetic transition across the series. The DSC data, as a function of temperature, for samples  are shown in figure 2(a). The transition becomes broader with increasing x, particularly for x > 0.35, indicating increased phase coexistence in these samples. The measured transitional entropy change,
  , as a function of x is shown in figure 2(b). The trend of decreasing
  with increasing x is perhaps expected based on both (i) the increased transition temperature and (ii) the observed trends in both
  and the width of the DSC peak in figure 2(a). Nonetheless, the changes in
  are only 10%–20% across this range of samples, and the absolute value of
  for the x = 0.465 sample is very similar to that found in Mn3GaN (
 J kg−1 K−1, see table 1).

Figure 2. (a) Temperature-dependent DSC measurements on both heating (red) and cooling (blue) for samples with  performed at 2 K min−1. (b) Transitional entropy change,
  , as a function of x in Mn3Cu
 Snx
N, calculated on the data upon heating and cooling from part (a).
Snx
N, calculated on the data upon heating and cooling from part (a).
Download figure:
Standard image High-resolution imageFor all samples, a striking feature of the DSC data in figure 2(a) is the remarkably small hysteresis of the transition. Measurement of the hysteresis was performed by taking data at different temperature ramp rates between 0.5 and 10 K min−1. A linear fit to these datasets allowed extrapolation of the hysteresis to 0 K min−1 (see figure S8). All samples have an extrapolated hysteresis of  K, with most samples having a hysteresis of ∼0.5 K. It is noteworthy that the transition temperature has a weak and linear dependence on the ramp rate (see SI figure S8) which indicates that the transition has a significant athermal character [29]. This is in stark contrast to the plastic crystal neopentyl glycol, which has recently been characterised as a promising barocaloric material [3]. Organic plastic crystals and other barocaloric pure compounds in general show significant isothermal character with a strong dependence of both the peak maximum temperature and peak width on the ramp rate.
To further characterise the samples at a microstructural level we performed EBSD along with EDS on a mechanically polished sample of Mn3Cu0.5Sn0.5N (x = 0.5). An EBSD image with a horizontal field width of ∼100 µm captured over 1800 grains (see figure 3(a)) with a mean grain size of ∼4 µm, demonstrating that particle sizes were relatively large and disordering due to nanostructural effects can be ruled out. EDS data collected across this whole region gives a Mn:(Cu,Sn) ratio of 2.98:1 and a ratio of Cu:Sn of 1.05:1, demonstrating an excellent agreement to the nominal Mn3Cu0.5Sn0.5N composition (N peaks in EDS lie at too low energy for reliable quantification). EDS data collected on a reduced region of ∼100 grains are shown in figures 3(b)–(f). The element with most variation across this region is Cu. From the colour scale in figure 3(c), it is clear that this variation occurs only in small regions ( m), localised between the larger antiperovskite grains. This is further demonstrated by the elemental variation line profile indicated in figure 3(f), which is plotted in figure 3(g). Here one can see that increase in Cu across the regions of smaller grains coincides with a decrease in Mn and little change in Sn; we propose that this is caused by a very small percentage of a separate third phase. The same line profile at the centre of the larger grains shows the expected 3:0.5:0.5 Mn:Cu:Sn ratio within error expected of the antiperovskite phase. Finally, a ternary phase diagram of Mn/Cu/Sn from the EDS data presented is shown in figure 3(h). Here one can see that the distribution of the stoichiometry is centred quite closely on the expected 3:0.5:0.5 Mn:Cu:Sn ratio. The slightly larger distribution in the Mn concentration is due to the presence of MnO particles. Taken together, the EBSD and EDS analyses demonstrate that the stoichiometry is close to that expected and that inhomogeneity in the Cu and Sn mixing between grains is not the cause of the low hysteresis.
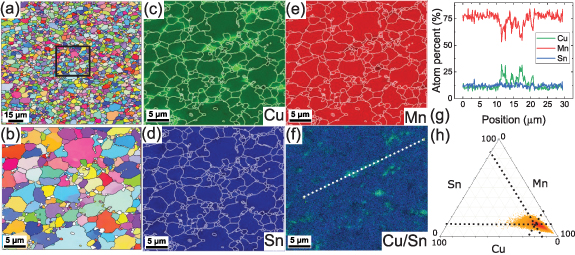
Figure 3. Electron backscatter diffraction images at (a) 1500× and (b) 6500× magnification. The black box in (a) indicates the magnified region shown in (b). (c)–(e) False colour images of the elemental distribution of (c) Cu, (d) Sn and (e) Mn. (f) False colour overlay of the Cu and Sn distributions. (g) Elemental distribution across the line profile indicated in panel (f). (h) Ternary phase diagram for Mn, Cu and Sn. The dotted black lines indicate the ideal 3:0.5:0.5 Mn:Cu:Sn stoichiometry. EBSD and EDS data was acquired at 298 K.
Download figure:
Standard image High-resolution image3.2. Determination of the BCE
We now turn to pressure dependent heat flow measurements in order to explore the BCE. Measurements were performed for samples with  . Representative datasets for sample x = 0.435 are shown in figure 4. The remaining datasets are included in figure S3 and extracted parameters for all samples are provided in table 1. The background subtracted heat flow measurements are plotted in figure 4(a) for applied pressures
  . From these data we can plot the pressure-temperature phase diagram, figure 4(b), which (i) shows that the small hysteresis is maintained at high pressure due to the similarity of
  for endothermic and exothermic transitions and (ii) allows us to calculate the sensitivity of the transition,
  K GPa−1. Extracted from the data in figure 4(a) with the method explained in the SI, the entropy plotted as a function of temperature on cooling and heating is shown in SI figure S4 (see figure S5 for all analysed samples). Finally, using quasi-direct methods [3], we calculate the associated barocaloric isothermal entropy change,
  , and adiabatic temperature changes,
  . For each sample these values are plotted in SI figures S6 and S7.
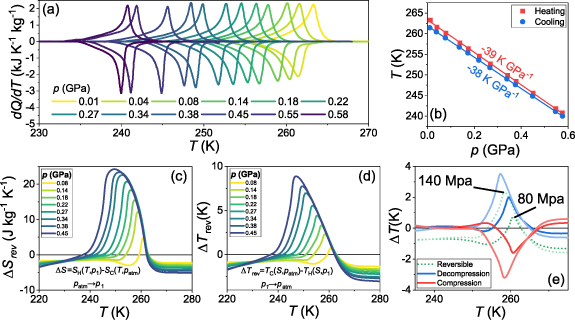
Figure 4. (a) Temperature-dependent heat flow under pressure after baseline subtraction for sample x = 0.435. Pressure-temperature phase diagram for the same sample. The solid lines are a linear fit to either the heating or cooling data, with the fitted  values indicated. (c)–(d) Reversible (c) isothermal entropy and (d) adiabatic temperature changes as a function of temperature. (e) Adiabatic temperature changes on compression (red) and decompression (blue) at p = 80 and 140 MPa. The dotted green lines are the reversible
  values extracted from the compression and decompression plots.
Download figure:
Standard image High-resolution imageThe reversible BCEs are summarised in figures 4(c)–(e). It can be noted that  below the transition is very small (consistent with the nearly inverse behaviour in this temperature interval),
  across the transition is positive upon compression (consistent with the inverse effects due to
  ) and
) and  above the transition is negative upon compression (consistent with the positive thermal expansion of the high-temperature phase). In turn,
  is displayed in figure 4(d) for decompression processes, for which it shows the same sign as
  . Whilst the magnitudes of the BCEs are similar to previously reported values for Mn antiperovskites [11, 12, 22], the low hysteresis demonstrated in these Mn3Cu
 Snx
N samples results in reversible values of
Snx
N samples results in reversible values of  (figure 4(c)) and
  (figure 4(d)) being significantly larger.
Furthermore, we find significant reversible BCE even at pressures below 100 MPa due to the very low hysteresis, as demonstrated in figure 4(e) where  for p = 80 and 140 MPa are shown.
  peaks at ∼1 K and ∼2 K for those pressure values.
3.3. Discussion
We start by discussing the potential mechanisms underlying the low hysteresis of Mn3Cu Snx
N. It is useful to compare our results with other Mn3
AN and Mn3(A,B)N. As has previously been demonstrated, the end-members (x = 0 and x = 1) of the series Mn3Cu
Snx
N. It is useful to compare our results with other Mn3
AN and Mn3(A,B)N. As has previously been demonstrated, the end-members (x = 0 and x = 1) of the series Mn3Cu Snx
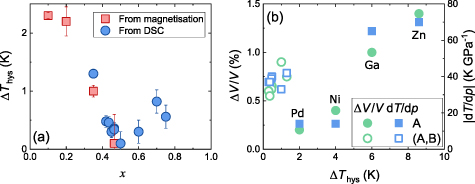
N do not display a 1st-order magnetic transition and therefore no concomitant volume change occurs [14]. As x is increased above ∼0.1, a sharp and large volume change occurs at the transition, which gradually weakens with increasing x although still remains until x = 0.7 [14]. Consequently, one might also expect the hysteresis to decrease with increasing x in this manner. The measured values of the transition hysteresis for all samples are shown in figure 5(a). A reduction of
Snx
N do not display a 1st-order magnetic transition and therefore no concomitant volume change occurs [14]. As x is increased above ∼0.1, a sharp and large volume change occurs at the transition, which gradually weakens with increasing x although still remains until x = 0.7 [14]. Consequently, one might also expect the hysteresis to decrease with increasing x in this manner. The measured values of the transition hysteresis for all samples are shown in figure 5(a). A reduction of  is observed on increasing x from low values, reaching a minimum at
  and then increasing with further x doping. This suggests that
  is not simply linked to parameters related to the strength of the first-order transition, e.g. the magnitude of
  ,
,  or
or  (see table 1). This behaviour is most apparent when plotting
  and
and  against
  , as we show in figure 5(b). Here we can see that for Mn3
AN,
, as we show in figure 5(b). Here we can see that for Mn3
AN,  correlates extremely well with both
  and
and  . In stark contrast is the behaviour of Mn3Cu
 Snx
N, where
Snx
N, where  and
and  are both comparable to those of Mn3GaN and Mn3NiN, yet
  is an order of magnitude smaller. Taken together these results suggest an additional mechanism underlies the x-dependence of
  , unrelated to the magnetovolume coupling. A similar type of hysteresis reduction as a function of composition has been shown in austenite/martensite systems, in which low hysteresis was linked to minimisation of strain between the austenite and martensite phases [30]. Unlike the austenite/martensite system however, Mn3Cu
 Snx
N does not undergo a change in lattice symmetry through the solid–solid phase transition. Nonetheless, it has been shown that Vegard's law is not obeyed in Mn3Cu
Snx
N does not undergo a change in lattice symmetry through the solid–solid phase transition. Nonetheless, it has been shown that Vegard's law is not obeyed in Mn3Cu Snx
N system and an inflection is observed in the data for lattice constant as a function of concentration, x, around x = 0.5 [14]. It was argued that the cause of this was due to magnetic frustration suppressing spin fluctuations above
Snx
N system and an inflection is observed in the data for lattice constant as a function of concentration, x, around x = 0.5 [14]. It was argued that the cause of this was due to magnetic frustration suppressing spin fluctuations above  and therefore reducing the paramagnetic lattice volume. Thus, the magnetic frustration might assist the lattice contraction at
  , facilitating the transition between the two states and therefore reducing the hysteresis. This could be seen as analogous to the strain related mechanism in the austenite/martensite systems. On a fundamental level, investigating the cause of the low hysteresis in Mn3Cu
 Snx
N should be of great interest in the broader context of magnetostructural materials, given that the transitions in many of the materials listed in table 1 are magnetostructural in origin (except Ni0.85Fe0.15S) with largely similar transitional entropy changes.
Snx
N should be of great interest in the broader context of magnetostructural materials, given that the transitions in many of the materials listed in table 1 are magnetostructural in origin (except Ni0.85Fe0.15S) with largely similar transitional entropy changes.
Figure 5. (a) Hysteresis of the paramagnetic to antiferromagnetic transition in Mn3Cu Snx
N as a function of x. Measurements were performed using magnetometry and/or DSC, as described in the text. (b) The transitional volume change and sensitivity of the transition to pressure plotted as a function of the hysteresis for all Mn3
AN and Mn3(A,B)N samples in table 1. Error bars for Δ
Snx
N as a function of x. Measurements were performed using magnetometry and/or DSC, as described in the text. (b) The transitional volume change and sensitivity of the transition to pressure plotted as a function of the hysteresis for all Mn3
AN and Mn3(A,B)N samples in table 1. Error bars for Δ of our Mn
 N samples are smaller than the data point size.
Download figure:
Standard image High-resolution image
We continue the discussion by comparing our results for the Mn3Cu Snx
N series with other metallic barocaloric materials. To do so, table 1 contains
Snx
N series with other metallic barocaloric materials. To do so, table 1 contains  for
for  Ni, Ga and Zn samples measured using the same method, in addition to several other metallic barocaloric systems obtained from recent reviews [1, 2]. From table 1 it is clear that Mn3Cu
 Snx
N materials display the smallest hysteresis among the metallic barocaloric systems studied so far. The only materials with
Snx
N materials display the smallest hysteresis among the metallic barocaloric systems studied so far. The only materials with  of a similar order of magnitude are those of Mn3PdN and La1.2Ce0.8Fe11Si2H1.86 from recent studies [22, 28]. In Mn3PdN, reversible effects are also observed at 90 MPa with
  K. Interestingly, for this pressure the absolute change of
  in our study is ∼2 K, however the peak is reduced due to the different thermal expansion properties away from the transition (see figure 4(c)). In La1.2Ce0.8Fe11Si2H1.86, a key difference is that the hysteresis increases significantly with applied pressure. Nonetheless,
  peaks at 8 K for this material under 100 MPa, although a direct comparison is made difficult due to the use of direct methods (unlike the quasi-direct method used in the present study). However, it should be noted that the Mn3Cu
 Snx
N system has reversibility pressures as low as 20 MPa (based on the (
Snx
N system has reversibility pressures as low as 20 MPa (based on the ( ) phase diagram) for x = 0.42 and 0.435. This is significantly lower than other comparable metallic systems that we were able to identify in the literature.
In general, our results further demonstrate that significant reversible BCE can be achieved in metallic systems driven by moderate pressures of p < 100 MPa. The extremely small hysteresis that can be engineered, combined with other properties such as high thermal conductivity, large density and chemical tunability, makes them attractive for potential applications. Specifically within the Mn3(A,B)N family it has now been shown that the chemical flexibility allows the transition temperature, BCE and now the transition hysteresis to be tuned. However, only a small part of this chemical phase space has been explored and further improvements may be possible.
4. Conclusions
Members of the antiperovskite series Mn3Cu Snx
N were synthesised with a range of different Sn concentrations to investigate their suitability as barocaloric materials. Key barocaloric parameters were extracted from these materials, demonstrating the sensitivity of both transition temperature and thermal hysteresis as a function of x. Furthermore, using high-pressure calorimetry, we demonstrated that these materials exhibit extremely small hysteresis (
Snx
N were synthesised with a range of different Sn concentrations to investigate their suitability as barocaloric materials. Key barocaloric parameters were extracted from these materials, demonstrating the sensitivity of both transition temperature and thermal hysteresis as a function of x. Furthermore, using high-pressure calorimetry, we demonstrated that these materials exhibit extremely small hysteresis ( 1 K) and large BCE (
 20 J K−1 kg−1), under moderate pressures of p < 100 MPa, making them more relevant for commercial purposes. By comparison to other undoped Mn3
AN antiperovskites, we propose that the small hysteresis is likely driven by a mechanism uncorrelated to the transitional volume change, and potentially due to strain matching across the transition. Furthermore, by investigating the microstructure using XRD and EBSD/EDS we are able to rule out antiperovskite phase-inhomogeneity as the cause for the observed low hysteresis. As such, further work is under way to elucidate the mechanism driving low hysteresis in the Mn3Cu
20 J K−1 kg−1), under moderate pressures of p < 100 MPa, making them more relevant for commercial purposes. By comparison to other undoped Mn3
AN antiperovskites, we propose that the small hysteresis is likely driven by a mechanism uncorrelated to the transitional volume change, and potentially due to strain matching across the transition. Furthermore, by investigating the microstructure using XRD and EBSD/EDS we are able to rule out antiperovskite phase-inhomogeneity as the cause for the observed low hysteresis. As such, further work is under way to elucidate the mechanism driving low hysteresis in the Mn3Cu Snx
N antiperovskites.
Snx
N antiperovskites.
Acknowledgment
This work was supported by MINECO Project No. PID2020-112975GB-I00 (Spain) and DGU Project No. 2021SGR-00343 (Catalonia). D B is grateful for support from a Leverhulme Trust Early Career Fellowship (No. ECF-2019-351) and a University of Glasgow Lord Kelvin Adam Smith Fellowship. We acknowledge Diamond Light Source for time on I11. M. Z. (CSC No. 202008310208) thanks the China Scholarship Council for funding.
Data availability statement
All data that support the findings of this study are included within the article (and any supplementary files). Raw data associated with the figures can be found at https://dx.doi.org/10.5525/gla.researchdata.1419.
Supplementary data (3.0 MB PDF)