


Abstract
Metal additive manufacturing (AM) presents advantages such as increased complexity for a lower part cost and part consolidation compared to traditional manufacturing. The multiscale, multiphase AM processes have been shown to produce parts with non-homogeneous microstructures, leading to variability in the mechanical properties based on complex process–structure–property (p-s-p) relationships. However, the wide range of processing parameters in additive machines presents a challenge in solely experimentally understanding these relationships and calls for the use of digital twins that allow to survey a larger set of parameters using physics-driven methods. Even though physics-driven methods advance the understanding of the p-s-p relationships, they still face challenges of high computing cost and the need for calibration of input parameters. Therefore, data-driven methods have emerged as a new paradigm in the exploration of the p-s-p relationships in metal AM. Data-driven methods are capable of predicting complex phenomena without the need for traditional calibration but also present drawbacks of lack of interpretability and complicated validation. This review article presents a collection of physics- and data-driven methods and examples of their application for understanding the linkages in the p-s-p relationships (in any of the links) in widely used metal AM techniques. The review also contains a discussion of the advantages and disadvantages of the use of each type of model, as well as a vision for the future role of both physics-driven and data-driven models in metal AM.
1. Introduction
Additive manufacturing (AM), colloquially known as three-dimensional (3D) printing, of metal parts is the process of manufacturing a metallic bulk part in a layer-by-layer fashion following a computer aided design (CAD). AM techniques provide a number of advantages compared to traditional manufacturing, including the ability to consolidate parts, providing the possibility to manufacture complex geometries with less material waste and a lower cost per part. AM techniques include a realm of processes that commonly include a source of energy such as laser or electron beam. Then, based on the type of substrate used, AM processes are categorized into powder bed or directed deposition. Examples of AM processes include, but are not limited to, laser powder bed fusion (LPBF), directed energy deposition (DED), electron beam melting (EBM), etc. Most popular metallic materials used in AM include titanium, nickel-based, steel, and aluminum alloys.
Depending on the material in use, AM processing parameters are manipulated to yield specific material properties for a given application. AM processes allow the alteration of processing parameters, including the source power, scanning speed, scan strategy, layer thickness, powder size and sieve number (when in use). The large number of processing parameters available and their wide range of options or values make it unrealistic to test for optimal processing parameters experimentally in a trial-and-error process. During the process, each alteration would also result in complicated multiphase and multiscale interaction that would result in different structures (defects and microstructure). The complex AM processes have been shown to result in non-homogeneous microstructures, which are expected to result in variability in the material's mechanical properties. Hence, it is naive to evaluate the process–structure–property (p-s-p) relationships in AM solely by trial and error. Instead, numerical approaches provide a powerful tool in evaluating the p-s-p relationships of a digital twin of an additively manufactured metallic part.
Numerical modeling of the AM processes, resulting structures, and subsequent properties supports experimental studies in the quest for achieving optimal printed parts with tailored properties. Numerical modeling of the p-s-p relationship encompasses two types of approaches: physics-driven and data-driven, as shown in Figure 1. In the physics-driven approach, a more traditional approach to simulate manufacturing processes, the p-s-p relationships are simulated using constitutive equations and mathematical relationships that describe the underlying physics of the problem. Whereas, in the data-driven approach, which has been gaining interest recently as the fourth science paradigm [2–4], available data (from experiments, simulations, or a combination of the two) are used to identify correlations between the selected inputs and outputs needed to model a given phenomenon. A number of studies that have used both approaches to investigate the p-s-p relationship in metal AM (MAM) are reviewed herein. The review article is divided into physics-driven (section 2) and data-driven (section 3) approaches. Under each section, each branch of the p-s-p relationships will be presented separately, followed by the three-way p-s-p relationship. The review is followed by a discussion of the advantages and disadvantages of each approach and recommendations for the MAM community for both approaches moving forward.

Figure 1. Schematic representation of (a) the data-driven and (b) physics driven approaches applied to metal additive manufacturing in an effort to create the digital twins for 3D printed parts. Reprinted from [1], Copyright (2019), with permission from Elsevier.
Download figure:
Standard image High-resolution image2. Review on available physics-driven p-s-p literature
Modeling of the MAM p-s-p relationships requires the integration of phenomena that occur at different associated time and length scales, as envisioned by Francois et al [5] and shown in figure 3. Process modeling investigates phenomena on the mesoscale and macroscale; whereas, structure modeling focuses on the mesoscale and microscale, and performance modeling generally on the macroscale. In terms of techniques used in the physics-driven methods to explore the p-s-p relationships, multiple fundamental relationships for materials are usually implemented, as detailed by Rodgers et al [6] and depicted in figure 2. In this section of the review, physics-driven models are further split by specific links that are made between process and structure (section 2.1), structure and property (section 2.2), and p-s-p (section 2.3) (in which some have modeled directly the link between process and property).

Figure 2. Schematic illustrating the fundamental p-s-p-performance relationship for materials with a focus on simulation tools applicable to AM. Reproduced from [6]. CC BY 2.0.
Download figure:
Standard image High-resolution image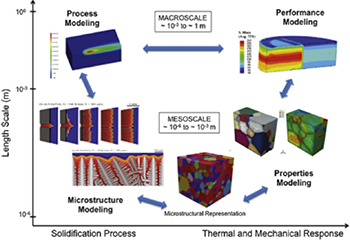
Figure 3. MAM associated time and length scales. Reprinted from [5], Copyright (2017), with permission from Elsevier.
Download figure:
Standard image High-resolution image2.1. Process-structure relationship
Modeling the process-structure (p-s) relationship in MAM involves computational techniques that were established to model traditionally manufactured metals, welding processes that translate to MAM, and, in some cases, specific MAM processes. In process modeling, the physical variables are predicted as a function of space and time during the MAM process. Due to the fact that the MAM process is a multi-scale process, process models can be subcategorized into mesoscale models and macroscale models [7].
Mesoscale models resolve the geometry of individual particles and predict the temperature, pressure, and fluid flow (velocity) field when the source interacts with the particles [8–11]. The calculation of these physical variables is achieved using computational fluid dynamics (CFD) simulations, which numerically solve a set of partial differential equations (PDEs). In order to distinguish the geometry of particles and molten pool, the interface between the metal phase and the gaseous phase needs to be captured. That has been achieved by a variety of interface capturing techniques for multi-phase CFD simulations. Thermo-fluid physics in the building process, such as surface tension, Marangoni effects, laser absorption, and metal evaporation, can be incorporated into the model through special treatment of the boundary conditions and source terms when solving the PDEs. These multiphysics considerations enable the model to predict key physical events, e.g., balling [9–11], keyholing [12, 13] and spattering [14], that lead to mesoscale defects such as lack-of-fusion and porosity [15]. Therefore, mesoscale process models can play a crucial role in quantitatively understanding the formation of these defects.
Macroscale models implement simplifying assumptions of the physics to relieve the computational costs and allow to simulate the building process of an entire part. A major simplification is to treat the metal phase as a continuum without resolving individual particles or the fluid flow in the molten pool [7]. The temperature and stress/strain fields in the part during its building process can be predicted with a thermo-mechanical approach [16]. The macroscale models have shown to predict with considerable accuracy the residual thermal stress/strain after the part is finished [17, 18]. With this predictive power, the macroscale models have been used to optimize process parameters [19]. Compared with mesoscale models, macroscale models are more relevant to solve practical problems but have reduced physical fidelity. The hybrid macroscale-mesoscale modeling approach is a prominent way to balance physical fidelity and practicality [20].
Efforts of structure modeling have been primarily focused on two length scales, mesoscale and microscale. Mesoscale modeling predicts the grain structure resulting from the solidification of the metal, while microscale modeling predicts sub-grain features such as dendrite morphology and phase distribution.
Mesoscale models are used to predict the grain structure in MAM based on either the cellular automata (CA) [21–23] or the Monte Carlo method [24, 25]. The temperature field is a necessary input for the model, and the temperature reduction during solidification is the thermodynamic driving force for nucleation and grain growth to occur. The CA and Monte Carlo methods use different algorithms to predict grain structure evolution based on the temperature information. Each method has its own advantages and disadvantages, and they appear to have comparable popularity in literature. The mesoscale models can reproduce typical grain structures observed in experiments and have shown to capture several key mechanisms of grain structure formation, including the epitaxial nucleation and growth, bulk nucleation, competitive growth, and columnar-to-equiaxed transition. This modeling capability may potentially facilitate the process design to achieve site-specific control of grain structures [26].
Microscale models primarily simulate the evolution of sub-grain microstructure morphologies (e.g., dendrite) and/or phase transformation during solidification based on given temperature history. Phase field is arguably the most widely used method to simulate the sub-grain microstructure evolution for AM processes [27–31]. The method is composed of a set of thermodynamically based PDEs. It is applicable to fairly complex metal alloy systems if the thermodynamic descriptions of the systems are available, usually from the CALPHAD (calculation of phase diagram) database. The computational costs for the phase field are rather demanding, which limits the simulations to relatively small spatial and temporal domains.
2.2. Structure-property relationship
Structure-property (s-p) modeling is based on the use of solid-mechanics models to link structure to properties in MAM. In this case, constitutive equations from continuum mechanics are used to describe the evolution of plasticity and, in some cases, damage. The constitutive equations are solved over the simulation domain using numerical methods like the finite-element method (FEM) or fast Fourier transform (FFT) method. In MAM, efforts have been broadly divided into three types of predictions. In the first one, conventional continuum-based modeling is used to predict mechanical properties of AM structures, disregarding any types of AM defect structures. In the second modeling approach, defect structures (e.g., gas porosity, lack-of-fusion) in MAM are incorporated. In the third modeling approach, the underlying crystal structure of the MAM part is incorporated.
Many researchers have performed s-p predictions for AM parts by neglecting the process modeling and excluding any defects and crystal structure resulting from the AM process, thereby treating the part as a conventional, continuum domain absent voids. In an application to lattice components, a number of investigations simulated the mechanical response of AM lattices [32–34] by modeling the geometry of the component, treating each strut as a material continuum. Specifically, Hedayati et al [33] investigated the fatigue behavior of an open-cell lattice component with AM Ti-6Al-4V mechanical properties using FEM. Similarly, work by Andani et al [34] compared experimentally measured and simulated elastic moduli of NiTi open-cell lattice components with a user material subroutine in Abaqus. Another recent effort in which researchers modeled the mechanical response of an AM component treated as a continuum is highlighted in the Third Sandia Fracture Challenge [35–44]. In the challenge scenario, participants were tasked with predicting ductile fracture in an AM 316L part geometry containing multiple internal features, including angled channels, a hole, and a large void. Most of the participants modeled the AM material as a continuum, neglecting to explicitly include details like pore structure, surface roughness, and grain structure, which were provided. Because most of the mechanical response of the AM part was governed by the large-scale geometrical features of the part, many of the teams were able to perform reasonably well in the blind challenge, despite neglecting to model the p-s-p relationships explicitly.
In the second type of modeling approach to investigate the s-p link, multiple efforts have incorporated defect structures in the MAM structure. A number of studies simulate the stress distribution over synthetic grain and/or pore structures under certain loading conditions and predict the effective mechanical properties of the simulated materials [45–47]. In the context of the Sandia Fracture Challenge, one team [44] accounted for AM-induced pore structure in their solid–mechanics simulations. The team leveraged x-ray computed tomography data (which was provided to all participants) to initialize an element-wise value of a damage parameter based on the local pore volume to element volume by juxtaposing the tomography data with a finite-element mesh as shown in figure 4. Another effort [42] adopted a similar constitutive model to incorporate the effects of AM-induced void defects in their predictions with more accurate prediction results. In another effort, Erickson et al [48] established a new, unique descriptor of pore structures that shows a promising relationship with a variety of mechanical properties. The new descriptor is based on a radial distribution function that takes into account the sizes, clustering, and locations of pores within a specific part. The maximum value of the radial distribution function (or the location of the maximum value) was shown to have a stronger correlation with ultimate tensile strength, elongation, toughness modulus, and fracture location than any of the pore metrics previously reported in the literature.

Figure 4. Flowchart describing the algorithm used to generate random samples of initial porosity and convert it to initial void-volume faction. Probability density of pore diameter, and a sample of the quarter symmetry challenge specimen geometry with void volume fraction initialized by random porosity. Reprinted by permission from Springer Nature Customer Service Centre GmbH: [Springer Nature] [International Journal of Fracture] [44] (2019).
Download figure:
Standard image High-resolution imageFinally, there have been recent efforts in physics-driven, s-p modeling to incorporate the crystal structure of the AM material into predictions of mechanical properties. Work by Ozturk and Rollett [49] provides an example of modeling the s-p relationships using statistically representative volumes of AM Ti-6Al-4V microstructures. The microstructural instantiations were created in DREAM.3D [50] using grain-scale statistics for AM Ti-6Al-4V from the literature. Subsequently, an elasto-viscoplastic FFT code was used to simulate the full-field micromechanical response and corresponding homogenized stress–strain curve of each volume. In another approach, Ahmadi et al [45] simulated an AM microstructure by repeating a melt-pool geometry with a grain structure generated via Voronoi tessellation. They predicted the effective stress–strain response of the polycrystalline domain using finite-element modeling with cohesive elem-ents along the melt-pool interfaces and compared the results to experimental observations. Likewise, Andani et al [46] used a similar grain-structure model but investigated the response of representative volume elements of interest within the simulated microstructure. While the above works consider a simulated AM microstructure in the mechanical simulation, none used physics-based process modeling to predict the microstructure. The accuracy of all s-p predictions described in this section hinged upon rigorous selection and calibration of the material constitutive model(s) used to represent the mechanical behavior of the AM material, which is further discussed later in the manuscript.
2.3. Process-structure-property relationship
In MAM, the investigation of the p-s-p relationships is not limited to the three-way relationship paradigm. A number of efforts bypassed the (micro)structure prediction, and the physics-based model was used to predict, for example, the thermal history during the process followed immediately by a prediction of the residual stress field and part distortions [51–54]. In the work by Johnson et al [52], the transient temperature field was first solved over a finite-element mesh for a 304L stainless steel tube manufactured using laser engineered net shaping (LENS). Output from the thermal model was then used to predict the thermo-mechanical strain as a function of temperature-dependent material properties and, finally, the residual-stress state was predicted using an assumed constitutive model.
While the above modeling efforts focus on modeling either the first link, last link, or bypass the structure link in the p-s-p lifecycle, there are modeling approaches that capture the complete lifecycle from process to mechanical properties for MAM. In this area, Yan et al [47] implemented a framework that, given the processing parameters, predicts using FEM a number of mechanical properties (e.g., yield strength and fatigue) of the simulated microstructure. The process (powder bed flow, heat transfer, and fluid flow) and structure (grains and voids) are modeled and incorporated into the framework. Rodgers et al [6], used direct numerical simulations to simulate tensile loading on multiple hollow cylindrical structures with synthetic microstructures ranging from equiaxed to columnar grains (by changing the processing parameters, namely the scan speed). The 3D, synthetic voxelized microstructures were generated using the kinetic Monte Carlo method. The resultant microstructures were mapped onto a highly refined conformal FE mesh of a part geometry. A grain-scale anisotropic crystal elasticity model was then used to represent the constitutive response of each grain. In a similar framework, detailed in figure 5, Herriott et al [55] implemented a parallelized elasto-viscoplastic FFT model to predict the spatial variability of the yield strength and elastic modulus throughout different MAM build domains, exemplified for SS316L DED build volumes. To achieve that, four microstructural volumes, ranging from fully equiaxed to columnar, were predicted using process modeling (viz., the CA method) to mimic different combinations of processing parameters in the DED process. Then, the full-field mechanical response of microstructural subvolumes extracted from multiple layers of interest within the simulated build volumes was predicted using EVPFFT. Later, the full-field response of each subvolume was homogenized, and stress–strain curves of each subvolume were extracted and analyzed for values of the elastic modulus and yield strength. Finally, the homogenized mechanical properties were plotted using contour maps to investigate their location-specific variability with respect to the laser scan tracks.

Figure 5. Physics-driven framework developed by Herriott et al to investigate the process–structure–property relationship in MAM. Reproduced from [55]. © IOP Publishing Ltd. All rights reserved.
Download figure:
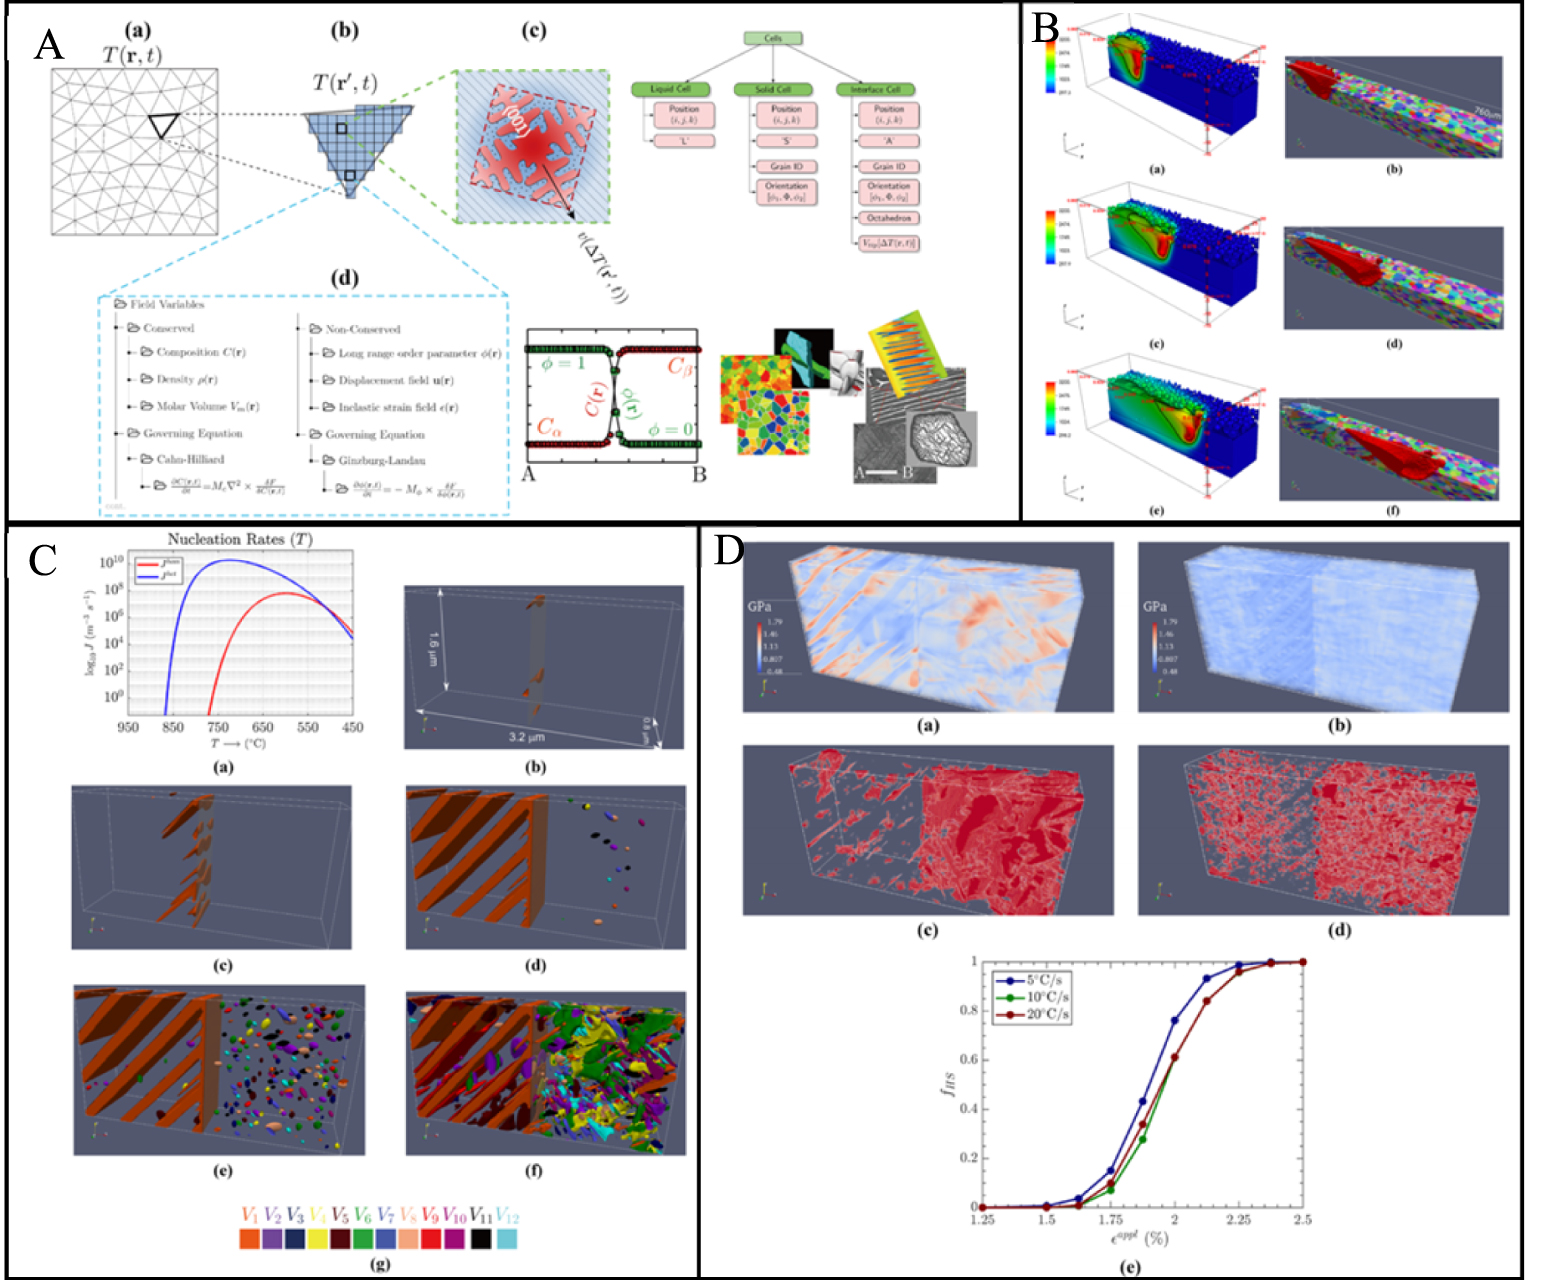
Standard image High-resolution imageMore recently, Shi et al [56] established a physics-driven framework to establish the p-s-p relationships and tested it on a Ti-6Al-4V single-track LPBF system. The framework consists of a high-fidelity, powder-scale, 3D simulation of transient heat transfer and melt flow dynamics (figure 6(B)), a CA simulation of solidification grain structure and texture, phase field modeling of precipitation and dissolution of second-phase precipitate during repeated thermal cycles as presented in figure 6(A), and microstructure-based micro- and mesoscopic elastic response calculation (figure 6(D)). The framework was capable of simulating concurrent nucleation, growth, and coarsening of the equilibrium phase in a bicrystalline matrix (figure 6(C)).


Figure 6. Outputs from sections of the p-s-p framework implemented by Shi et al [56]. (A) Microstructural prediction based on the interaction among (a, b) an arbitrary Lagrangian–Eulerian-based powder-scale model to predict spatiotemporal evolution of thermal history, (c) CA model to simulate solidification grain structure evolution (size as well as orientation), and (d) a quantitative PF model to predict the subgrain/intragranular solid-state precipitate microstructure. (B) Time snapshots showing the evolution of thermal profile (left column) and grain structure (right column) at t = 327 s, t = 647s, t = 967 s. The laser scan speed is 500 mm s−1, moving to the right with a power of 75 W. (C) (a) Rates for both homogeneous nucleation and heterogeneous nucleation of phase as function of temperature; (b)–(f) precipitation upon cooling from 950 °C to 700 °C at a rate of 5 °C s−1: (b) 860 °C, (c) 855 °C, (d) 770 °C, (e) 765 °C, (f) 740 °C; (g) Color scheme for all 12 variants. (D) Microstructure-based elastic response calculations: computed von Mises stress profiles in Ti-64 two-phase microstructures under for cooling rates of (a) 5 °C s−1 and (b) 20 °C s−1; spatial distribution of the identified stress hotspots (i.e., > yield strength) for the microstructures formed at the cooling rates of (c) 5 °C s−1 and (d) 20 °C s−1, and (e) evolution of hotspot volume fractions () with increasing . Reprinted by permission from Springer Nature Customer Service Centre GmbH: [Springer Nature] [JOM Journal of the Minerals, Metals and Materials Society] [56] (2019).


Download figure:
Standard image High-resolution imageSome other approaches have combined both physics-driven methods combined with experimental support, which are not discussed in the current review. An extensive review of those efforts are detailed by Smith et al and can be found in [57].
Physics-driven approaches provide a number of advantages and disadvantages that are discussed in detail in section 4. Another approach to model the p-s-p relationship in MAM is data-driven models, which predict the p-s-p relationships of MAM by correlating the expected properties to build conditions (e.g., laser processing parameters, location of a part on the build plate, gas flow in the printer, etc.) that uniquely define the manufacturing process. Such models utilize specific data-driven techniques such as machine learning or data-mining algorithms, for example, to establish the p-s-p relationships and are capable of predicting the behavior of metal components that are manufactured using specific processing parameters without the need to explicitly identify the constitutive model governing its behavior.
3. Review on available data-driven p-s-p literature
With the availability of various types of materials-related data (mostly big data from different sources), there has been a natural advancement in data-driven modeling techniques as a major area of research in materials science. Data-driven modeling in materials science encompasses the overlap of the domain knowledge in materials science, mathematics and statistics, and computer science and technology (figure 7). The generation of big data used in these techniques is characterized by the 'five V's' (volume, velocity, variety, veracity, and value), as detailed in figure 7. Data-driven techniques in the investigation of the p-s-p relationships in MAM are a very attractive approach.

Figure 7. (Left) Data science as an integrative discipline. Reproduced from [82] with permission of The Royal Society of Chemistry. (Right) Big data characteristics known as the 'five V'. Reproduced from [83]. CC BY 2.0.
Download figure:
Standard image High-resolution imageData-driven materials modeling addresses the need to extract high-value information from many and diverse data sources—from modeling-derived data (e.g., from density functional theory (DFT), phase field, CALPHAD, and a range of continuum models), to experimentally derived data (e.g., mechanical, structural, chemical, or thermal analysis) [58]. Algorithmic optimization of materials, using heuristic algorithms—such as genetic algorithms [59] or particle swarm optimization [60]—or using machine learning algorithms—such as Gaussian process regression (GPR) [61], artificial neural networks (ANNs) [62], or kernel ridge regression [63], require materials data to be featurized. Featurization is the process of extracting parameters (features) from experiment [64, 65], literature [66], or modeling/simulation data [67–69]. In the context of MAM, data-driven approaches have been used in the investigation of the p-s-p relationships to support the integrated computational materials engineering (ICME) effort of the scientific community in understanding the links between each of the branches for MAM digital twins.
In the terminology of machine learning, structure, in the paradigmatic process–structure–property relationship of materials science, represents a latent space. A stable, correlative relationship between process and properties is all that is required in many practical applications. Although the complexity of the process–property models are often better served by the explicit inclusion of structural information through modeling or experiment, such as CALPHAD, phase field, DFT, microscopy, or x-ray diffraction, data-driven algorithms provide a mathematical and modeling framework to identify process–property correlations that implicitly account for structure. The microstructure of AM parts is complicated by the thermal history of the additive process. As a result, only the most basic parts have a well-characterized microstructure [26], but AM is amenable to exploration of a broad process–property space through high-throughput sample fabrication and mechanical testing.
Data-driven methods that are used in the investigation of the p-s-p relationships in MAM include an array of techniques that mimic human intelligence, also known as artificial intelligence. The most widely used techniques under artificial intelligence are machine learning models that include classification, regression, clustering, and dimensionality reduction. Another subcategory of machine learning falls under deep learning, which incapsulates neural networks, as represented in figure 8. In the subsequent section, recent efforts that focus on any of the branches of the p-s-p relationships using data-driven techniques will be reviewed. As in the previous section 2 on physics-driven models, the links in this section are divided into the relationships between process and structure (section 3.1), structure and property (section 3.2), and p-s-p (section 3.3).

Figure 8. Hierarchical description and techniques examples of artificial intelligence and its machine learning and deep learning subfields. Reproduced from [83]. CC BY 2.0.
Download figure:
Standard image High-resolution image3.1. Process-structure relationship
The prediction of the p-s link in MAM using data-driven approaches is still at its infancy due to the complexity of the problem and the multiphase, multiscale processes involved. Data-driven methods have been used to uncover the p-s relationship by predicting phase formation in the microstructures of traditionally manufactured metals. In fact, phase formation and microstructures are predicted by mapping thermal processing using continuous cooling transformation (CCT) and time–temperature–transformation (TTT) diagrams. Primarily, artificial intelligence techniques have been employed to predict CCT curves [70–72]. Initial efforts by Wang et al [72] trained an ANN to using 151 CCT diagrams to predict the diagrams of class Fe-xC-0.4Si-0.8Mn-1.0-Cr-0.003P-0.002 S (x within 0.1 through 0.6) steels. Similarly, Dobrzański et al [71] trained a neural network using 400 CCT diagrams made for structural and machinable steels. The model takes as inputs the chemical composition and austenitising temperature and predicted the temperature of the beginning and the end of transformation as a function of cooling rate, the chemical composition, and the hardness of steel cooled from austenitising temperature with a fixed rate which then allow to predict the CCT diagram of the material. Using a similar approach, Trzaska et al [70] trained a neural network and combined it with regression methods to predict the CCT curve for steel with a known chemical composition. The method allowed the analysis of the influence of particular elements on the characteristic points and transformation curves of the supercooled austenite using a set of 300 experimental data sets that are available in the literature. The CCT and TTT diagram of AM metals, however, have been shown to be different from their traditionally manufactured counterparts. Moving forward, the aforementioned approaches could be adapted to MAM processes and used in the prediction of the p-s relationship in MAM.
In the context of p-s linkage for MAM, Popova et al [73] presented a workflow, reproduced in figure 9(A), that can be applied to augment computational materials science using data science approaches. The authors also suggested a general workflow template that could be used to establish the p-s link, as shown in figure 9(B). The blue boxes describe the general steps to achieve that (data pre-processing, microstructure quantification, dimensionality reduction, and extraction/validation of the p-s relationship), while the white boxes present examples of methods that can be used to achieve each. In a specific application of the framework to MAM, the authors established a microstructural descriptor (chord length) on a synthetic microstructure and established the p-s link using distribution calculation, principal component analysis, and multivariate polynomial regression methods. In a different approach, Wang et al [74] successfully trained a two-level surrogate model based on 280 thermal simulations and 150 grain growth simulations to predict temperature profile and materials microstructures. The authors quantified the sensitivity of the material microstructure to specific heat capacity and grain growth activation energies and its uncertainty quantification and presented optimal combination of process parameters for EBM Ti-6Al-4V.

Figure 9. Workflow template for establishing process-structure linkages using a data science approach. (A) A schematic description of the workflow typically employed in current computational materials science efforts (top row) and how this can be augmented with a data science approach to recover computationally low-cost, high-value p-s-p linkages of interest to materials innovation efforts. (B) Workflow template for establishing p-s linkages using a data science approach. Blue boxes describe general steps while corresponding white boxes list example methods that can be used within a step. Reprinted by permission from Springer Nature Customer Service Centre GmbH: [Springer Nature] [Integrating Materials and Manufacturing Innovation] [73] (2017).
Download figure:
Standard image High-resolution imageData-driven approaches have been also used to identify microstructural features and defects in MAM structures using in situ data. Combining acoustic emission (recorded using a fiber Bragg grating sensor) and training a neural network, Shevchik et al [75, 76] performed in situ quality monitoring in MAM to identify the formation of porosity during the build, as presented in figure 10. The inputs to the neural network were the relative energies of the narrow frequency bands of the wavelet packet transform, and the outputs of the models provided a classification of the build quality of the layer of interest with accuracy around 83%–89%. In a different approach for the classification of in situ defect formation, other studies focused on the use of visual data and image processing techniques. For example, Scime and Beuth [77, 78] and Caggiano et al [79] employed classification techniques in identifying defects such as keyhole-induced pores and balling from in situ process images. Both investigations implemented convolutional neural networks to identify and classify the types of defects in the printed layer. More details of the employed techniques can be found in the flowcharts in figures 11(A) [79] and (B) [78]. Other classification efforts focused on the identification of microstructural features [80] and identifying feedstock powder source and type for AM metals [81] based on images of the microstructure.

Figure 10. Scheme of the AM quality monitoring and analyzing system using acoustic data. The workflow is as follows: an acoustic signal is emitted during the AM process and captured by sensors; an SCNN model is finally applied to the recorded data to distinguish whether the quality of the printed layer is adequate or not. Reprinted from [75], Copyright (2018), with permission from Elsevier.
Download figure:
Standard image High-resolution image
Figure 11. Data-driven methods used in the identification of defect formation using optical imaging data. (A) Flowchart of the Bi-stream DCNN for recognition of defects induced by improper SLM process conditions employed by Caggiano et al [79]. Reprinted from [79], Copyright (2019), with permission from Elsevier. (B) the machine learning process implemented by Scime and Beuth [78] for in situ classification of defects. Reprinted from [78], Copyright (2018), with permission from Elsevier.
Download figure:
Standard image High-resolution imageAfter printing, MAM parts have been shown to exhibit geometrical deviations post solidification compared to the intended design (CAD model). Such deviations in the geometry from the initial design may limit the certification and qualification of MAM parts, especially in applications where qualification requirements are stringent. To control the geometrical fidelity of MAM parts, Koeppe et al [84] trained a neural network based on FEM simulation results of MAM cell structures to predict load-displacement curves and maximum stress, which were validated using experimental results. The neural network was then used to reproduce the loading history of the FEM simulation and later as a substitute for the physics-driven simulations.
3.2. Structure-property relationship
Fewer efforts have been invested in the exploration of the s-p relationship in MAM using data-driven approaches as compared to the physics-driven approaches. In an effort to comprehend the s-p link, Gupta et al [85] proposed a general data-driven framework to investigate the aforementioned branch as detailed in figure 12. The framework consists of three steps that start with the generation of a calibration dataset consisting of representative microstructures (either from measurements or generated synthetically) and their subsequent mechanical response (from an established physics-based numerical model, or experimental results). The second step consists of extracting objective, reduced-order (based on principal component analysis), quantitative measure(s) of the microstructure. In the third and final step, the s-p linkages are established using regression methods and then validated using leave-one-out-cross-validation. The authors evaluated the framework on non-metallic inclusions/a steel composite system and compared it to results from conventional linkage techniques. The results demonstrated high accuracy of the surrogate model that was based on the data-driven framework compared to the conventional approaches. Moving forward, the presented framework could also be applied to s-p data that is available in the MAM literature to establish those linkages.

Figure 12. Main components of the data-science approach utilized by Gupta et al for establishing structure-property linkages. Reprinted from [85], Copyright (2015), with permission from Elsevier.
Download figure:
Standard image High-resolution imageIn a different approach, recent efforts applied machine learning techniques to predict the mechanical properties of given metallic microstructures [86–88]. Even though these efforts have been presented for non-additively manufactured materials, the approaches present powerful tools for potential applications in MAM. In the first effort, Jung et al [86] employed the GPR method to predict the full-field response of two-phase microstructures generated with periodic boundary conditions using DREAM.3D. Over 1100 different synthetic microstructures were used to predict the uniform elongation, ultimate tensile strength, and strain localization index defined in the soft phase of each microstructure and later validated using another 1000 microstructural instantiations. The accuracy of the surrogate model was calculated as relative error from finite element simulation results and showed that as little as 40 training points were enough to decrease the error between the surrogate and finite element models to less than 1%. The authors also employed the Efficient Global Optimization method, a Bayesian optimization technique that utilizes an expected improvement algorithm to maximize an unknown black-box objective function to predict the optimal microstructure in the dual phase steel to result in the targeted material properties. The results were shown to predict with high accuracy using a relatively low number of inputs. In a different approach, Mangal and Holm predicted the formation of stress hotspots in face centered cubic materials [87] and hexagonal close packed materials [88] under uniaxial tensile deformation by integrating full-field crystal plasticity-based deformation models and machine learning techniques as summarized in figure 13. In both studies, synthetic microstructural data were generated using DREAM.3D [50]. The local micro-mechanical fields under uniaxial tensile deformation were then simulated using a 3D full-field, image-based, FFT technique, and stress hotspots were defined as grains having stress values above the 90th percentile of the stress distribution. Then, hotspots were characterized using metrics that reflect local crystallography, geometry, and connectivity. The data were used to create input feature vectors to train a random forest learning algorithm, which predicted the grains that will become stress hotspots. Other work, tailored specifically towards MAM, have also investigated hotspots in build structures with respect to the processing parameters.

Figure 13. Data-driven frameworks utilized by Mangal and Holm to predict hotspots in (A) FCC materials. Reprinted from [87], Copyright (2018), with permission from Elsevier. (B) HCP materials. Reprinted from [88], Copyright (2019), with permission from Elsevier.
Download figure:
Standard image High-resolution imageIn a similar approach tailored towards MAM, Herriott and Spear [89] utilized the results from their p-s-p framework discussed in section 2.3 to establish a data-driven model that predicts the s-p link in four AM SS316L build domains exhibiting vastly different microstructures. The main purpose of the data-driven method is to omit the high cost and computational time associated with the crystal-plasticity physics-driven method. To predict the s-p relationship, machine-learning (Ridge regression and XGBoost) and deep-learning (convolutional neural networks) models were trained using microstructural inputs as features and the effective mechanical properties (calculated from the full-field response resulting from the crystal plasticity FFT method) as targets. Output predictions of the effective yield strength in a certain loading direction were then tested for build layers that were omitted from the training set of different MAM build domains. The results were compared to a reference property map (generated using the physics-driven model). An example of the output from the machine- and deep-learning models are presented in figure 14. Among all of the data-driven models tested, the deep-learning models that use crystal orientation as the primary input significantly outperform all other models considered, achieving an R2 value upwards of 0.86 in blind predictions of the holdout layers for two different MAM build domains. Furthermore, the deep-learning models offer the benefit of requiring very little pre-processing and feature extraction, instead allowing the model, itself, to extract relevant higher-level features from the microstructural image data. In all cases, the data-driven approach was capable of predicting the properties in a matter of seconds once trained.

Figure 14. Comparison of property maps (viz., effective yield strength in the transverse direction) models for the holdout layer indicated in Build Domain D, predicted by: (A) different machine-learning models trained with 33–35 microstructural descriptors: (a) for reference, property map generated using crystal-plasticity modeling; (b) ridge regression, excluding Mmicro from training set; (c) ridge regression, including Mmicro in training set; (d) XGBoost, excluding Mmicro from training set; (e) XGBoost, including Mmicro in training set. Both models are able to recover the banded pattern present in (a). (B) Deep-learning models: A–(a) for reference, property map generated using crystal-plasticity modeling; (b)–(e) CNNs with grain ID as the main feature in the training data; (f)–(i) CNNs with quaternion as the main feature in the training data. Auxiliary features used to train each model include: (b),(f) none; (c),(g) one-hot vector representing the global loading direction; (d),(h) Schmid factor; (e),(i) micromechanical Taylor factor. Vertical black lines correspond to laser scan tracks. Reprinted from [89], Copyright (2020), with permission from Elsevier.
Download figure:
Standard image High-resolution imageIn another application that is based on the use of structure data, Kantzos et al [90] trained a convolutional neural network to predict stress concentration of rough surfaces, which are detrimental to fatigue life of MAM parts. The model was trained using the elasto-viscoplastic FFT stress field results of a database of 512 synthetically generated surface height maps (figures 15(A) and (B)) that mimic the surface roughness of AM metals and predicted the strain energy metric for each surface. The images were augmented to 1536 data points by performing transformations on the data (rotations and mirroring), and the results showed that the convolutional neural network was able to achieve predictions with an R2 value around 0.75 over surfaces that were unknown to the trained model (figure 15(A)). One interesting contribution of this work is the integration of a 'viewpoint' within the convolutional neural network for better interpretability by looking at the activation of the second convolution layer, as shown in figures 15(B)(d).

Figure 15. (A) Graphs showing the prediction of the strain energy metric for the 1536 training images in (a), the 128 reserved validation data, and the 64 test images. The R2 value for each image is shown in the title of the graph. The high R2 value for the test images (0.75) suggests that the CNN is capable of predicting the stress concentration metric for surfaces it has never seen. (B) Example of a single image. Section (a) shows the scaled and padded height map, and the stress field is shown in section (b) with the corresponding stress concentrations shown in (c). Section (d) shows the activation of the second convolution layer (Conv2), where the bright areas correspond to the stress concentrations shown in (c). Reprinted from [90], Copyright (2019), with permission from Elsevier.
Download figure:
Standard image High-resolution imageIn a review of the efforts undertaken by GE, Aggour et al [91] detailed GE's current efforts to implement artificial intelligence and machine learning methods to manufacturing techniques (both traditional and additive) to support design, processing, and inspection. In terms of MAM, GE presented a framework utilizing probabilistic machine learning and intelligent sampling and optimization protocols, coupled with high-throughput printing, testing, and characterization tools to accelerate process parameter development for LPBF MAM [92]. The process optimization framework was tested on the crack-susceptible Nickel-based alloys used in high temperature locations of aircraft engines. The protocol is based on a Bayesian hybrid model [93, 94], which utilizes a Gaussian process to develop a predictive, data-driven modeling technique, and the GE intelligent design and analysis of computer experiments, as shown in figure 16. The initial model is built with key inputs that are dependent on the processing parameters in use (e.g., laser power, scan speed, hatch spacing, and beam spot size), along with initial constraints and experimental results. In addition to predicting mean values of the model response, the data-driven model also provides uncertainty in the model response. The uncertainty data is then used to iteratively identify new process parameter combinations for test coupons and builds. The framework has been used to minimize the model uncertainty or optimize quantities of interest such as porosity and mechanical properties and was shown to improve with increasing number of iterations. Using these tools, LPBF AM process parameter development cycle time has been reduced by about four times, as shown in figure 16(B) (from [95]), leading to significant savings in material cost, labor, and machine resources compared to traditional design-of-experiment methods. In a different application of part repair using AM, GE used machine learning to define toolpaths (physical path through which the spray nozzle moves when applying material) during a cold-spray process to improve yield and reduce manufacturing time and cost. To perform the repair, GE incorporated artificial intelligence to guide the 12 degree-of-freedom robotic arm movements and allow the robotic arm to adjust in situ to deliver high quality builds of parts such as aviation airfoils. Furthermore, GE shares their experience where the cold-spray deposition process may be improved by incorporating in situ 3D scanning of the deposition surface to intelligently modify the toolpaths on the fly, completing the deposition process more quickly using less material.

Figure 16. (A) Framework of the protocol outlining the process of using the GE Bayesian hybrid model (GEBHM) and the GE intelligent design and analysis of computer experiments (GE-IDACE) in process parameter development for additive manufacturing. (B) Example application of the GEBHM/GE-IDACE-based process parameter optimization framework for a hard-to-process superalloy. (a) The plot shows an initial design of experiments (DoE), which is space-filling and uninform (no models are informing the DoE). The red triangles in the next figure are suggested by the GE-IDACE based on the GEBHM model built on the blue circle data set. Defects in the as-built part were measured after each DoE. (b) As noted, the DoE 2 reduced the model uncertainty by 5% but did not suggest any datapoints that met the target defect criteria. (c) In DoE 3, the green points are suggested by GE-IDACE based on the model built on the blue circles and red triangles. The authors have added more information through the GEBHM models that by DoE 3 and saw further reduction in model uncertainty (close to 25%) and also identified a parameter space window where more than 65% of the datapoints met the defect criteria, showing the power of the GE-IDACE methodology of performing experimental design. [91] © Cambridge University Press. Reprinted with permission.
Download figure:
Standard image High-resolution image3.3. Process-structure-property relationship
To establish the p-s-p relationships for MAM, Yan et al [96] proposed a vision for the use of a data-driven multi-scale multi-physics framework, detailed in figure 17. The framework aims at quantitatively predicting the working performance of the final MAM products from given manufacturing parameters for a range of AM technologies (EBM, LPBF, and LENS) by combining process modeling, mechanical modeling, and data mining. The inputs to the model are derived from physics-driven models for all three links (process, structure, and property). Data mining is then used in a cycle of design–predict–optimize, and the preliminary results were validated experimentally. In the future, real-time monitoring is envisioned by Yan et al as a means to validate the numerical models.

Figure 17. Data-driven multi-scale multi-physics modeling framework for AM employed by Yan et al [96]. Reprinted by permission from Springer Nature Customer Service Centre GmbH: [Springer Nature] [Computational Mechanics] [96] (2018).
Download figure:
Standard image High-resolution imageIn another effort, Wang et al [97] employed a physics-informed data-driven surrogate model applicable for MAM EBM technique. Surrogate models for each of the process, structure, and property links were trained using data from physics-driven results. Namely, the meltpool was simulated using FEM (280 thermal simulations), grain growth was modeled using the phase-field method (150 grain growth simulations), and the properties were predicted using the FFT crystal plasticity method (150 elasto-viscoplastic FFT simulations) as shown in figure 18(A). The authors then trained a Gaussian process model to serve as a surrogate model for each of the levels (process, structure, property) and tested the model quality using leave-one-out cross-validation, figure 18(B). Even though the authors communicated the difficulty of generating the thermal surrogate model that is a high-dimensional response, results were shown to capture the temperature fields with reasonable accuracy (figure 18(C)). The final step of Wang's framework [97] consisted of uncertainty quantification using a brute-force Monte Carlo approach, from process to property estimates. Sensitivity analysis was applied to a test case of EBM Ti-6Al-4V alloy, as summarized in figure 18(D). More details about the uncertainty quantification can be found in [97].

Figure 18. Details from the physics-informed data-driven investigation by Wang et al [97]. (A)Schematic of the framework proposed, (B) schematic illustration of the training of the surrogate model, (C) comparison of the temperature fields from the physics-driven and data-driven results, (D) schematic illustrating the sources of uncertainty introduced at different levels and uncertainty propagation. Reprinted by permission from Springer Nature Customer Service Centre GmbH: [Springer Nature] [JOM Journal of the Minerals, Metals and Materials Society] [97] (2019).
Download figure:
Standard image High-resolution image
As it is clear from the previously presented works, the scientific literature provides a wealth of modeling, simulation, and experimental data that captures the processing, structure, and properties of materials. Mining this information from the literature requires the development of a number of tools [98]. Using these tools, data-driven techniques provide a powerful means to learn from 'prior experience'. Extracting information from the literature, Liu et al [99] built a GPR model to correlate process conditions (i.e., laser power, laser speed, hatch spacing, layer thickness, and powder size) across seven laser powder bed machines to density and microhardness of the finished part. Then, using this model, they predicted the build conditions necessary to achieve target densities and microhardness on a build platform that was not part of the original training data. This is one of many studies that leverage existing information in the scientific literature to map process–property relationships directly [99–101].
It is worth noting that another category of data-driven models, models not captured in this review, and not feasible to implement using physics-based models but worth mentioning due to their implementation using data-driven approaches, are property–property models. That is, models that use measurable properties, such as yield strength or springback, to model and predict qualitative properties (e.g., formability and rollability). An example of these efforts, which have not yet been implemented for AM materials, have looked at formability or rollability [102–105].
4. Discussion
At the highest level, physics-driven and data-driven models in MAM share a similar objective: to predict, for a given set of AM process conditions, the resulting material microstructure and/or mechanical response of the material. However, the manner in which this is achieved by each type of model is fundamentally different, leading to advantages and disadvantages for each of the modeling approaches. The advantages and disadvantages of both physics-driven and data-driven models used in predicting the complex p-s-p relationships in MAM are summarized in table 1 and detailed in the following discussion.
Table 1. Advantages and disadvantages of physics-driven and data-driven approaches in the prediction of the p-s-p relationships in MAM.
| Physics-driven models | Data-driven models | |
|---|---|---|
| Advantages |
|
|
| Disadvantages |
|
|
Despite their common aim, fundamental differences exist between physics-driven and data-driven approaches. Physics-driven modeling approaches require a set of governing constitutive equations that represent the physical phenomena underpinning the process, structure, and property relationships. Numerical solvers are then used to solve the governing equations over some finite domain, which can be expensive and therefore preclude exploration of a high-dimensional MAM design space. As discussed in depth by Lindgren and co-workers [51, 106], the proper choice of constitutive model (and corresponding material parameters used within each constitutive model) is imperative to making accurate predictions for both welding and, by extension, MAM. On the other hand, the training algorithms underpinning many data-driven models, including machine-learning models, are designed to handle problems for which the governing equations relating inputs to outputs are typically unknown a priori but rather inferred through the correlative relationship between the control (input) variables and the response (output) variables.
Both types of modeling approaches require that the parameters embedded within the models are calibrated; however, the calibration procedure is different between the two approaches. For physics-based models, parameter calibration is generally performed in either an ad hoc manner or by an estimation algorithm (for further discussion, see work by An et al [107]). Some parameter values can be obtained from (pre-calibrated) values in the literature; while others might be calibrated through either trial-and-error or optimization processes until satisfactory comparison with some experimental or ground-truth measure. On the other hand, the parameters embedded within a data-driven model (e.g., the weights and biases within a machine-learning model) are calibrated using a formalized process known as 'training', through which the parameters are iteratively adjusted. For example, neural networks are typically trained/optimized with some form of a gradient-descent algorithm.
Another difference between physics-driven and data-driven modeling approaches is in their treatment of probabilistics and uncertainty. In physics-driven models, the resulting solution to a set of governing constitutive equations for a single simulation typically provides a deterministic prediction, whether of a microstructural volume, a residual-stress field, or a full-field mechanical response. Of course, owing to the inherent randomness that can be injected at different stages (e.g., the assignment of random crystal orientations to grain-nucleation points during prediction of the phase-transformation process), one could, in theory, run many deterministic simulations to populate a statistical model. In practice, this is generally intractable due to the computational cost to perform even a single multi-scale, multi-physics numerical simulation. On the other hand, data-driven models rely on the correlative relationship between the independent variables (inputs) and the dependent variables (outputs), using statistical tools to solve for this correlative relationship, tools built on point estimation, hypothesis testing, and statistical inference. Hence, many types of data-driven models (e.g., Bayesian networks) account inherently for probabilistic predictions and various sources of uncertainty.
Even though physics-driven models face a high computational cost that could be avoided using data-driven models, the latter methods are susceptible to bias and brittleness, depending on the type and amount of data used in training. A biased data-driven model is one that fails to capture the trends present in the data set used in training and as a result may lead to inaccurate predictions. On the other hand, a brittle model (in analogy to metalworking) is one that is less malleable to a wide range of data besides the assumptions made over the training data. Therefore, a brittle model may be easily fooled if those assumptions are not stated, hence not met by the input data. As a result, while using data-driven models, one should maintain a good judgment of the validity and limitations of the model in terms of its original formulation.
While physics-driven models have a more explicit and obvious representation of the governing physics, data-driven models—if trained using an appropriate data set—might encode the physics through a more implicit and hidden representation. For example, if a data-driven model is trained using experimental data for which the training input and output have some fundamental physical relationship among them, then it is possible that the data-driven model could learn to predict the output accurately 5 , even though it has no explicit knowledge of the governing constitutive relationships. Because data-driven models do not include an obvious representation of the physics, the lack of interpretability of their predictions is perhaps the biggest source of criticism of data-driven approaches, and they tend to be regarded as 'black-box' models. A recent article by Holm entitled, 'In defense of the black box' [108], presents a rational explanation for the use of such models in specific applications. For example, the black box method can be used where the cost of a wrong answer is low relative to the value of a correct answer, where a machine can perform a monotonous task, or where the black box can actually produce similar or even better results than experiential judgment.
Both data-driven and physics-based models will play key roles in realizing the ICME approach for design of MAM. Despite the criticism of data-driven models as black boxes, the use of data-driven approaches will likely play a key role in linking process to structure to property for MAM, given the high dimensionality of the MAM design space, the inherent uncertainty associated with MAM, and the computational expense of integrating p-s-p linkages using purely physics-based approaches. The rapid-prediction capabilities of data-driven models make them especially attractive for high-throughput predictions, AM-parameter optimization, and real-time AM-process monitoring [77, 109]. As Francois et al [5] point out in their article highlighting challenges and opportunities for modeling p-s-p-performance in AM, 'To be useful, the predictions must be able to be run in a reasonable amount of time while retaining sufficient physics fidelity so as to yield trustworthy results'. Similarly, the development and use of physics-based models will continue to play a key role in MAM by providing improved scientific understanding of the fundamental relationships between AM processes, structures, and properties and by providing 'ground-truth' predictions to assess the predictions made by data-driven models.
4.1. Potential for future work
Both physics-driven and data-driven modeling approaches result in the generation of big/rich data. With the wealth of data in the scientific community comes a growing challenge of data storage, management, and sharing, especially for data relevant to AM. Materials informatics, which accelerate materials, products, and manufacturing innovations, is the way forward in facilitating materials innovation, as detailed in the discussion by Ramakrishna et al [110]. With the availability of the large datasets, a number of databases (such as Citrination [111], the AM Materials Database developed by NIST [112], and the Materials Commons repository by PRISMS [113]) are available to the scientific community to store and share scientific materials data. This list is not exhaustive but is intended to offer examples of how the community is handling data storage and curation. More efforts are needed in unifying and sharing data via established materials databases.
A new paradigm of theory-guided data science was introduced by Karpatne et al [114], in which physics-driven knowledge and data science are integrated to leverage the potential of data science in the advancement of materials discovery. The strength of ICME is the ability to incorporate physics-based modeling data into data-driven models [67, 115–119]. In the specific application of predicting p-s-p relationships for MAM design, output from physics-driven model predictions for MAM digital twins can be used as training data for a data-driven model; in which case, the latter could be trained to predict the relevant output, despite not having explicit access to the governing equations. In turn, the forward predictions from trained data-driven models could be used to inform subsequent iterations of physics-driven models. In this way, data-driven and physics-driven models are not mutually exclusive but can be used to inform each other.
Combining both approaches will allow the physics-driven approaches to support the interpretability of results from the data-driven techniques, revealing the contents of the black box or even making it slightly less opaque. Outputs from the physics-driven models used as inputs to the data-driven models may provide larger sets of input data for training based on governing physics. In turn, the interpretability of the data-driven modeling results may support in formulating more sophisticated governing equations to be used in the physics-driven models in support of the digital twin of MAM parts. The understanding of the p-s-p relationships in the digital twins of MAM parts is ultimately indispensable to the exploration of the MAM design space, which is not feasible solely through experimentation. The exploration of the process design space of MAM will enable the process optimization and the production of parts with specific material properties for a given application to enable qualification and certification of MAM parts.
Acknowledgments
N.K., B.K., and A.D.S. would like to acknowledge support from the Department of Defense—Office of Economic Adjustment under Award No. ST1605-19-03. X.L. and W.T. wish to gratefully acknowledge the partial financial support provided by the National Science Foundation under Grant No. CMMI-1752218.
Footnotes
- 5
Data-driven models are inherently unable to account for bias that might exist in the training data set.