

Abstract
Based on a specifically designed stretching apparatus, we study the incidence of the stretching parameters on the formation of polypropylene-polyamide-6 (PP-PA6) copolymers acting as adhesion promoters in PP/PA6 multilayer films. The stretching apparatus mimics the stretching conditions found in the air gap of a co-extrusion machine in terms of stretching velocities and distances and of cooling rates. We propose a simplified numerical modeling of these experiments. It allows to explore how the various molecular (concentration in reactive species, diffusion coefficient) and stretching parameters affect the time evolution of the copolymer surface density during stretching. More precisely, we show that even though the contact time for the reaction is large regarding the reaction time, a dilation of the surface can result in a strong lowering of the grafting density at the interface.
Export citation and abstract BibTeX RIS

Original content from this work may be used under the terms of the Creative Commons Attribution 4.0 license. Any further distribution of this work must maintain attribution to the author(s) and the title of the work, journal citation and DOI.
1. Introduction
Multilayer films are used in packaging to achieve specific performance requirements in a cost-effective manner [1–3]. Assembling the mulitlayers represents, however, a challenge, essentially because most of polymer pairs are not miscible. A consequence of the non-miscibility is that the polymers put into contact do not interdiffuse, which leads to a poor adhesion. Enhancing adhesion requires an optimization of a specifically designed interfacial layer. A common solution to optimize the adhesion at such interfaces it to use diblock copolymers, such made that each block is compatible with one of the materials in contact [4, 5]. The copolymers have mainly two roles. First, they decrease the interfacial surface energies between the two materials acting as surfactants which self-organize at the interface [6, 7]. Second, if long enough to entangle with both sides of the interface, they strongly enhance adhesion as it has been extensively demonstrated in the past, both for glassy and for semi-crystalline polymers [8–13]. In the case of semi-crystallin polymer, the co-crystallization of the polymers at the interface also increases adhesion.
Multilayer polymer films are often produced by co-extrusion [14]. Two main types of compatibilization are generally used. The first one is physical and obtained by introducing a diblock copolymer, in which each block is compatible with one of the two polymers. The second type is chemical, and the copolymer is produced in-situ during the extrusion by an interfacial reaction between layers. For practical reasons, the second solution is industrially chosen. This is due to the fact that the diffusion process of yet formed copolymers from the bulk towards the interface is a too slow process, compared to the time during which the different polymers are molten and in contact inside a co-extrusion machine [15]. Understanding how the flow conditions imposed in a co-extrusion line affect the interfacial reaction rate then appears as a crucial question to optimize the process parameters and efficiently produce multilayer polymer films with both good mechanical properties and good continuity of the layers [16–18]. Moreover, the interfacial region can present some interesting characteristics from a mechanical point of view. It is often referred to as the interphase whose thickness can reach tens of nanometers [16, 19–23].
In the past, we developed a technique to characterize the density of copolymer formed at the interface and adhesion tests which allowed us to study the correlations between copolymer surface density and adhesion at polypropylene (PP)—polyamide 6 (PA6) interfaces [10, 11, 24–27]. The PP-PA6 assemblies were formed in the lab, by molding techniques, with rather long annealing periods, and without any flow . More recently, we have developed new ways of annealing PP-PA6 assemblies made of rather thin films to characterize the interfacial reaction rate, and to establish that, in the absence of flow, the time open for the interfacial reaction in a typical co-extrusion line was sufficient to reach the saturation of the interface in copolymer molecules [24]. On the contrary, the grafting density of copolymers at real interfaces made in coextrusion was always lower than the one expected for saturated interfaces. This was due to a competition between grafting and dilution at the interfaces during the elongational flows in the extrusion process. If numerical approaches allow one to quantify the increase of the area of interface as a function of the extrusion parameters, an important question still remains open: is there a noticeable influence of the flow conditions on the interfacial reaction? This could for example accelerate the copolymer formation when the flow lines tend to transport the precursor molecules towards the interface more efficiently than diffusion? It has been reported recently that compressional flows could drastically increase the reaction rate, by factors more than ten times [25–27].
The question of the link between the density of copolymer at the interface and the process is of major importance since reactive systems are used for many practical systems. Coextrusion is a widely used industrial process to obtain multilayer films commonly employed in varied applications, such as food packaging [28–31], the medical area [32], and recently in microelectronic and nonlinear optics with more than thousands of layers [17, 21, 23]. A new recent fundamental question is related to the relationship between the molecular characteristics of the interfaces and some observed instabilities that occurs during extrusion [16].
We report here the results of systematic experiments aimed at characterizing the role of elongational flow on the interfacial reaction at PP/PA6 interfaces, along with a numerical modeling of these data, through diffusion—convection and trapping by chemical reaction at the interface. The paper is organized as follows: in a first part, we present the materials and methods we have developed to produce assemblies with heating and cooling kinetics representative of the co-extrusion process. We also briefly recall how we dose the formed copolymers. We finally present the apparatus we have developed to stretch thin films assemblies previously formed without flow at saturated copolymer grafting densities, with drawing ratios and drawing times representative of what happens for co-extruded films in the air-gap. In the second part, we present the results obtained in this stretching apparatus, and demonstrate the importance of the flow induced grafting during the elongational stretching of the films, for stretching conditions (rates, stretched distances and thermal conditions) representative of what happens in the air gap of a co-extrusion machine. We finally model these data, based on numerical solutions of coupled diffusion—convection equations, in order to shade some light on the competition between copolymer formation and dilution due to increased area of the interface.
2. Part I: materials and methods
2.1. Materials
The polymers used in the present work have been described in detail in [24]. We only recall here their main characteristics. The PA6 was Ultramid B3 from BASF, with an average of one—NH2 per chain. For this polymer, the gel permeation chromatography (GPC) in hexafluoroisopropanol gave Mw = 33.8 kg mol−1 and ĐM = 1.9. We used an isotactic PP samples provided by Total Petrochemicals. The maleic anhydride functionalized PP, (PPg) was provided by ARKEMA. A blend of a low weight fraction of PPg (Mw = 70 kg mol−1) in a PP matrix (Mw = 310 kg mol−1) that we name L1 in the floowing, was prepared in a twin-screw extruder. The total fraction of Maleic Anhydrid in the blend was 330 ppm. Films of this blends were then extruded to obtain films with thicknesses in the range 20–100 μm.
2.2. Characterization of the surface density of copolymers
To determine the surface density of copolymers actually formed at the interface Σ, we used x-ray spectroscopy (XPS) in a way very similar to previous investigations on the same PP/PA6 system. The method, developed by Boucher et al [11], involves selective dissolution of the PA6 part of the sandwich film with three baths of formic acid, followed by a treatment with trifluoroacetic anhydride in the gas phase followed by hydroxylation in de-ionized water. The selective dissolution of the PA6 was achieved using several solvents and reactive materials: Formic acid (Normapur®, purity > 99%) and dichloromethane (analysis grade, purity > 99.9%) were purchased from VWR, trifluoroacetic anhydride (purity > 99%) was from Aldrich while n-heptane (Purex PA) and absolute ethanol (PA-Purex) were from Carlo Erba. They were used as received. All glass flasks were cleaned using Piranha solution (1:1 sulfuric acid (95*%–97%, VWR-Merck for analysis) and 30% hydrogen peroxide (VWR)) for 15 min, rinsed with cascaded de-ionized water and then dried under nitrogen flux.
After the selective dissolution of the PA6 layers, all samples were stored under controlled argon atmosphere in glass flasks previously cleaned in piranha mixture, and were analyzed by XPS within 7 d of preparation, in order to minimize possible oxidation of the nanometric PA6 layer remaining on top of the PP layers before the XPS analysis. This remaining non-dissolved PA6 only comes from PA6 chains having reacted at the interface to form copolymer molecules. Its amount was quantified through the nitrogen/carbon ratio dosed by XPS. The XPS spectra were collected with a SSX-100 Surface Science spectrometer using a monochromatic source (Al Kα1, hν = 1486.6 eV.). Survey scans between 0 and 1100 eV were first collected on each sample to check for surface contamination. The 1 s spectra of carbon and nitrogen were then recorded on a clean area of the sample and used to estimate Σ, through:

With NA Avogadro number, ρPA6 the mass density of PA6, Mn its number average molecular weight, λ the mean free path of N 1s photoelectrons, and θ the takeoff angle (35°). IC, IN, I∞C, and I∞N are respectively the intensities of the carbon and nitrogen peaks for the analyzed sample and for a thick PA6 film. The reproducibility of the Σ determination was approximately ±10% [11, 24].
2.3. Preparation of the multilayer films
In order to investigate the grafting kinetics in the presence of elongational flow (see part III below), we have chosen to fix the initial conditions before stretching, using samples with interfaces initially saturated in copolymers. In order to be able to reach large enough stretching ratio, rather thick sandwiches made of three layers, PA6/PP—PPg blend (L1)/PA6 were prepared following a protocol first described by Laurens et al [33], that we briefly detail here. A vacuum chamber, equipped with a heating plate is used in a first step, in order to establish a good contact between the three polymer films involved into the sandwich, avoid as far as possible oxidation of the polymers, and start the grafting reaction. The polymer films are first deposited inside a brass mold. The cover of the mold is screwed at a controlled torque, to ensure applying a slight pressure on the films, expelling the air bubbles present at the interfaces. As schematically shown in figure 1, two Teflon films are intercalated between the mold and the sandwich, in order to help demolding. The mold is then deposited on the heating plate of the vacuum chamber, which is flushed with nitrogen (Air Liquide, Alpha gaz 1) three times, and then kept under vacuum. The heating plate is then heated to 170 °C, for 12 h. After this first annealing, the mold is extracted from the vacuum chamber, and inserted into an oven, regulated at 250 °C, for one hour. This second step of annealing, above the melting temperature of PA6, ensures the saturation of the interfaces with grafted copolymers. The mold is then extracted from the oven and let cool down to room temperature.

Figure 1. Experimental setup for long-term heating. The use of the vacuum chamber permits to minimize oxidation of the polymer films during annealing.
Download figure:
Standard image High-resolution image2.4. Experimental set up to rapidly stretch the samples
In order to stretch the multilayer films in conditions close to what happens inside the air-gap of an extrusion machine, we have built a dedicated set up that we briefly describe now.
We used multilayer films previously formed with saturated interfaces, and cooled down to room temperature. The requirements to mimic the air gap were then the following: first, heat the multilayer films above the melting temperatures of both polymers, i.e. above 225 °C. Then stretch the films with stretching rates comparable to the those usually achieved inside the air gap (up to 200 mm s−1), over large enough stretching distances, while the films were remaining in their liquid state. Finally, the films had to be cooled down below the crystallization temperatures of both polymers with fast enough cooling rates (100 °C s−1) to reproduce the crystallization that takes place when an extruded film touches the chill roll. This set-up is schematically presented in figure 2.
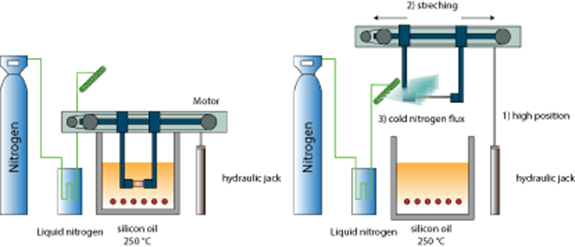
Figure 2. Schematics of the fast heating and stretching system. Left: heating position. Right: Stretching position and cooling.
Download figure:
Standard image High-resolution imageThe multilayer film is held by two jaws. These jaws can be displaced rapidly vertically over typically 10 cm, using a pneumatic actuator. They can also be pull apart horizontally thanks to a stepper motor, (Rosier HS200.2221.0210.AX04) with chosen velocities in the range 0–200 mm s−1, over chosen distances in the range 0–150 mm. A silicon oil bath is used to heat the films at 250 °C. A microcontroller C164CI Infineon (Siemens) controls the various phases of the experiment.
The experimental sequence is as follows:
- immersion of the sample into the oil bath at 250 °C for 30 s,
- extraction of the sample from the oil bath by a rapid vertical motion of the jaws (with a velocity which can be adjusted by adjusting the air flow rate in the pneumatic actuator, with typical values of a full displacement of 10 cm done within a few 10–2 s),
- stretching of the sample at a chosen velocity and over a chosen distance,
- rapid cooling down of the sample to room temperature, by flushing series of air jets, cooled down by previous flow through liquid nitrogen. The cooling kinetics during this last step was adjusted to be representative of the cooling rates obtained when an extruded film comes into contact with the chill roll.
An infrared camera (ThermoVision TM A320G) allows to map the surface temperatures of the films and to follow their evolution during the full experimental sequence. The temperature data are transferred (320 × 240 pixels) to a computer at a frequency of 30 Hz.
Typical temperature maps are presented in figure 3.

Figure 3. Cooling kinetics during an experiment. Upper right: IR photography of the sample. The temperature along a horizontal line and along a vertical line are plotted as a function of time respectively in the lower and upper left 3D plots.
Download figure:
Standard image High-resolution imageIt can be noticed that far from the jaws, in the center part of the film, the temperature remains essentially homogeneous all along the cooling down of the film. This is the part of the samples we shall focus on. Adjusting the airflow rate, cooling down from 250 °C to 100 °C can be achieved in less than one second. A force sensor (Radiospare RS 632.736) working both in compression and stretching allows one to monitor the force experienced by the film during the whole experiment.
3. Part II: direct investigation of the competition between grafting and dilution in elongational flow
We have used the experimental setup described above to investigate in a systematic manner the possible correlations between elongational flow and grafting kinetics.
An important complication of the stretching setup is the fact that during stretching, the temperature of the stretched films is far from remaining constant, with a strong coupling between stretching conditions (rate and stretched distance) and the evolution of the temperature of the assemblies. This means that both flow and temperature evolution need to be precisely known and modeled in order to gain information on a possible flow assisted formation of copolymers.
In a first step, we thus present below the results obtained regarding the coupling between the elongational flow conditions and the time-dependent temperature of the films during stretching. In a second step we describe the results obtained in terms of incidence of the elongational flow conditions on the surface density of copolymers at the PP/PA6 interface of the final films, with a special emphasis on tracing the competition between dilution of the yet formed copolymers, due to increase of the interfacial area, and flow assisted additional grafting during the stretching process.
In order to simplify the investigation, we have decided to use three-layers assemblies PA6/PP/PA6, prepared in the lab, so that the PP/PA6 interfaces were initially saturated with copolymers.
We recall the successive steps of a stretching experiment. In all the following, we consider as a zero for the duration of the experiment the time at which the final cooling down starts. This means that negative times correspond the stretching period, while positive times correspond to the final cooling during which the dimensions of the films are maintained constant.
In figure 4, we report the effect of the stretching distance on the evolution of the surface temperature in the central part of the films.
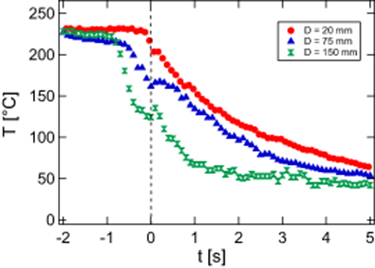
Figure 4. Evolution of the sample temperature for different samples stretched at 150 mm s−1 over different stretching distances D (indicated in the figure).
Download figure:
Standard image High-resolution imageIncreasing the stretching distance accelerates the cooling, quite moderately before the starting of the final cooling process (inside the stretching period) and significantly after, when the dimensions of the films are maintained fixed. This reflects combined impacts on the cooling rates of both the proximity of the jaws and the final thickness of the film in its central part. For larger stretching distances, the film becomes thinner (of the order of 200 μm), and thermal exchanges with the surrounding environment are favored. In figure 4, the first step of the stretching experiment (extension of the films), corresponding to negative times, appears to almost proceed at constant temperature. This is not always the case, as shown in figure 5 where the effect of the stretching velocity at fixed stretching distance is reported.

Figure 5. Evolution of the sample temperature for a fixed stretching distance D = 100 μm and different stretching velocities V (indicated in the figure).
Download figure:
Standard image High-resolution imageThe stretching velocity essentially affects the cooling process during the stretching step, while, of course, the final cooling after stopping the elongation remains essentially unaffected. Interestingly enough, for large stretching velocities, the stretching proceeds in an almost isothermal way.
When examining in more details the cooling curves, two plateaus in temperature appear well visible, as shown in figure 6: they correspond to the respective crystallizations of the PA6 and of the PP parts of the assemblies.

Figure 6. Evolution of the sample temperature for a stretching distance D = 150 μm and a stretching velocity of 1500 mm s−1. The two plateaus correspond to the crystallization temperatures of PA6 and PP, respectively 160 °C and 120 °C. The values indicated in the figure are the measured plateaus.
Download figure:
Standard image High-resolution imageSuch plateaus, when visible are quite convenient to determine the time at which the grafting stops, i.e. the time at which the crystallization of PP occurs. As for co-extruded films inside an air gap, the thermal history of our assemblies appears complex, and, if grafting occurs, it is not a grafting at fixed temperature like inside an oven, except approximately for large stretching velocities. This complex thermal history can, however, be traced back accurately with our setup.
It is then possible to measure the final surface density of copolymers at the PP/PA6 interface as a function of the parameters of the imposed stretching, and thus of given thermal and deformation histories. In figure 7, we report such typical data for assemblies all initially prepared with a saturated interface, and stretched at the fixed stretching velocity of 20 mm s−1, over several stretching distances. The grafting density of the final films decreases with the stretching distance. As the initial grafting density is controlled and known, along with the imposed change in interfacial area, it is quite easy to evaluate what would be the final grafting density if no grafting could take place during the stretching and cooling periods. This is what is reported as the filled circles in figure 7. These data demonstrate without any ambiguity that a significant formation of copolymers takes place during the stretching process, and leads to an increase of the final grafting density by 30%–50% depending on the exact stretching conditions.

Figure 7. Evolution of the grafting density at the interface for PA6/L1/PA6 films at a stretching velocity V = 20 mm s−1 with a PA6 layer of 200 μm and a L1 layer of 500 μm. The measured values (from XPS) are compared to values predicted by only taking into account a geometrical dilution factor.
Download figure:
Standard image High-resolution imageAs pointed out above, the existence of temperature plateaus corresponding to the crystallization of the PA6 and the PP parts of the assemblies permits to determine the time open for the grafting reaction at the interface, allowing the formation of new copolymers during the stretching process. Both convection and diffusion of the reactive species towards the interface can promote the transport of the reactive PPg chains towards the interface. The interfacial reaction stops with the crystallization of the PP.
In figure 8, we report the evolution of the surface density of copolymers for various samples all stretched over the same stretching distance, 100 mm, but with various stretching velocities, so that the time open for the reaction could be varied. The larger the stretching velocity, the smaller is the time open for the interfacial reaction. For short times open to the grafting reaction, the grafting density is found to be well below (three times smaller than) the saturation grafting density. The dilution due to the stretching operates, but there is not enough time to allow for an efficient convection–diffusion induced grafting. On the contrary, for long enough times open to the grafting reaction, the dilution of the yet formed copolymers during the initial stretching can be almost fully compensated by the convection–diffusion grafting during the cooling period of the experiment. Obviously, the time open for the grafting reaction is a crucial parameter which rules the final surface density in copolymers. It would be quite important to trace back in more details the different physical and chemical processes which take place during stretching and cooling in order to be able to predict which time open to the reaction need to be chosen to optimize the interfacial strength. A detailed quantitative analysis of the data presented in figure 8 is difficult to conduct, due to the quite different thermal history of these samples, even if the stretching distance is kept constant. Some rational trends can anyhow be pointed out: for long open times for the grafting reaction, the grafting all along the stretching process can almost totally compensate the dilution of the copolymers which were initially saturating the interface. On the contrary, for large stretching velocities, the dilution process is dominant, and leads to under-saturated interfaces, with a final surface density which decreases when the stretching velocity is increased. Due to the complex thermal history of the stretched samples, it is not obvious to fully rationalize these results. In particular, the coupled impact of the flow and of the temperature history, evidenced by the sensitivity of the final copolymer surface density to both the stretching velocity and the stretching distance, needs be correctly modeled if one wants to precisely determine the incidence of any of the co-extrusion parameters on the final copolymer surface density and thus on the adhesive strength of the interfaces in co-extruded multilayer films.
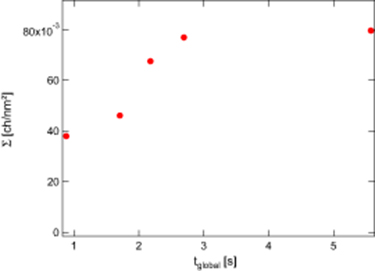
Figure 8. Evolution of the grafting density at the interface for PA6/L1/PA6 films with a PA6 layer of 200 μm and a L1 layer of 500 μm as a function of the time open for the reaction. The total stretching length is D = 100 mm. The measured values are obtained from XPS, as detailed in part I.
Download figure:
Standard image High-resolution imageNumerical modeling appears to be an appropriate tool to try to do so. We present below a first approximate attempt to model the interfacial reaction under the conditions of the stretching experiment.
4. Part IV: numerical modeling of the stretching experiment and of the interfacial reaction
We have developed a numerical description of the interfacial reaction, in the presence of both diffusion and convection by the flow of the reactive species towards the interface, for an elongational deformation, and, in a first step, under isothermal conditions.
The delicate point is to correctly take into account the interfacial reaction, while the transport of reactive species towards the interface is ruled by conventional convection–diffusion equations.
On the PP side of the assemblies, the reactive species are the PPg molecules, diluted at the local concentration Ca, into unreactive PP. On the PA6 side, all PA6 molecules can potentially react with their terminal NH2 extremity. The limiting quantity for the grafting reaction is then the number of PPg molecules located in a thin layer with a thickness from the interface equal to twice the radius of the PPg chains. Indeed, the total number of PA6 chains located in the thin layer with a thickness from the interface of twice the radius of the PA6 chains, is, for the molecular weights used, much larger than that of the PPg chains in the vicinity of the interface.
The modeling method is based on a numerical resolution of the diffusion—convection equations for the local concentration in reactive PPg, called Ca, focusing on the evolution of this concentration inside a PP layer located closer to the interface and having a thickness equal to twice the radius of the PPg chains. To describe the reaction, and particularly the fact that there is a finite limiting surface density of copolymers, we introduce a reaction probability at the interface which depends on the number of PPg molecules yet attached to the interface. The transport of PPg molecules towards the interface obeys the diffusion—convection equation

A slab of fluid of length l0, on the PP side is separated into cells, which are deformed in an affine manner during stretching so that their size Δz along the z axis normal to the interface at the end of the stretching, is close to twice the radius of the PPg chains. The various cells communicate between them, obeying the diffusion—convection equation 2. The geometry of these cells is schematically presented in figure 9.

Figure 9. Schematic representation of the decomposition into cells of thickness Δz used in the numerical simulation, showing the slab close to the interface with a thickness twice the radius of the PPg molecules inside which it is necessary to evaluate the concentration in PPg chains in order to describe the grafting reaction. Δz is chosen to be larger than twice the radius of the PP chains all along the process, and to become close to twice the radius of the PP chains at the end of the stretching.
Download figure:
Standard image High-resolution imageIn order to mimic the stretching experiments, we start with an interface saturated with copolymers. The assembly is then stretched at a chosen velocity, and the surface density of copolymers actually present at each step of time is numerically evaluated, as a function of the duration of the stretching.
Several points are delicate to take into account, as for example:
- the finite reaction kinetics, when a PPg molecule has reached the interface
- the slowing down of the reaction kinetics when the surface density of copolymers becomes close to the saturation density
- the choice of the cell sizes and of the steps of time, in order to correctly account for the interfacial reaction.
We have decided to take into account the various kinetic characteristics of the reaction by introducing an effective time for the interfacial reaction, treac. It represents the average time necessary for a PPg molecule present in the layer from the interface with a thickness of twice the radius of the PPg chains to reach a PA6 molecule, find the NH2 extremity and react. This time treac takes into account both the reaction probability between a maleic anhydride and a NH2 group, and the changes in conformation necessary for both involved polymer molecules to allow the reaction to indeed take place. The probability for a PPg molecule having reached the interface to react is then assumed to be given by:

With Δt a time step.
In order to treat the slowing down of the reaction due to the copolymers yet present at the interface, we introduce the crowding in PPg molecules of the interface through the difference between the surface density at saturation and the actual surface density at time t. We recall that the total number of PA6 molecules within a layer with a thickness from the interface twice the radius of the PA6 molecules remains constant all along the experiment, and that the number of PPg molecules able to reach the interface is the limiting factor for the reaction.
We have used an explicit method of finite differences to solve the transport equation 2. This method allows one to easily express the concentration at time t + 1 as a linear function of the concentration at time t. No matrix inversion is needed contrary to implicit methods. However, to ensure the stability of the system, the time step must obey

meaning that during a time step, no PPg molecules should escape the cell. As the system is also governed by the convective transport of the PPg molecules towards the interface, one should also ensure that

The stability of the system is thus governed by the condition

The choice of Δz is crucial. In order to keep the concentration in PPg molecules inside the cell with a volume ΔxΔyΔz constant, the dimensions Δx, Δy, Δz, need to be adjusted at each time step, and all quantities depending on these dimensions also need to be re-evaluated. By convention, we have chosen to keep Δz always larger than twice the radius of the PPg chains. This fixes the initial value of Δz, as soon as the final stretching is fixed. For example, for a total distance of stretching of 150 mm, the thickness is divided by 3 during the stretching, and we chose the initial value of Δz equal to 0.1 μm. The thickness of the volume of simulation is 1.3 μm, much larger than the diffusion length during the 10 s stretching. Δx and Δy are chosen equal to 2500 μm. This last choice is not critical, and we have checked that dividing this length by a factor of 2 to 8 was not at all affecting the results. The above procedure allows one to evaluate the local concentration in PPg molecules inside the slab with a thickness 2RPPg at the interface.
The change in surface density of copolymers during a time step at time t is then calculated through:

The first term is the number of PPg molecules able to react at the interface because they have reached it. The second term is the probability of reaction if all PA6 molecules are available, and the last term characterizes the slowing down of the reaction due to the proximity of the saturation of the interface and involves the number of PA6 molecules still available for the reaction, i.e. not having yet reacted.
Typical results of the numerical simulations, for given polymer characteristics (DPPg = 4.3 × 10⁻⁸ cm2 s−1, CPPg = 0.2%, Rg = 18 nm, initial length = 15 mm) are reported in figure 10 for different stretching velocities. All the curves show a minimum at a given time tmin. This minimum is characteristic of the competition between the dilution of yet formed copolymers due to stretching and the formation of new copolymers by interfacial reaction all along the stretching experiment. The initial decrease in surface density is related to the desaturation of the interface: the initially saturated layer of copolymers is essentially diluted due to stretching, as the time elapsed from the beginning of stretching is too short to allow for an efficient formation of new interfacial copolymers. After a sufficient time, which should depend on the reaction time, the interfacial reaction becomes efficient and tends to compensate the dilution. The surface density of copolymers then slowly increases towards the saturation value.

Figure 10. Numerically evaluated grafting density as a function of the stretching time for various stretching velocities. Data have been obtained for given polymer characteristics (DPPG = 4.3 × 10⁻⁸ cm2 s−1, CPPg = 0.2%, Rg = 18 nm, initial length of the sample = 15 mm) and for a given reaction time, treact = 0.3 s.
Download figure:
Standard image High-resolution imageThe minimum surface densities and times at minimum are reported as a function of the stretching velocity in figure 11.

Figure 11. [Left axis] (▪ tmin and [Right axis](•) minimum grafting density as a function of the stretching velocity for a given polymer characteristics (DPPg = 4.3 × 10⁻⁸ cm2 s−1, CPPg = 0.2%, Rg = 18 nm, initial length = 15 mm) and one reaction time treact = 0.3 s. Data from figure 10.
Download figure:
Standard image High-resolution imageClearly, the fastest the stretching, the more pronounced is the initial decrease of the grafting density, so that the minimum grafting density decreases with increasing stretching velocities, along with the time at minimum.
The data presented in figures 10 and 11 are coherent with the experimental data presented in figure 8.
Our software allows one to easily investigate the effect of the reaction time on the evolution of the grafting density during stretching. Such data, in terms of grafting density as a function of the stretching time, are reported in figure 12, for the same polymer conditions as in figure 10.

Figure 12. Grafting density as a function of the stretching time, for a given polymer characteristics (DPPg = 4.3 × 10⁻⁸ cm2 s−1, CPPg = 0.2%, Rg = 18 nm, initial length = 15 mm) and for different reaction times. The stretching velocity is v = 50 mm s−1.
Download figure:
Standard image High-resolution imageAs expected, the reaction time deeply affects both the amplitude and the time position of the minimum grafting density. Long reaction times lead to small minimum grafting densities, long minimum times and slow increase of the grafting density after the minimum, just because at fixed stretching velocity, a slow interfacial reaction makes it quite difficult to compensate for the dilution of the yet formed copolymers resulting from the stretching. This is summarized in figure 13, where the minimum grafting density (right axis) and the time at minimum (left axis) are reported as a function of the reaction time.

Figure 13. [Left axis] (▪) tmin and [Right axis](•) minimum grafting density as a function of the reacting time a for a given polymer characteristics (DPPg = 4.3 × 10⁻⁸ cm2 s−1, CPPg = 0.2%, Rg = 18 nm, initial length = 15 mm). Data from figure 12.
Download figure:
Standard image High-resolution imageThe numerical modeling also allows one to investigate the effects of the concentration in PPg molecules and of their diffusion coefficient, both parameters which can be adjusted experimentally, through the molecular weight of the PPg chains for the diffusion coefficient. These effects are illustrated in figures 14 and 15.

Figure 14. Grafting density as a function of the stretching time. for a given polymer characteristics (DPPg = 4.3 × 10⁻⁸ cm2 s−1, Rg = 18 nm, initial length = 15 mm) and different CPPg concentrations. The stretching velocity is v = 50 mm s−1. The reaction time is 1 s.
Download figure:
Standard image High-resolution image
Figure 15. Grafting density as a function of the stretching time. for a given polymer characteristics (Rg = 18 nm, initial length = 15 mm). CPPg = 0.1%. The stretching velocity is v = 50 mm s−1. The reaction time is 0.1 s. Different diffusion coefficients.
Download figure:
Standard image High-resolution image
Increasing the concentration in PPg molecules clearly accelerates the interfacial grafting reaction, not by changing treact, but by bringing more available PPg molecules close to the interface (see equation 7). Adjusting the initial concentration in PPg molecules in the PP layer then appears as an efficient way of optimizing the interface in terms of grafted density of copolymers, for given sets of extrusion parameters, especially drawing ratio in the air gap.
Figure 15 displays the effect of the diffusion coefficient of the PPg molecules (i.e. of their molecular weight). The evolution of the grafting density is essentially insensitive to the diffusion coefficient inside a range of diffusion coefficients which obviously will depend on the stretching velocity. This is a clear indication that the transport of the reactive PPg molecules towards the interface can, for well-chosen conditions, be dominated by convection and not by diffusion (fast enough stretching velocities).
The numerical simulations clearly demonstrate the drastic effect of the stretching velocity on both the initial decrease of the grafting density and then on the kinetics of its further increase. Such an increase has been observed experimentally (see data in figure 7). This means that comparing experiments for fast enough stretching, so that the stretching part of the experiment is indeed almost isothermal, and simulations, it should be possible to experimentally determine the reaction time treact, a crucial parameter to further model co-extrusion experiments. Of course, the data presented in figure 8 correspond to films cooled down after stopping the stretching. This means that some additional diffusion assisted grafting may have taken place after the stretching, during the cooling down step of the experiment. In order to correctly compare experiments and numerical predictions, an additional numerical calculation of purely diffusive grafting needs be conducted in order to model the last cooling step of the stretching experiments. To do so, the temperature dependence of the diffusion coefficient of the PPg molecules needs to be determined independently. Then, using again equation 7 to model the grafting reaction, the quantitative prediction of the additional grafting during the cooling step of the stretching experiments should be straightforward, the thermal history of the samples being known precisely.
5. Conclusion
Based on a fast stretching apparatus, we have investigated the role of stretching distance and stretching velocities on the surface density of PP-PA6 copolymers formed in-situ at the interface. More specifically, we studied the case of copolymers obtained by reaction of few modified PP molecules, that we name PPg and used as adhesion promoters in multilayer PA6/PP thin films. The stretching apparatus was specifically designed to operate in conditions which were representative of what happens in the air gap of a co-extrusion machine, in terms of stretching velocities, stretching distances and cooling rates. The obtained data clearly show that the surface density of copolymers formed at the interface in the final multilayer film results from the competition between dilution of the yet formed copolymers and formation of new copolymers. As a result of a finite reaction time at the interface, increasing the stretching velocity conducts to deeply unsaturated interfaces. To better describe this competition, we have developed a simplified numerical modeling of the interfacial grafting reaction of the PPg/PA6 molecules, in conditions comparable to some of the stretching experiment. This numerical modeling allows one to investigate the role of the various parameters of the system, such as the stretching velocity, the stretching distance, the concentration of reactive PPg chains, their diffusion coefficient, and most important, the global reaction time at the interface, i.e. the time necessary for a PPg molecule having reached the interface to find a PA6 extremity and to react. Comparing predicted and experimental data should allow to give estimates of this time, which is crucial to go further in the determination of optimized sets of co-extrusion parameters to produce multilayer films with good interfacial adhesion properties but also with good stability.
Acknowledgments
We are pleased to thank C Creton for fruitful discussions and A Léger for the IR camera used in this study. We also thank Arkema for financial support and providing all materials used in the opresent study.