

Abstract
Kaolin (china clay) is a rock material that is very rich in kaolinite. A kaolin ore from Debre Tabor, Ethiopia containing 59.2 wt% SiO2, 24.9 wt% Al2O3, 2.4 wt% Fe2O3, and 8.22 wt% loss on ignition (LOI) was physically beneficiated, chemically leached, and thermally treated for possible industrial use, especially for ceramic membrane fabrication. The leaching experiments were carried out using oxalic acid solutions as leaching reagents for the iron extraction process. The effect of acid concentration, reaction temperature, and contact time on iron leaching was investigated. It was determined that the rate of iron extraction increased with the oxalic acid concentration, leaching temperature, and contact time. A substantial reduction of iron oxide (2.4 to 0.36 wt%) from the raw kaolin was observed at operating conditions of 2.0 M oxalic acid, the temperature of 120 °C, and contact time of 120 min. A maximum kaolin whiteness index of 81.4% was achieved through this leaching process. Finally, the physically beneficiated, chemically leached, and thermally treated kaolin raw material was used to fabricate a low-cost kaolin-based ceramic membrane. After firing at 1100 °C the ceramic membrane was found to have a mass loss of 11.04 ± 0.05%, water absorption of 8.9 ± 0.4%, linear shrinkage of 14.5 ± 0.05%. It was demonstrated to be chemically stable, having less than 3% mass loss in acid solution, and less than 1% mass loss in alkali solution. The newly developed membranes have thus properties comparable to commercial ceramic membranes.
Export citation and abstract BibTeX RIS

Original content from this work may be used under the terms of the Creative Commons Attribution 4.0 licence. Any further distribution of this work must maintain attribution to the author(s) and the title of the work, journal citation and DOI.
1. Introduction
One such abundant and inexpensive geomaterial for ceramic membrane fabrication is kaolin [1]. Kaolin (china clay) is a rock material that is rich in kaolinite. Kaolinite is a common hydrous aluminosilicate mineral found in sediments, soils, and sedimentary rocks, with chemical compositions of Al2Si2O5(HO)4. Kaolinite normally appears as stacked pseudo hexagonal platelets, with a common booklet-like shape. Each kaolinite layer is considered as a strong dipole, where the siloxane surface is hydrophobic and dominated by negative charges, while the aluminum surface exhibits positive charges and is hydrophilic. Thus, the individual layers of kaolinite are strongly bonded with hydrogen and dipolar interactions. The key properties of kaolin are opacity, electrical and mechanical property, whiteness and brightness, and particle shape and size distribution [2].
Ethiopia has a huge reserve of kaolin (20 Million tons), which spreads in different parts of the country such as Tigray, Amhara, Oromia and Southern Nations, Nationalities, and Peoples Regions, but mining at depth, continuous and progressive research on kaolin deposits and their occurrences, an increased level of mineral impurities make commercial applications not viable [3]. The major impurities in kaolin are quartz, mica, feldspar, and iron oxide minerals. To improve the quality of kaolin deposits to possibly meet some industrial requirements, the coloring impurities (mainly iron oxides and other small amounts of fluxing components) must be removed through efficient, economical, and environmentally friendly beneficiation methods.
Beneficiation is an upgrading process that is removing mineral impurities such as feldspar, quartz, mica, muscovite, iron oxide, titanium oxide, and clay. Many beneficiation techniques can be used for upgrading the quality and the production of a desired particle shape and size distribution of kaolin clay. The most widely applied physical beneficiation techniques are magnetic [4], flotation [5–7], gravity separation [7], and selective flocculation [8].
Chemical beneficiation methods involve the removal of mineral impurities from kaolin clay by organic and inorganic acids such as oxalic acid [9–15], citric acid [16, 17], thiourea dioxide [18], sodium dithionite [19], sulfuric acid [20–22], and hydrochloric acid [13]. The effect of different organic acids and their concentration in iron removal from kaolin ore has been reported by Saikia et al [17]. Results indicate that the iron removal efficiency of oxalic acid is the most promising organic acid. Similarly, Lee et al [23] reported that oxalic acid solution is the best iron leaching reagent because of its acid strength, good complexing characteristics, and high reducing and bleaching power over those of other organic acids leachants (malonic, citric, and ascorbic acid). Due to the relatively low cost, availability, and very good potential for industrial applications, oxalic acid was chosen as a leachant for the leaching experiments in this work.
In recent decades, biological beneficiation methods have been also used to remove mineral impurities from kaolin clay. Several studies have been applied biological beneficiation techniques for removing mineral impurities from kaolin clay by using different kinds of fungi [24–26] and bacteria [27–29]. Biological purification techniques are more economical, eco-friendly, not energy-intensive, and maintains the crystal structure of kaolin clay to a large extent [30, 31] but a very slow process for industrial mass production.
Numerous researchers have studied the beneficiation and characterization of kaolin minerals in order to use as an adsorbent [32, 33], as a filler [34], as a pharmaceutical excipient [35] and as a starting material for the production of refractories [36] and ceramic bodies [37–42]. However, the selection of the most suitable beneficiation technique depends on the amount and type of mineral impurities present. Hence, the beneficiation process applicable to one type of clay may not be appropriate for another [43]. This may involve physical, chemical, and thermal beneficiation techniques which alter the mineral composition, the crystalline structure, surface functional groups, and the specific surface area of clay. It is therefore important to improve the quality of kaolin clays to possibly meet ceramic industry requirements. Although very limited studies on the synthesis and characterization of Ethiopian kaolin have been reported in the literature [3, 32, 44], ceramic properties of Debre Tabor kaolin have not been studied. In order to fill this research gap, the present study was carried out to determine the characteristics of the kaolin clays and examine the ceramic membrane properties.
Compared to polymeric membranes, ceramic membranes can withstand harsh environments due to their high thermal stability, high chemical stability, excellent mechanical strength, biocompatibility, durability, energy efficiency, availability, and sustainability [45]. These excellent properties make ceramic membranes a primary candidate to be used for water treatment and desalination applications. Many studies have been reported to explore ceramic membrane applications for membrane-based water purification techniques such as reverse osmosis [46, 47], forward osmosis [48, 49], pervaporation [50], electrodialysis [51], and membrane distillation [52–55].
The present study is aimed to characterize the kaolin mineral found in a deposit of Debre Tabor in the Amhara region, Ethiopia, to beneficiate the kaolin mineral sample and characterize the beneficiated kaolin, to promote the beneficiated kaolin for the manufacture of low-cost kaolin-based ceramic membranes for water treatment and desalination application.
2. Experimental method
2.1. Materials
The studied crude kaolin was collected from the local area, Debre Tabor Town, located in the state of the Amhara Region, Ethiopia. Over 5 million tons of kaolin deposit occurs at Debre Tabor [3]. Laboratory grade chemicals, such as sodium hexametaphosphate, oxalic acid, hydrochloric acid, sodium hydroxide, and iron standard solution were used for the present study. To avoid cross-contamination among different samples or from other sources de-ionized water was used for the present study.
3. Methods
3.1. Beneficiation of crude kaolin
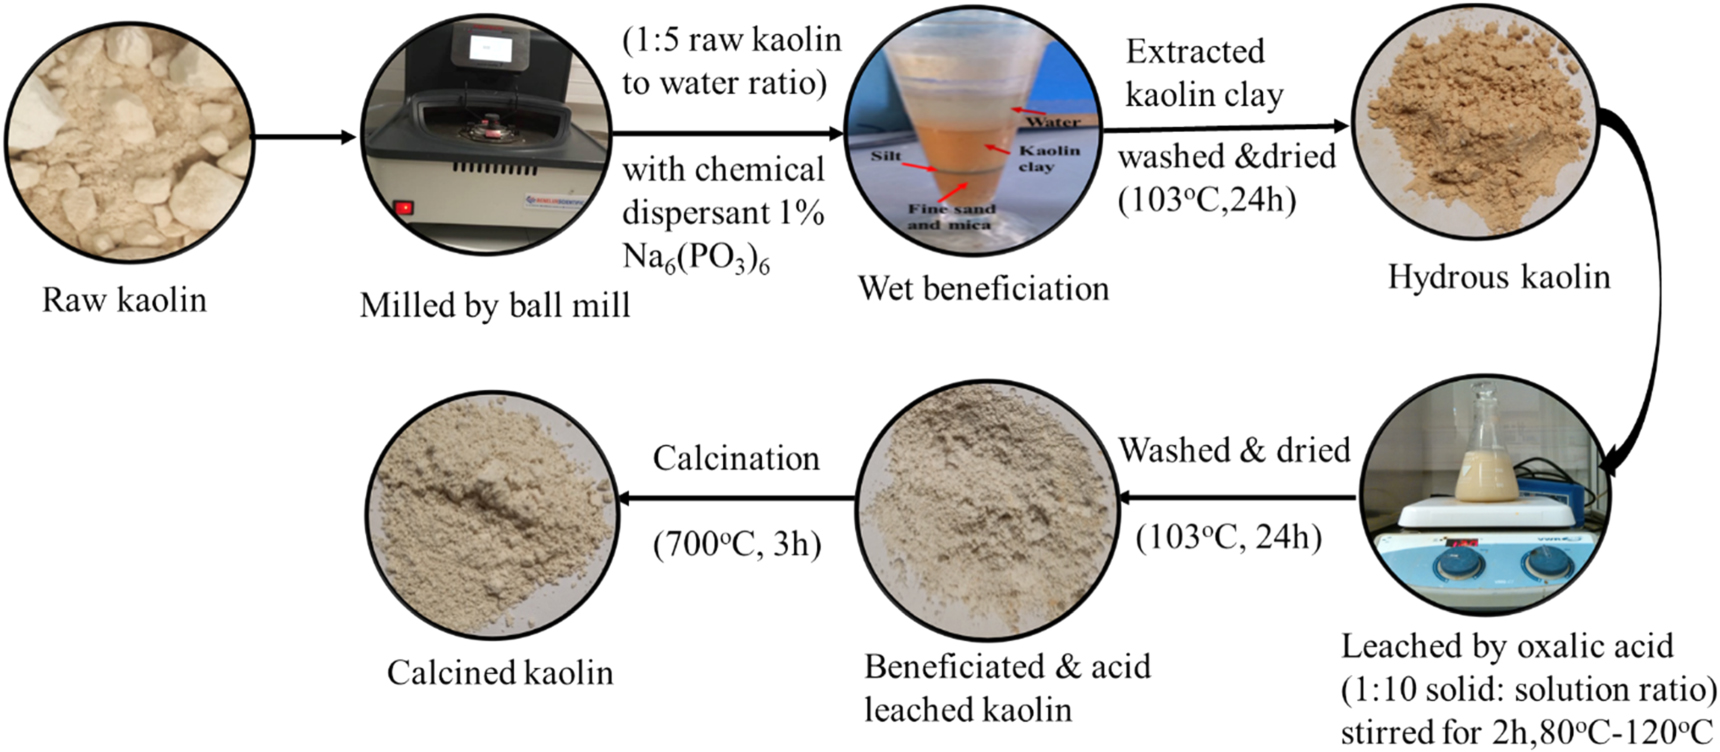
Debre Tabor kaolin ore was beneficiated to improve its silicon oxide (SiO2) and aluminum oxide (Al2O3) by removing mineral impurities (feldspar, quartz, mica, muscovite, iron oxide, titanium oxide, and clay) with a sequential beneficiation process. Some of the course impurities were removed from crude kaolin by physical separation of dirt, followed by milled using a ball milling machine and screened through a 45 μm mesh sieve [33].
Then, the crude kaolin was suspended in deionized water (1:5 kaolin to water ratio) in the presence of a chemical dispersant (1% of sodium hexametaphosphate, Na6(PO3)6) and then stirred manually for 10 min using a glass rod and allowed to stand for 48 h. The dispersed clay was settled by gravity and fractionated into three layers: the first layer was kaolin clay (top); the second layer was silt (middle), and the third layer was fine sand and mica (bottom). The water was decanted and the kaolin clay was separated from leached clay and dried in an oven at 103 °C for 24 h to obtain the beneficiated hydrous kaolin.
3.1.1. Leaching hydrous kaolin by oxalic acid
The leaching experiments were carried out in a 300 ml round bottom flask placed in a magnetic stirrer hot plate with temperature control. The hydrous kaolin material was mixed with the oxalic acid solution at different concentrations (0.1 M, 0.5 M, 1.0 M, 1.5 M, and 2.0 M) at a 1:10 solid to solution ratio and maintained at different targeted temperature (80 °C, 90 °C, 100 °C, and 120 °C) for 2 h under continuous moderate stirring (300 rpm). A 10 ml slurry sample was taken every 20 minutes till the reaction time of 120 min. it was filtered using a nylon syringe filter with a porosity of 0.2 μm then centrifuged immediately at 1000 rpm for 10 min. Since the resulting solution is a higher concentration, a 1:100 dilution was used for the subsequent analysis. The clear diluted solution was analysed for iron content by Inductively Coupled Plasma Optical Emission Spectroscopy (ICP-OES, Optima 2100 DV, Perkin Elmer Instruments, Shelton, CT, USA). A wavelength of 238.204 nm was used for iron detection but an alternative wavelength was also used for controlling possible interferences from other elements (239.562 nm) [56]. All experiments were performed in triplicate, all data are expressed as the mean ± standard deviation.
The residue product was then filtered, repeatedly washed with distilled water to remove any unspent oxalic acid, dried at 103 °C for 24 h. Finally, the acid-treated hydrous kaolin was activated through thermal treatment in a muffled furnace at 700 °C for 3 h, resulting in the formation of calcined kaolin (see figure 1). Its transformation to metakaolin, an amorphous Al-Si phase from which aluminum is easily leached by acid leachants (sulfuric, hydrochloric and, oxalic acid) [57, 58]. According to the previous studies [13, 32, 57], physical beneficiation and calcination were widely applied first and then followed by leaching with acid. In this study, the physical beneficiation and leaching with oxalic acid were applied first and then followed by calcination. In order to remove a high level of iron oxides from kaolin clay, chemical leaching of the clay prior to high-temperature calcination was applied. Moreover, leaching with oxalic acid before calcination is important to prevent the extraction of aluminum from kaolin through the oxalic acid leaching process. Another study proves that the structural ferric ions and ferric oxides from kaolin were difficult to remove using acid as a leaching reagent; therefore, iron removal by acids should be conducted prior to calcination [13].

Figure 1. Beneficiation process of debre tabor kaolin clay.
Download figure:
Standard image High-resolution image3.2. Characterization of kaolin clay
The particle size distributions of kaolin were determined by the laser diffraction particle size analyser (Mastersizer 3000, Malvern Instruments, UK) using water as dispersing medium. The kaolin powder morphology, as well as the microstructure formed in the sample, was examined using a Scanning Electron Microscope (JEOL, JSM-6010LV, Tokyo, Japan). The pH of the aqueous suspension was determined using a benchtop pH meter (Mettler Toledo Seven CompactTM pH/Ion meters S220, Switzerland). The specific surface area, pore-volume, and pore diameter of kaolin powder were measured using surface area and pore size analyzer (Model Nova 2000e, USA).
Thermal Analyses (DSC/TGA, Model Q600, TA Instruments, USA) were used to analyze the thermal behavior of kaolin clay. The method of Wavelength Dispersive x-ray Fluorescence (WD-XRF, Philips PW 2400, Almelo, The Netherlands) spectrometers elemental analyses of clays has been continuously showing the class of alumino-silicates to which the analyzed material corresponds. The elements determined in clays have been presented as a relative percentage of the elements expressed as oxides in the whole sample. The identification of the crystalline phases was carried out by x-ray Diffraction (XRD, D2 phaser, Bruker, Germany) using Cu-Ka 1 radiation at a scanning rate of 2° min−1. Fourier Transform Infrared (FTIR) spectroscopy (Perkin Elmer Spectrum 100, USA) over the range of 4000 to 400 cm−1 was used to measure kaolin powder OH-stretching and bending vibration modes.
3.2.1. Loss on ignition test (LOI)
The loss on ignition was determined using the expression equation (1).

Where M1 is the weight of empty crucible; M2 is the weight of crucible and sample before calcination; M3 is the weight of crucible and sample after calcination.
3.3. Preparation and characterization of the membranes
Preparation of ceramic membranes and testing of the samples was done on laboratory scale. To evaluate the suitability of beneficiated kaolin clay properties for ceramic membrane, flat green bodies were used. A flat green body was prepared using beneficiated kaolin (without any reactive additives) by a dry pressing machine (Enerpac Hydraulic Press, Model RC50, USA) at a pressure of 4.6 ×10² bar for 5 min. The flat green specimens were cut into a rectangular shape (20 mm long by 20 mm wide) with a thickness of 1 mm. The test specimens were dried in an oven at 110 °C for 24 h and then fired at 500 °C, 600 °C, 700 °C, 800 °C, 900 °C, 1000 °C, and 1100 °C for 1 h using a laboratory furnace (Nabertherm P330 Muffle Furnace, Germany). The sintered sample was ready for analysis of various physical properties (mass loss, linear shrinkage, water absorption, porosity, wettability, chemical stability, and surface morphology). All tests were performed in triplicate, all data are expressed as the mean ± standard deviation.
3.4. Mass loss
Mass losses of the flat ceramic bodies were calculated according to equation (2).

In equation (2), M110 is the flat ceramic body mass at 110 °C or dry clay mineral sample, MT is the flat ceramic body masses fired to final temperature T (1100 °C).
3.4.1. Linear firing shrinkage
The flat green ceramic bodies prepared previously were dried in an oven at 110 °C for 24 h and fired to a final temperature of 500 °C, 600 °C, 700 °C, 800 °C, 900 °C, 1000 °C, and 1100 °C for 1h. The shrinkage percentage that occurred during the firing process was determined using the dimensions (volume) of the flat green ceramic specimen before and after the firing process. The total linear shrinkage percentage of the flat green kaolin-based ceramic specimen was determined by using equation (3).

where Vo is the volume of the specimen before firing and Vf is the volume specimen after firing.
3.4.2. Water absorption and porosity
Water absorption and porosity of the flat ceramic specimens were determined by the boiling water method. The flat ceramic specimens prepared in the linear shrinkage part and sintered to different final temperatures ranging from 500 °C to 1100 °C were immersed in boiling water for 2 h and cooled to room temperature. After boiling the specimens were immersed in water for 24 h and then the surface was wiped with tissue paper. The percentage of water absorption was evaluated using the expression equation (4).

where Ms is the mass of the saturated specimen, Md is the mass of the dry specimen.
The porosity of the flat ceramic body was evaluated using the expression equation (5).

where Md is the mass of the dry specimen (g), Ms is the mass of the saturated specimen (g), ρw is the density of water (1 g cm−3 at 4 °C), and Vf is the volume of the fired specimen (cm3).
3.4.3. Contact angle measurement
Contact angle measurement has been performed on ceramic specimens to evaluate their surface hydrophilic characteristics. The wettability properties of flat ceramic specimens fired to different final temperatures ranging from 500 °C to 1100 °C were measured by the sessile drop method (Kruss DSA 10Mk2, Germany) using distilled water at room temperature. All contact angle readings were taken 10 min after a 0.5 ml water droplet was placed on the membrane surface.
3.4.4. Chemical stability test
Chemical resistance tests were carried out in an acidic or basic environment. A flat ceramic specimen fired at different temperature (500 °C, 600 °C, 700 °C, 800 °C, 900 °C, 1000 °C, and 1100 °C) was immersed in acid solution (hydrochloric acid solutions at pH = 1.0 and alkali solution (sodium hydroxide solutions at pH = 13.0) at ambient temperature for 24 h. The flat ceramic specimens were removed from the solutions (acid and alkali), rinsed with distilled water, and dried in an oven at 110 °C for 24 h. The weight of the flat ceramic specimen was measured before and after the test and the chemical resistance of the specimen was calculated by the following equation (6).

where Mo is the mass of the specimen before pH attack and, MpH is its mass after removing the specimen from the acidic (HCl, pH = 1.0) or basic (NaOH, pH = 13.0) solutions.
4. Results and discussion
4.1. Material characterization
4.1.1. Physical properties of kaolin clay
The density of the beneficiated kaolin is 2.64 gcm−3 as compared to 2.5 gcm−3 for the raw kaolin (see table 1). This weight increase may be due to an increase in Al2O3 content from 24.9 to 29.4% during the beneficiation process. The pH values of the raw, beneficiated & acid leached, beneficiated, acid leached and calcined, and commercial kaolin were 5.85, 5.05, 5.15, and 5.41, respectively. This showed that the surface of the raw, beneficiated & acid leached, beneficiated, acid leached and calcined, and commercial kaolin body is slightly acidic. Similar results are reported in the literature [33] for raw and beneficiated kaolin.
Table 1. Physical characteristics of raw, beneficiated and acid leached, beneficiated, acid leached and calcined kaolin, and commercial kaolin.
| Characteristic | RK | BALK | BALCK | CK |
|---|---|---|---|---|
| Density (g cm−3) | 2.5 | 2.64 | 2.64 | 2.66 |
| pH | 5.85 | 5.05 | 5.14 | 5.41 |
| Particle size distribution (%) | ||||
| D10, μm | 3.52 | 3.37 | 3.7 | 2.50 |
| D50, μm | 10.8 | 10.6 | 11.4 | 6.62 |
| D90, μm | 45.0 | 30.7 | 42.3 | 21.5 |
| Whiteness Index (ISO) | 72.0 | 81.4 | 79.2 | 88.14 |
| Texture | Fine | Finer | Finer | Very finer |
| Specific Surface Area (m2 g−1) | 11.6 | 30.5 | 19.4 | 12.1 |
| Pore volume (cc g−1) | 0.025 | 0.029 | 0.034 | 0.033 |
| Pore size (Å) | 20.6 | 14.9 | 19.5 | 19.4 |
RK: Raw Kaolin; BALK: Beneficiated and Acid Leached Kaolin; BALCK: Beneficiated, Acid Leached, and Calcined Kaolin; CK: Commercial Kaolin.
The particle size distribution of raw, beneficiated & acid leached, beneficiated, acid leached & calcined, and commercial kaolin is mainly in the range of 3.52–45 μm (D50 = 10.8 μm), 3.37–30.5 μm (D50 = 10.6 μm), 3.7–42.3 μm (D50 = 11.4 μm), and 0.48–0.99 μm (D50 = 0.8 μm), respectively. The slight decrease of particle size of the beneficiated sample compared to the raw kaolin size is due to the dissolution of the iron oxides and oxyhydroxides. There is a substantial increase in particle size of the beneficiated, leached, and calcined sample compared to the raw, beneficiated, and leached kaolin as a result of calcination. According to these results, the particle sizes of beneficiated and acid leached, and beneficiated, acid leached and calcined samples are adequate for uses of the ceramic products because of containing fine particles.
Figure 2 shows the color changes of the kaolin before and after beneficiation; in the raw kaolin sample, a beige coloration is evident, the beneficiated and acid leached kaolin is essentially white, while imparts color to calcined kaolin (low brightness due to iron oxide impurity) and commercial kaolin (high brightness). The color of beneficiated and acid-leached kaolin is very close to the commercial kaolin. As additional data, figure 3 shows the images of the kaolin clay sample before and after beneficiation with a particle size of less than 45 μm observed at an optical microscope (SMZ25). The observation with reflected light microscopy indicates that: the raw kaolin clay appears in different colors (show by the arrows): slightly white with a brownish red, yellow, and black color impurity due to iron oxide, titanoferrous, and pyrite (iron sulphide)/ilmenite, respectively, having the lowest whiteness index value of 72.0%; the beneficiated and acid leached kaolin is essentially white, having the highest whiteness index value of 81.4%. A similar observation was obtained by Scorzelli et al [59]. After the beneficiated, acid leached and calcined process, a yellow color pigment was appeared in the sample (see figure 3(c)). This is due to the presence of iron-stained titania. Thus, the microscopic observation indicates that oxalic acid leaching has not completely removed the titanium dioxide (TiO2) content. It was observed that 84.83% of iron impurities were removed from raw kaolin with an increase of whiteness index from 72 to 81.4%. This reveals that the beneficiated kaolin reaches an adequate whiteness index for the ceramics industry. According to the literature, the ceramic industry demands an ISO whiteness index above 80.0% [19].
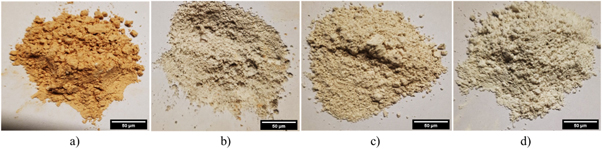
Figure 2. Samples of (a) raw kaolin; (b) beneficiated and acid leached kaolin; (c) beneficiated, acid leached and calcined kaolin; (d) commercial kaolin.
Download figure:
Standard image High-resolution image
Figure 3. Optical microscope images of (a) raw kaolin; (b) beneficiated and acid leached kaolin; (c) beneficiated, acid leached and calcined kaolin; d) commercial kaolin; taken by (15.75×, Optical Microscopy, SMZ25).
Download figure:
Standard image High-resolution imageThe surface area of separate kaolin samples was measured by the Brunauer-Emmett-Teller (BET) multipoint method. The measured specific surface area of kaolin ranges from 11.6 to 30.7 m2 g−1 for the various treatment. The lowest specific surface area (11.6 m2 g−1) was found for the raw kaolin clays while the highest specific surface area (30.7 m2 g−1) was obtained for the beneficiated and acid leached kaolin (see table 1). Similar results are reported in the literature [15, 60, 61] for natural kaolinite clays. As can be seen in table 1, the surface area is increased with oxalic acid treatment. It increases in the order of BALK > BALCK > CK > RK. The increase in the surface area from raw kaolin clay to the beneficiated and acid-treated kaolin clay is due to the removal of the impurities within the pore kaolin mineral through the beneficiation process. However, the surface area of the beneficiated and acid leached kaolin clay treated at high temperature (700 °C) for 3 h is slightly decreasing to a value of 19.4 m2 g−1, whereas during calcination the pore volume and pore size increased due to losing their structure [61, 62].
4.2. XRF characterization
The chemical composition of raw, beneficiated, and acid leached, beneficiated and acid leached and calcined, and commercial kaolin as determined by WD-XRF is summarized in table 2. The analysis result showed that the composition of SiO2 and Al2O3 varying between 59.20 and 60.30%, and 24.90 and 34.90%, respectively. On the other hand, the loss on ignition was varied between 8.22 and 10.87%. These amounts were closest to the values determined for theoretical kaolin, indicating that after clay description and classification the kaolinite was enriched. In the present study, the samples treated with 2.0 M oxalic acid were met the standard specification for the production of ceramics. The iron oxide (Fe2O3) composition of the studied beneficiated and acid leached kaolin was compared to the standards set for ceramics [63] indicating the presence of small levels of iron oxides and hydroxides in the samples. The SiO2/Al2O3 and Al2O3/Fe2O3 mass ratios range from 2.05 to 2.38 and 10.4 to 76.7, respectively, for the different beneficiation steps. The lowest SiO2/Al2O3 values corresponding to the white kaolinite levels and the highest Al2O3/Fe2O3 values corresponding to alumina-rich, with a certain whitish color. From an industrial point of view, the Al2O3/Fe2O3 mass ratio could be used to define the possible end uses of the clays in the ceramic paste formulation [64]. Due to its lower iron oxide content and SiO2/Al2O3 mass ratio, and higher Al2O3/Fe2O3 mass ratio, beneficiated Debre Tabor kaolin is a suitable cheap raw material for developing ceramic membrane for water purification. Finally, the results show that the laboratory beneficiation improves the kaolin sample to a very high grade with a mineralogical, thermal, and physical properties and chemical composition close to that of commercial kaolin (see tables 1 and 2).
Table 2. Chemical composition in wt% of raw, beneficiated and acid leached, beneficiated, acid leached and calcined, and commercial kaolin.
| Oxide | RK | BALK | BALCK | CK |
|---|---|---|---|---|
| SiO2 | 59.20 | 60.10 | 60.30 | 59.10 |
| Al2O3 | 24.90 | 27.60 | 29.40 | 34.90 |
| Fe2O3 | 2.40 | 0.36 | 0.53 | 0.84 |
| CaO | 3.26 | 5.77 | 4.51 | — |
| MgO | 0.18 | — | 0.04 | 0.24 |
| Na2O | 3.84 | 1.83 | 1.55 | — |
| K2O | 3.85 | 2.46 | 2.11 | 4.5 |
| MnO | 0.12 | — | 0.01 | — |
| P2O5 | 0.47 | — | 0.11 | 0.11 |
| TiO2 | 1.65 | 1.05 | 1.15 | — |
| SiO2/Al2O3 | 2.38 | 2.18 | 2.05 | 1.69 |
| Al2O3/Fe2O3 | 10.4 | 76.7 | 55.5 | 41.6 |
| LOI* | 8.22 | 10.7 | 0.98 | 10.87 |
RK: Raw Kaolin; BALK: Beneficiated and Acid Leached Kaolin; BALCK: Beneficiated, Acid Leached, and Calcined Kaolin; CK: Commercial Kaolin; Loss on ignition (LOI*) at 1100 °C, for 1h.
4.2.1. XRD analysis
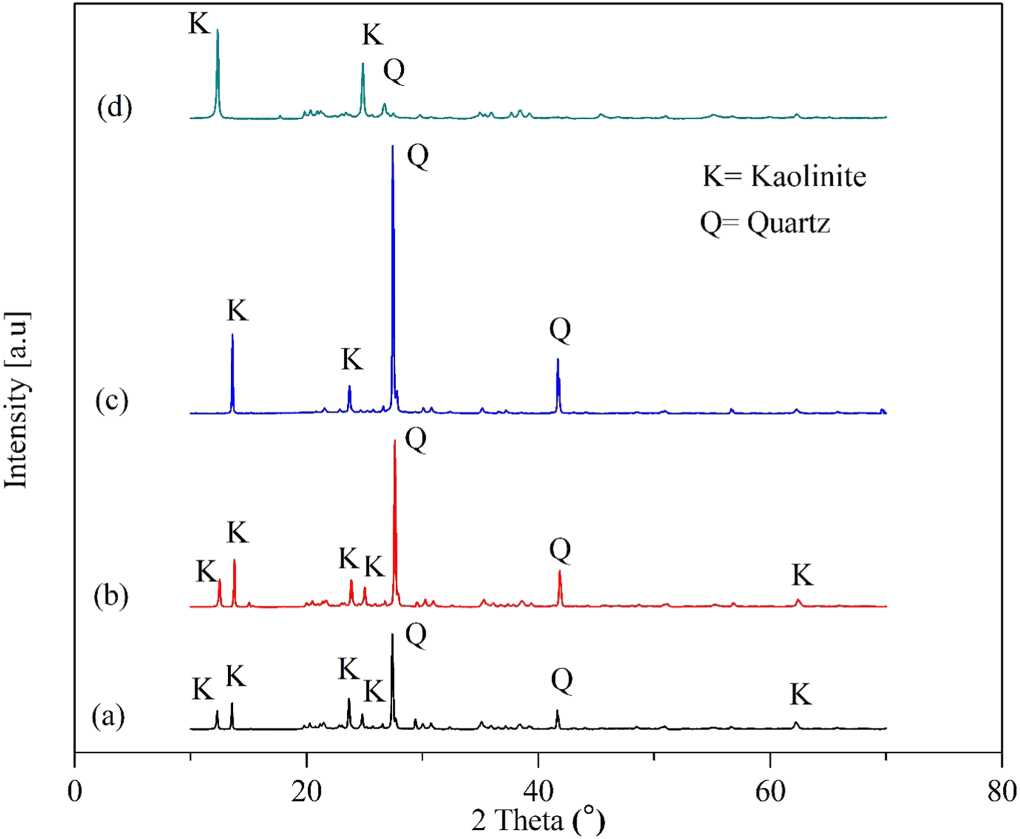
The structural changes that appeared on the raw kaolin and beneficiated clay material were studied using the x-ray diffraction technique. The raw, beneficiated, and acid leached, beneficiated, acid leached and calcinated and commercial kaolin clay shows well-defined diffractions at 2 theta value of 12.18–13.8°, 23.55–24.9°, and 62.5°, these peaks are typically corresponding to kaolinite [32, 42]. On the other hand, the peaks corresponding to the 2 Theta values 27.5° and 41.6°, which are typical characteristics of quartz [65–67]. The obtained x-ray diffraction patterns indicated that the beneficiated, acid-leached, and calcinated material is rich in kaolinite and quartz. This is a confirmation that the quartz material was not completely removed through beneficiation, acid leaching, and calcination [67]. The presence of quartz in the mineralogical composition of the beneficiated, acid-leached, and calcinated kaolin sample results in increasing the silicon dioxide (SiO2) content [66]. This result supports the x-ray fluorescence result presented in table 2. A small peak corresponding to the 2 Theta values of 68.9° for beneficiated, acid leached, and calcined kaolin figure 4(c), which is typically characteristic of titanium oxide (TiO2). This is a confirmation that the titanium oxide is released after calcination [32]. This result supports the optical microscope image of beneficiated, acid-leached, and calcined kaolin presented in figure 3(c).

Figure 4. X-ray diffraction (XRD) patterns of (a) raw kaolin; (b) beneficiated and acid leached kaolin; (c) beneficiated, acid leached, and calcined kaolin; (d) commercial kaolin.
Download figure:
Standard image High-resolution image4.2.2. DSC/TGA analysis
The thermal analyses (DSC/TGA) of the powdered raw, beneficiated and acid leached, beneficiated, acid leached and calcined, and commercial kaolin materials were performed using DSC/TGA, Model Q600 apparatus operating under a constant dry airflow at a heating rate of 10 °C min−1 between room temperature and 1100 °C. Commercial kaolin was used as reference material for all experiments. The DSC/TGA profiles of the raw, beneficiated, and acid leached, beneficiated, acid leached and calcined, and commercial kaolin are shown in figures 5(a)–(d). The total weight loss of mass was 6.9 wt% for raw, 9.14 wt% for beneficiated and acid leached, 0.55 wt% for beneficiated, acid leached and calcined, and 9.14 wt% for commercial kaolin. TGA profile of the studied samples consists of two distinct stages. In the first stage of the endothermic reaction, the mass loss of raw, beneficiated and acid leached, beneficiated, acid leached and calcined, and commercial kaolin in the temperature range 30 °C–140 °C was 0.3 wt%, 1.25 wt%, 0.099 wt%, and 0.16 wt%, respectively which is attributed to the loss of surface, adsorbed/interlayer, and void water [64, 68, 69]. From 140 °C to 360 °C, a net weight gain of 0.062 wt% and 0.34 wt% was recorded for beneficiated, acid leached, and calcined kaolin, and commercial kaolin, respectively, which is attributed to oxygen chemisorption occurring prior to the onset of combustion (figures 5(b), (d)).
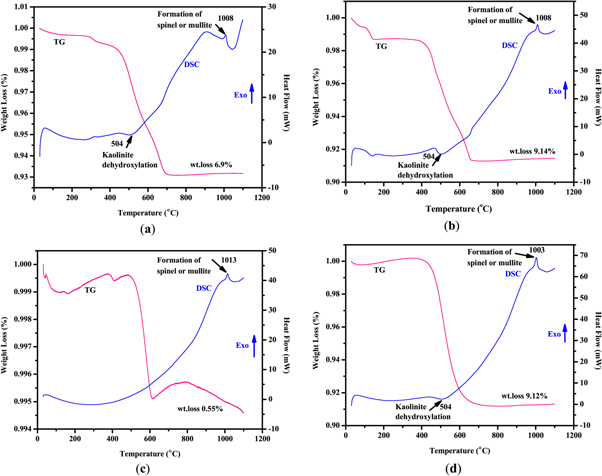
Figure 5. TGA/DSC diagrams of (a) raw kaolin; (b) beneficiated and acid leached kaolin; (c) beneficiated, acid leached, and calcinated kaolin; (d) commercial kaolin.
Download figure:
Standard image High-resolution imageIn the second stage of the endothermic reaction, several mass losses were observed in the temperature range of 400 °C–800 °C due to the loss of hydroxyl groups (dehydroxylation of the kaolinite) from the kaolin structure [44, 64, 68–71]. In this stage, phase transformation chemical reaction occurred kaolin (Al2Si2O5(OH)4) to metakaolin (Al2Si2O7) and showed a significant mass loss of up to 6.09 wt% of the raw, 7.2 wt% of the beneficiated and acid leached, and 0.38 wt% of beneficiated, acid leached and calcined, and 8.9 wt% of the commercial kaolin. This major mass loss and intense endothermicity are because of the combustion of organic matter and carbon. The conversion of kaolin to metakaolin is further supported by the results from the XRD analysis by the disappearance of kaolinite peaks.
It can be determined in DSC curves that exothermic peaks appeared for all the kaolin powder samples. The exothermic peak occurs at a temperature between 50 °C to 60 °C for all indicated the removal of the free water molecules present in the kaolin mineral. The endothermic peak experienced at 140 °C for beneficiated and acid leached kaolin was corresponding to hygroscopic water loss (figure 5(b)). The endothermic peak experienced at 504°C for raw, beneficiated and acid leached, and commercial kaolin was corresponding to organic matter decomposition and the transformation of kaolin to metakaolin caused by the dehydroxylation of a coordinated and structural water molecule [61, 71]. The absence of any major endothermic peak at 504 °C for beneficiated, acid leached, and calcinated kaolin confirmed that almost complete removal of structural water could be achieved in beneficiated, acid leached, and calcinated kaolin sample (figure 5(c)). All samples exhibit an exothermic peak at 1003 °C–1013 °C in the DSC pattern due to an amorphous transformation and formation of spinel and/ or mullite in the minerals (figures 5(a)–(d)). This transformation doesn't engage in any mass loss. Similar results were obtained in their studies with kaolin [61, 68, 69, 71].
4.2.3. FTIR analysis
FTIR was used to identify the crystal structures, functional groups existing in the samples, and other structural defects. FTIR spectra of the raw, beneficiated and acid leached, beneficiated, acid leached and calcined, and commercial kaolin are illustrated in figures 6(a)–(d). The peaks of the raw, beneficiated, and acid leached, and commercial kaolin clearly shows a sharpness at those bands but the beneficiated, acid leached and calcined kaolin exhibit an insignificant peak. Bands at 763 and 690 were related to the perpendicular vibrations of Si-OH [72]. A band at 910 cm−1 was attributed to OH deformation linked to iron cation (Fe3+) and aluminum cation (Al3+) [60].
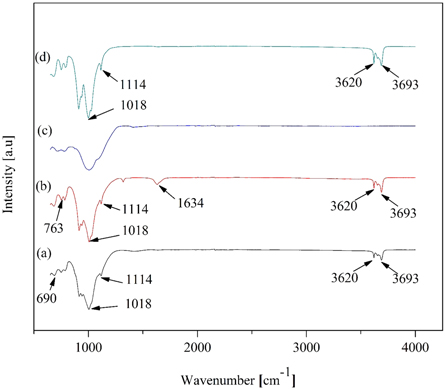
Figure 6. FTIR spectra of the samples (a) raw kaolin; (b) beneficiated and acid leached kaolin; (c) beneficiated, acid leached and calcined kaolin; (d) commercial kaolin
Download figure:
Standard image High-resolution imageBands at 1114 cm−1 and 1018 cm−1 were attributed to the stretching vibration of Si-O and/or Al-O and the symmetric stretching vibrations of Si-O-Si bonds. This confirms that the studied kaolin contained a high proportion of silicon oxide. The spectra of the beneficiated and acid leached kaolin (figure 6(b)) show the new small intensity peaks at 1634 cm−1, comparing to the spectrum of the raw, beneficiated, acid leached and calcined, and commercial kaolin which could be described as H-O-H bending modes of water [73]. Bands at 3620 cm−1 and 3693 cm−1 in raw, beneficiated, and acid leached, and commercial kaolin was assigned to the OH stretching of water [74]. Beneficiated, acid leached and calcined do not contain OH− and Al-O because of the loss of the structural hydroxyl group due to the calcination process (calcination leads to the dehydroxylation at temperatures in the range of 400 °C–800 °C), while Si-O bands appeared during the calcination process (figure 6(c)). The FTIR result shows that thermal treatment was adequate to convert kaolin to metakaolin. The formation of metakaolin can be inferred by the disappearance of multiple bands in the FTIR spectrum of kaolin in the wavenumber range of 3600–3700 cm−1. Beneficiated, acid-leached and calcined kaolin has enhanced percent transmittance than the raw and commercial kaolin.
4.2.4. SEM observations
The scanning electron micrographs of the different kaolin samples are presented in figures 7(a)–(d). The SEM image (figure 7(a)) reveals the presence of large particles that appeared to have been formed by several flaky particles stacked together to form a compact arrangement in hexagonal shapes, irregular bulk edges, and surfaces, and flattened platelets structure of kaolinite [3, 18, 21, 32, 34, 75]. In comparison to the commercial kaolin clay (figure 7(d)), the beneficiated and acid leached product (figure 7(b)) was similar morphological features. After oxalic acid leaching and calcination figure 7(c), the platelet structure/larger particles of the kaolin were broken down, disaggregated, and produced a more porous structure which caused an increase in surface area (table 1). Moreover, due to the removal of the impurities from raw kaolin, more distribution, fragmentation, and fewer aggregations occurred during beneficiation. This results in the formation of a more porous structure. it is also evident that the surface of beneficiated, acid-leached, and calcinated kaolin has homogenous and clear particles with a small flake shape. A similar observation was reported in the literature [18, 32, 34, 61, 75, 76] for kaolinite minerals.

Figure 7. SEM observations of (a) raw kaolin; (b) beneficiated and acid leached kaolin; (c) beneficiated, acid leached and calcined kaolin; (d) commercial kaolin.
Download figure:
Standard image High-resolution image4.3. Leaching studies
4.3.1. Effect of contact time and acid concentration
The effect of oxalic acid concentrations (0.1 M to 2.0 M) at different leaching times on iron removal from the hydrous kaolin is shown in figure 8. The dissolution curves appear to be parabolic as oxalic acid concentration increases from 0.5 M to 2.0 M. It can also be observed that iron dissolution was very slow at an oxalic acid concentration of 0.1 M. The maximum removal of iron at different concentrations of oxalic acid, i.e., 0.1 M, 0.5 M, 1 M, 1.5 M, and 2 M at 120 °C for 120 min was 27.68 ± 0.74, 77.65 ± 0.5, 73.49 ± 0.2, 83.02 ± 0.1 and 84.83 ± 0.24%, respectively. As summarized in figure 8, the minimum and maximum iron ore dissolution are 19.97 ± 0.4% and 84.83 ± 0.24% at a contact time of 120 min, leaching temperature of 120 °C for an oxalic acid concentration of 0.1 M and 2.0 M, respectively. Thus, 2.0 M oxalic acid was to be the maximum concentration for leaching of iron from hydrous kaolin. This suggests that the oxides, hydroxides, and hydrated oxides of total iron impurities associated with kaolin clay are easily solubilized in oxalic acid. According to the results of the present study, it can be concluded that the removal of iron increased by increasing the reaction time and oxalic acid concentration, indicating that both parameters play a major role in the dissolution of iron. Several studies also observed a similar trend during the removal of iron from kaolin clay [11], and other clay materials [23, 77, 78].
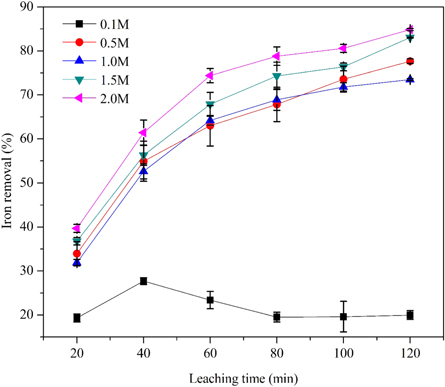
Figure 8. Effect of leaching time and acid concentration on the extraction of iron from raw kaolin (120 °C, less than 45 μm).
Download figure:
Standard image High-resolution image4.3.2. Effect of contact time and temperature
From figure 9, it can be observed that the removal of iron increased with leaching temperature and reaction time, indicating that both parameters play a major role in the extraction of iron. As can be seen in the figure, the maximum removal efficiency of iron is found to be 46.47 ± 0.31%, 62.91 ± 0.1%, 74.69 ± 0.8%, and 84.83 ± 0.24% at a temperature of 80, 90, 100, and 120 °C, respectively. This shows a marginal increase in the amount of the hydrous kaolin reacted with leaching time within the studied temperature ranges (80 °C–120 °C). It is also indicated that iron dissolution using oxalic acid could be thermally activated to improve its removal efficiency. Therefore, a higher leaching temperature and longer time enhance iron dissolution due to the enhancement in diffusion rate or chemical reaction. Several studies also observed a similar trend during the removal of iron from kaolin clay [11, 43], and other clay materials [23, 77, 78].

Figure 9. Effect of leaching time and temperature on the extraction of iron from raw kaolin (80 °C–120 °C) (2.0M oxalic acid, less than 45 μm).
Download figure:
Standard image High-resolution image4.4. Characterization of the membranes
In general, these Ethiopian kaolin deposits, after their beneficiation, acid leaching, and calcination, are able to give kaolin clay of the required properties for the commercial market. The mineralogy, chemical analysis, and physical properties of final beneficiated Ethiopian kaolin clay successfully match the required specifications for many industrial processes. The suitability of raw clay for its use in the manufacture of ceramic products is determined by the mineralogy, chemistry, and physical properties of the material. This work has demonstrated that the beneficiated Ethiopian kaolin clay is a suitable cheap raw material for developing ceramic membrane for water purification and this shows that the beneficiation techniques (physical, chemical, and thermal) applied in the study are worthy following.
Clays with a chemical composition of 5% or more of Fe2O3 are used as red-firing clays, those with between 1 and 5% are buff-burning clay and those containing less than 1% are white burning clays [79–82]. Therefore, it was concluded from the chemical composition of the studied samples, due to the low amount of iron oxide (less than 1%) in the clays (table 2), beneficiated and acid-leached kaolin clays could be used for ceramic membrane production. Moreover, in order to evaluate the suitability of the studied kaolin for ceramic products, the mass loss, linear shrinkage, water absorption, porosity, wettability property, chemical stability, and surface morphology of the flat ceramic bodies were studied at different firing temperatures (500 °C–1100 °C for 1 h).
Figure 10 displays the optical microscope and SEM image of ceramic bodies sintered at 500 °C and 1100 °C and mass loss and linear firing shrinkage of fired flat ceramic samples at different firing temperatures (500 °C–1100 °C). The mass loss of the flat ceramic specimen fired at 500 °C was found to be 5.58 ± 0.08. On further increase of the final firing temperature to 600 °C, 700 °C, 800 °C, 900 °C, 1000 °C a mass loss of 7.98 ± 0.07%, 9.80 ± 0.01%, 10.11 ± 0.05%, 10.86 ± 0.02%, and 11.00 ± 0.09%, respectively was observed. Finally, the maximum mass loss for the flat ceramic specimen fired at 1100 °C was observed to be 11.04 ± 0.05% (figure 10(c)), which is in good agreement with the loss on ignition (table 2) and thermogravimetry analysis (figure 5). The values of mass loss were increased linearly from 500 °C–900 °C and then increase marginally with increasing temperature to a maximum mass loss of 11.00 ± 0.09%. Similar observations were reported in the literature [37].
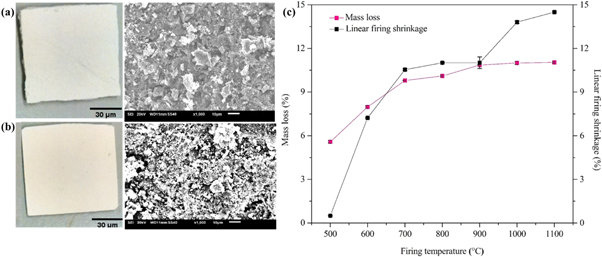
Figure 10. Optical microscope and SEM images of ceramic bodies sintered at (a) 500 °C; (b) 1100 °C, and (c) The mass loss and linear firing shrinkage of flat ceramic bodies sintered at different firing temperatures (500 °C–1100 °C) for 1 h.
Download figure:
Standard image High-resolution imageSimilarly, the linear shrinkage of samples continuously increased with an increase in temperature (figure 10(c)). The flat ceramic specimen was found to shrink with a change volume of 0.5 ± 0.02% and 7.23 ± 0.01% when fired to final temperatures of 500 °C and 600 °C, respectively. The shrinkage between 500 °C and 600 °C was a consequence of the combustion of organic matter. On further increase of final firing temperatures of 700 °C, 800 °C, 900 °C, 1000 °C a shrinkage increase was observed to values of 10.54 ± 0.07%, 11.02 ± 0.03%, 11.02 ± 0.4%, and 13.81 ± 0.08%, respectively. Finally, the maximum shrinkage of volume for the flat ceramic specimen fired at 1100 °C was observed to a value of 14.5 ± 0.05%. The shrinkage of the flat sheet membrane is further incremented as the temperature increased. The increment in the shrinkage is due to the formation of a sintering neck caused by the diffusion of the particles in the flat sheet membrane. This was confirmed by the formation of the mullite phase; this was also reported in the literature for kaolin and other clay materials [81, 83–87]. From optical images, it can be seen that the flat sheet ceramic membrane has shrunk when the sintering temperature increased from 500 °C to 1100 °C. Moreover, the SEM images indicated that the surface morphology changed with changing sintering temperature from 500 °C to 1100 °C (figures 10(a)–(b)).
Figure 11 displays the water absorption and porosity of fired flat ceramic samples at different firing temperatures. Water absorption of a flat ceramic specimen is 21.3 ± 0.06% after firing at a temperature of 500 °C and is decreased up to 19.2 ± 0.12, 18.4 ± 0.3, 17.08 ± 0.26, 16.47 ± 0.08, 14.5 ± 0.01, and 8.9 ± 0.4% after firing at a temperature of 600 °C, 700 °C, 800 °C, 900 °C, 1000 °C, and 1100 °C, respectively. It can be stated that water absorption values tended to decrease with an increase of firing temperature due to the particles close together and reduce porosity during the firing process. A similar trend was reported in the literature for the kaolin-based ceramic body [44], and other types of the clay-based ceramic body [81, 85].
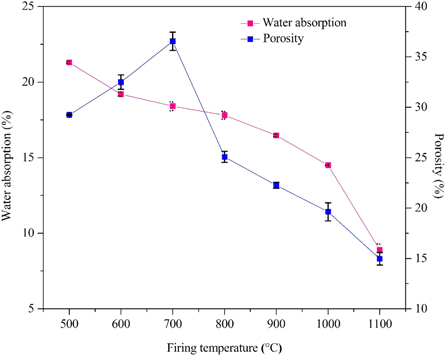
Figure 11. Variation of water absorption and porosity of flat ceramic specimens produced from beneficiated and acid leached kaolin at various final calcination temperatures (500 °C–1100 °C for 1 h).
Download figure:
Standard image High-resolution imageAs can be depicted in figure 11, two stages are observed for the porosity profile. In the first stage, the porosity of the flat ceramic specimen increases from 29.24 ± 0.04% to 36.54 ± 0.9% when the firing temperature is increased from 500 °C to 700 °C while it decreases to 25.08 ± 0.55, 22.26 ± 0.3,19.63 ± 0.89, and 14.96 ± 0.62% keeping the temperature to 800 °C, 900 °C, 1000 °C, and 1100 °C, respectively. A similar trend was observed in the literature for kaolinite clay minerals [37]. The first stage of the curve (increased pattern) indicates an opening of the macropores and mesopores with temperature, whereas the second stage of the curve (decreased pattern) is caused by the fusing of the grains under the effect of heat and the particles tend to agglomerate with each other that enhance the densification of the flat ceramic bodies [38, 88]. An increase in final firing temperature leads to a decrease in the porosity of the flat ceramic bodies down to a value of 14.96 ± 0.62%. A similar trend was reported in the literature for kaolin based ceramic specimens [1, 41, 44, 71, 83, 86, 89–94] and other types of clay-based ceramic specimens [37, 85, 95, 96]. Finally, the porosity of a flat ceramic specimen is directly related to water absorption, both properties show a similar trend in the firing temperature range 700 °C–1100 °C.
Figure 12 illustrates the wettability properties of the fired flat ceramic specimen at different temperatures. The results show that all the contact angles of the flat ceramic specimens are lower than 90°. This is a characteristic of hydrophilic surfaces that are capable to absorb water. The contact angle values of the flat ceramic specimens fired at 500 °C and 600 °C were 2.2° ± 0.07 and 5.4° ± 0.1, respectively, which indicates superhydrophilic behavior. An increase in firing temperature leads to an increase in the contact angle of the flat ceramic specimens up to values of 18.3° ± 0.68 with a firing temperature of 1100 °C and still in the range of hydrophilicity behavior. Similar observations were reported in literature [53, 94].
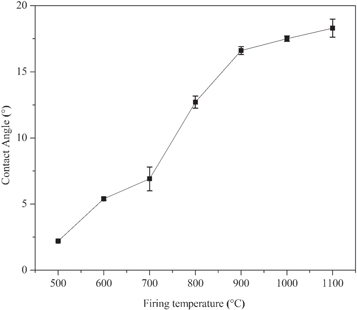
Figure 12. Wetting angle measurements of flat ceramic specimens produced from beneficiated Debre tabor kaolin at various final calcination temperatures (500 °C–1100 °C for 1 h).
Download figure:
Standard image High-resolution imageThe chemical stability was estimated in terms of weight loss after immersing the flat ceramic specimen in acid and alkali solution. A small part of the ceramic membrane was kept in acidic conditions in contact with HCl solution (pH = 1) and alkali conditions in contact with NaOH solution (pH = 13) separately for 24, 48, 72, 96, and 120 h at atmospheric conditions. Then the flat ceramic specimens were taken out from the solution, washed with distilled water, and dried at 110 °C for 24 h. The weight loss in acid solution was recorded to be 0.38 ± 0.11, 1.23 ± 0.09, 1.71 ± 0.02, 2.15 ± 0.03, and 2.34 ± 0.11% for 24, 48, 72, 96, and 120 h contact time, respectively. Whereas, the weight loss in alkali solution was found to be 0.060 ± 0.008, 0.066 ± 0.034, 0.31 ± 0.063, 0.5 ± 0.054, and 0.57 ± 0.06% for 24, 48, 72, 96, and 120 h contact time, respectively. The obtained results reveal that the flat ceramic specimens with the acid solution were observed to lose more weight than flat ceramic specimens with an alkali solution (figure 13). On the other hand, as immersion time increases, the mass loss of the flat ceramic membrane also slightly increased in both acid and alkali conditions. Nevertheless, the prepared flat ceramic specimen offers good chemical stability in acidic (<3% mass loss in acid solution) and excellent chemical stability in basic media (<1% mass loss in alkali solution). The obtained results are comparable with kaolin based ceramic bodies [71, 83, 89, 91, 97] and other types of clay-based ceramic bodies [37, 83, 95, 96, 98, 99].
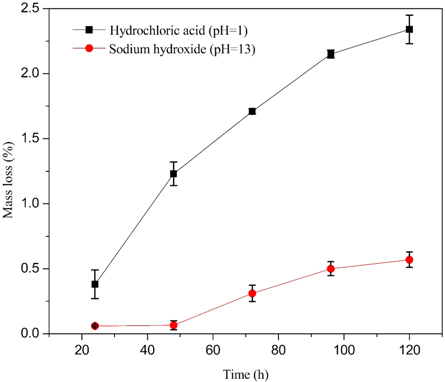
Figure 13. Mass loss of flat kaolin-based ceramic membrane (sintered at 1100 °C for 1 h) versus exposure time in acid solution (HCl, pH = 1) and alkaline (NaOH, pH = 13) solution.
Download figure:
Standard image High-resolution imageScanning electron microscopy (SEM) micrographs reported in figures 14(a)–(g) show the surface of flat ceramic membrane sintered at different temperatures and give information on the surface morphology of the membrane as a function of the temperature treatment (500 °C, 600 °C, 700 °C, 800 °C, 900 °C, 1000 °C, and 1110 °C). SEM micrographs indicate that the effect of sintering temperature on the microstructure of the kaolin-based ceramic membrane is remarkable; a progressive reduction of porosity or a typical sequence of enhancing densification can be observed when the sintering temperature increases from 500 °C to 1100 °C [41, 83, 86, 91, 99]. The flat ceramic membrane sintered at 1100 °C with a porosity of 14.96 ± 0.62%, consisted of non-uniform grain size and strongly interconnected (the particles agglomerate together creating more dense structure), and formation of large pores (larger diameter) (figure 14(g)), whereas the flat ceramic membrane sintered at 500 °C and with a porosity of 29.24 ± 0.04%, consisted of loosely interconnected kaolin grains (open pore structure), poor consolidated and small pores (figure 14(a)). A further increase in temperature to 700 °C causes a visible change in the surface morphology with a porosity of 36.54 ± 0.9% show a highly porous structure (figure 14(c)). Moreover, it was visible that the pore size and pore structure changed with an increase in the sintering temperature [1, 41, 83, 91, 93, 99]. It is to be noted that the degree of bonding between the kaolin particles became stronger with an increase in the temperature. Since the higher sintering temperature gives more consolidation and densification, and formation of voids and large pores for the kaolin-based ceramic membrane. The observations of the SEM indicate that the membrane did not contain any damages, e.g., cracks.

Figure 14. SEM micrographs of the flat kaolin-based ceramic membrane sintered at: (a) 500 °C; (b) 600 °C; (c) 700 °C; (d) 800 °C; (e) 900 °C; (f) 1000 °C; (g) 1100 °C for 1h.
Download figure:
Standard image High-resolution image
Finally, it concludes that the studied kaolin-based membrane has comparable characteristics such as surface morphology [41, 83, 86, 91], water absorption, and porosity [41, 44], thermal and mechanical properties [86] with those of commercial kaolin based ceramic membranes. Therefore, the studied kaolin-based membrane is suitable for water purification and desalination applications.
5. Conclusions
The raw kaolin has much higher impurities, unlike the commercial kaolin. It is well known that iron-containing minerals impact the optical, chemical, and mineralogical properties of ceramic membranes. However, the treatment processes (beneficiation and acid leaching) can reduce the iron percentage to a lower level to reach the requirement of ceramic membrane for water purification applications. Leaching of iron with oxalic acid solutions at different temperatures, acid concentrations, and leaching time was more effective. Leaching results indicated significant removal of iron oxide (2.4 to 0.36 wt%) from raw kaolin using 2.0 M oxalic acid at 120 °C for 120 min contact time. It was possible to raise the kaolin whiteness index (ISO) from 72.0 to 81.4% with this beneficiation method. The kaolin based ceramic membrane characterization results obtained in this research show that after firing at 1100oC the ceramic membrane present: mass loss (11.04 ± 0.05 wt%), water absorption (8.9 ± 0.4%), linear shrinkage (14.5 ± 0.05%), and chemical stability (less than 3% mass loss in acid solution, less than 1% mass loss in alkali solution), having comparable properties to commercial membranes. Thus, this study could provide new insight into the utilization of beneficiated and acid-leached Ethiopian kaolin for different industrial applications.
Acknowledgments
The authors would like to thank and appreciate the Ethiopian government/Ministry of Science and Higher Education and the German government for providing laboratory equipment and special thanks to the KU Leuven and the Bahir Dar University, for providing the necessary facilities for this research.
Data availability statement
All data that support the findings of this study are included within the article (and any supplementary files).
Conflict of interest
The authors declare that they have no conflict of interest.