
Abstract
The objective of this study was to ascertain the optimal additive conditions to develop a film from an alternative source of modified starch, using the response surface methodology. The central composite design + points used factors to evaluate the effect of the independent variables (glycerol concentration: 0.3, 0.35, and 0.40 g g−1 starch; carboxymethylcellulose: 0.5, 0.75 and 1 g/5 g starch; stearic acid 0.025, 0.05, and 0.075 g/5 g starch) on the response variables (solubility, swelling, opacity, luminosity, tensile strength, elongation, water vapor permeability, and water activity). A simultaneous optimization was achieved using concentrations of glycerol 0.30 g g−1 starch, CMC 0.32 g/5 g starch, and stearic acid 0.007 g/5 g starch, which generated interesting properties validated through experimentation. Therefore, an ecological film was obtained that can be considered for food coating because it presented a low permeability to water vapor (0.0055 g ms−1MPa−1), a high percentage of elongation (91%), and a decrease in solubility (23%). This will also allow the incorporation of other compounds such as antioxidants, reinforcements, and sensors with favorable results, and with a positive perspective on the use of alternative sources of starch.
Export citation and abstract BibTeX RIS

Original content from this work may be used under the terms of the Creative Commons Attribution 4.0 licence. Any further distribution of this work must maintain attribution to the author(s) and the title of the work, journal citation and DOI.
1. Introduction
Recently, consumer interest in the use of biodegradable materials made from natural biopolymers instead of non-renewable plastics has increased due to the permanent increase in the cost of plastic production and concerns about environmental pollution [1, 2]. The main example of these materials are films, used as an alternative for the development of coatings for food, and which are currently used as auxiliary packaging to improve the efficiency of common packaging because they can help to control or monitor the oxidation of lipids and proteins, temperature variations, the state of freshness, and microbial contamination of food [3–5] in order to increase the shelf life and avoid negatively affecting its taste and nutritional value, and even prevent foodborne diseases. Most of the applications are based on the incorporation of antioxidant compounds [6] that function as sensors which can detect changes in food. Several researchers have worked on the development of films that mainly use starch, which is an abundant, inexpensive, and renewable material, easy to obtain, modify, and mix with various compounds through chemical and biochemical processes [7, 8]. Starch is mainly made up of amylose and amylopectin. Amylose is a linear polymer of α (1–4) -bound glucose units in which some α (1–6) bonds can occur and is associated with the amorphous core of starch granules [9]. Amylose is insoluble in water, although it can form hydrated micelles thanks to its ability to bind water molecules through hydrogen bonds and generate a helical structure. Amylopectin is a heavier branched polymer with 94%–96% α (1–4) bound glucose units and 4%–6% α (1–6) bonds. Amylopectin is a larger molecule and contributes predominantly to the crystalline organization of native starch granules [9]. These branches are found in every 15–25 glucose units and are partially soluble in hot water [10]. Potatoes, tapioca, and corn are the main commercial sources of starch, differing in their amylose and amylopectin content [11–13]. The sweet potato has low marketability, although it has a starch content similar to that of potato or corn [14]. Sweet potato starch of different varieties has different granule sizes and amylose contents, with a CA-type crystal structure [15]. However, starch alone has limited applications in film development due to its low barrier property against water, poor mechanical properties, and the brittleness of its films. Therefore, starch can be combined with other compounds or chemically modified to develop films with better stability and resistance. A promising chemical modification of starch is acetylation, a process by which part of the hydroxyl groups of glucose monomers are replaced by acetyl [16]. This modification interferes with the reassociation of amylose and amylopectin molecules in gelatinized starch suspensions, which prevents syneresis, lowers the gelatinization temperature, and modifies the swelling and solubility power [17]. The physicochemical properties of acetylated starch are proportional to the degree of substitution of acetate groups [18]. Farajpour et al [19] found that one of the most important aspects to improve food packaging is the water barrier properties which are usually achieved by adding different oils. No work has been reported on acetylation-modified biopolymer films of sweet potato starch. Therefore, this type of information adds potential value and application perspectives to industrial starch applications. To diversify the use of the purple sweet potato, which represents an important and economical source of starch, this research was established as an objective to determine the effect of glycerol, carboxymethylcellulose, and stearic acid in the development of a film from acetylated starch of purple sweet potato, making use of the response surface methodology.
2. Materials and methods
2.1. Materials
Purple sweet potato tubers were harvested in Charo, Michoacán, Mexico (19°44'40.8'N 101°03'37.9'W). The pieces were washed with running water and immersed in 1 l of distilled water for 5 min. Thereafter, they were peeled and scratched with a stainless-steel knife.
2.2. Starch extraction from purple sweet potato
Native sweet potato starch was isolated according to the method of Jayakody et al [20], with some modifications taken from Ojeda [21]. One hundred grams of peeled and minced purple tuber samples were weighed and soaked in 500 ml of potassium metabisulphite solution (50 mg l−1) for 1 h. The samples were ground twice with a blender, and the homogenate was vacuum-filtered on a blanket and washed with 300 ml of distilled water. The filtrate was soaked with distilled water for 24 h. The supernatant was discarded, and the sediment was washed thrice in 500 ml of 4.99 mM l−1 NaOH aqueous solution until the solution became clear. The starch precipitate was neutralized with 10 ml of a 2 N HCl solution followed by filtration, the aqueous phases were discharged, and the final precipitate was filtered and washed with 500 ml of distilled water. The precipitated starch was dried in an oven at 50 °C for 24 h, ground into powder, and passed through a 100-mesh sieve. The yield was calculated through the quotient between the quantity of product obtained and the quantity of the starting sample (expressed in units of weight) and multiplied by 100.
2.3. Starch acetylation
The modified method of Vargas et al [22] was used to prepare chemical acetylated starch. Twenty grams of starch and 3.5 g of sodium sulfate were dissolved in 40 ml of distilled water at 25 °C and stirred at 800 rpm. Three drops of a sodium hydroxide solution (50% w w−1) were used to adjust the pH to 8–8.4. Acetic anhydride was added to the solution using a concentration of 10% based on the concentration of starch. The solution was continuously stirred (800 rpm) for 5 h, maintaining the pH value at 8. The slurry was adjusted to pH 7.0 with hydrochloric acid solution (1 M) and centrifuged (CRM globe, Centrificient) at 2000 rpm for 15 min. The precipitate was washed four times with distilled water, oven-dried (ECOSHEL, 9053 A) at 50 °C for 16 h, ground into powder and passed through a 100-mesh sieve. The percentage of acetylation (% acetyl) and the degree of substitution were determined by back titration according to the JECFA (2001) [23] methodology. 1 g of modified starch was placed in 50 ml of distilled water and 3 drops of phenolphthalein, the solution being neutralized to a slightly pink color with 3 drops of 0.1 N NaOH. Then 25 ml of 0.45 N NaOH was added, and the solution was vigorously stirred (600 rpm) for 30 min. After time, the samples were titrated with 0.2 N HCl. Likewise, a blank was prepared using native starch instead of acetylated starch.
The percentage of acetyl represents the percent by weight of acetyl groups in the starch on a dry basis and was calculated as follows:

The degree of substitution is defined as the average number of sites per glucose unit that has a substituent group and was calculated using the following equation:
where 0.043 are the milliequivalents of the acetyl group (CH3-C = 0), 162 is the molecular weight of anhydrous glucose, 4300 is the multiplication of the molecular weight of the acetyl group (CH3-C = O) by 100, and 42 is the molecular weight of the acetyl group minus 1.
2.4. Preparation of films
The following procedure was used to produce the films: Fifty five mL deionized water was heated in a beaker up to 70 °C and the corresponding amount of stearic acid (AE) was added after melting the fatty acid by sonication (SONICS vibracell, VC505) for 5 min at 40% amplitude to generate an emulsion. Subsequently, it was again placed in agitation and heating while 5 g of acetylated purple sweet potato starch was added, and after the temperature reached 85 °C, it was held for 20 min. Separately, fifty-five ml of deionized water was placed in a beaker on a heating plate and heated up to 70 °C with agitation at 800 rpm and the corresponding amount of carboxymethylcellulose (CMC) was added immediately. Once dissolved, it was sonicated in an ultrasonic bath for 5 min to remove bubbles. Once the two solutions were prepared, they were mixed in a beaker on a grill with stirring and heating for 10 min. The corresponding amount of glycerol was added and held for 5 min more, and finally the solution was filtered through gauze. The film-forming solution was poured into 20 × 20 × 0.3 cm acrylic plates; the plates were placed in an oscillating shaker for 20 min to homogenize the gel and finally dried in a drying oven with air circulation for 24 h at 35 °C. The obtained films were detached and characterized.
2.5. Experimental design and statistical analysis
Statgraphics Centurion XVI software was used to design a response surface with central composite experimental design star points to optimize the combination of factors affecting the film formation. The composite central design star points generated 18 runs, with four repetitions at the central point, and used process factors to evaluate the effect of independent variables (glycerol concentration (G): 0.3, 0.35, and 0.40 g g−1 starch; CMC: 0.5, 0.75, and 1 g/5 g starch; stearic acid (SA) 0.025, 0.05, and 0.075 g/5 g starch) on response variables (solubility, swelling, opacity, luminosity, tensile strength, elongation, water vapor permeability, and water activity). The second-degree polynomial equation generated by the design was as follows:

where Y is the predicted response;  is a constant;
  are the linear coefficients;
  are the coefficients of interaction among the three factors under investigation;
  are the quadratic coefficients; and A, B, and C are the process codes for glycerol, carboxymethylcellulose, and stearic acid, respectively. Analysis of variance (ANOVA) of the regression at a level of significance of
  was performed to verify the validity of the model.
2.6. Characterization of films
2.6.1. Thickness
The film thickness was measured using a micrometer (FTVOGUE) with a range of 0 to 12.7 mm with a precision of 0.001 mm. The final value represented the average of 6 random measurements of different parts of the biopolymer film.
2.6.2. Luminosity and opacity
The luminosity was determined by averaging four measurements, two in the center and two at the edges, using a colorimeter (BYK-Gardner GmbH). The films were placed on a standard board and CIE-Lab scales were used to measure their luminosity. The opacity of the films was calculated by dividing the absorbance value at 600 nm by the film thickness (mm) [24]. The sample was cut into a rectangular piece (3 × 1 cm) and placed in the spectrophotometer cell. The measurements were made with air as a reference. All determinations were made in triplicate and the opacity was calculated according to the following equation:
where A600 is the absorbance of the film measured at 600 nm, and d is the film thickness in mm.
2.6.3. Solubility and degree of film swelling
Water solubility (WS) was defined as the proportion of water-soluble dry matter in the film that dissolved after immersion in distilled water [25]. Samples were prepared in triplicate by cutting the sample into 2 cm2 square pieces, followed by drying in a hot air oven at 105 °C for 24 h. After the first dry film was accurately weighed to record the initial weight, the samples were immersed in 50 ml of distilled water and kept in slow and constant stirring at 90 rpm in an orbital shaker (Scientific & Instruments, Inc. CVP2000P) at 25 °C for 24 h. The remaining pieces of the film were then removed and dried at 105 °C to obtain a constant weight (final dry weight). The percentage of total solubility of the films was calculated using the following equation:
where wi and wf represent the initial and final dry weights, respectively.
The swelling of the films was measured by placing 2 cm2 pieces at constant weight in containers with 50 ml of distilled water for 24 h at 25 °C after weighing the films (W1). The films were then superficially dried with filter papers and the wet film (W2) was weighed. The degree of swelling was calculated through the following equation:
2.6.4. Permeability to water vapor
The water vapor permeability of film samples was determined according to the official method ASTM D885–02 [26], with some modifications. Cylindrical plastic bottles with an internal diameter of 25.4 mm, containing 5 g of calcium chloride, were covered with the films. The test vessels were placed in a desiccator maintained at 25 °C and relative humidity of 55%. The changes in the weight of the cups were controlled for 24 h until the stable state (straight line) was reached. The linear regression graph of weight loss versus time determined the slope. Water vapor transmission rate (WVTR) was defined as the slope (g h−1) divided by the transfer area (m2). The WVP (g m−1 s−1 MPa) was calculated as follows:

where WVTR is the rate of transmission of water vapor (g m−2 s−1) through the film, tm the average thickness of the film, and Δp the difference of partial water vapor pressure (MPa) across the two sides of the film. All measurements were made on three replicates of each film.
2.6.5. Physical and mechanical properties of films
The texture analyzer (Brookfield, CT3 25 K) was used to determine the tensile strength, elongation at break, and maximum force, according to the ASTM D 882-02 standard method [27]. Film strips of 10 mm width and 50 mm length were cut; the initial gripping distance was 30 mm, and the speed of the crosshead 0.50 mm sec−1. Six replicas of each film were tested. Tensile strength was calculated by dividing the maximum breaking force of the film by its cross-section area. Elongation at rupture was determined by dividing the difference in the final distance travelled to rupture and the initial separation distance by the initial separation distance multiplied by 100.

where TS = tensile strength (MPa); Fm = maximum force at break (N), and A = area of film cross-section (m2).
where E = elongation (%); do = initial distance of separation between claws (cm); and df = distance to rupture (separation between the claws at the time of rupture) (cm).
3. Results and discussion
The extraction yield of the purple sweet potato starch was 16.05%, greater than the 13% reported by Moorthy [28]. Starch reaction with 10% acetic anhydride generated starches with 0.05% of acetyl and 0.01% of DS, lower than those described by Anchundia [17], who described a value of 1.58% of acetyl and 0.58% for DS in white sweet potato starch samples treated with 15% acetic anhydride, although this percentage of acetic anhydride was greater than that used in our study. The data obtained for the modified starch are within the low DS classification and therefore suitable for use in the food industry, as it meets the requirements of FAO/WHO Expert Committee on Food Additives [29] and Heuzé et al [30], whose values must not exceed 2.5% of acetyl and 0.08% for DS.
3.1. Optimization
The results of the different response variables used to establish the optimal conditions to produce films from acetylated purple sweet potato starch are shown in table 1.
Table 1. Results of the experimental design.
| Run | Gly g g−1 ACMA | CMC g/5 g ACMA | SA g/5 g ACMA | Solubility (%) | Swelling (%) | Opacity | L | TS MPa | E % | WVP g/msMPa−1 | WA |
|---|---|---|---|---|---|---|---|---|---|---|---|
| 1 | 0.35 | 0.75 | 0.05 | 26.58 | 915.88 | 1.81 | 6.80 | 0.69 | 61.84 | 0.0095 | 0.27 |
| 2 | 0.35 | 1.170 | 0.05 | 28.15 | 784.89 | 2.01 | 5.58 | 0.66 | 59.40 | 0.0075 | 0.36 |
| 3 | 0.4 | 0.5 | 0.025 | 25.26 | 928.69 | 3.65 | 15.98 | 1.58 | 95.42 | 0.0085 | 0.35 |
| 4 | 0.35 | 0.75 | 0.05 | 27.21 | 925.07 | 1.72 | 14.63 | 0.59 | 67.90 | 0.0103 | 0.29 |
| 5 | 0.35 | 0.75 | 0.05 | 28.48 | 957.33 | 1.88 | 4.05 | 0.50 | 56.58 | 0.0118 | 0.29 |
| 6 | 0.35 | 0.329 | 0.05 | 26.79 | 901.85 | 4.54 | 11.06 | 0.12 | 93.44 | 0.0142 | 0.40 |
| 7 | 0.35 | 0.75 | 0.05 | 26.17 | 914.96 | 1.81 | 20.72 | 0.80 | 65.63 | 0.0074 | 0.29 |
| 8 | 0.35 | 0.75 | 0.008 | 34.11 | 1609.04 | 2.11 | 9.98 | 0.65 | 113.01 | 0.0074 | 0.39 |
| 9 | 0.3 | 0.5 | 0.075 | 24.22 | 853.02 | 0.74 | 21.57 | 0.76 | 58.86 | 0.0062 | 0.29 |
| 10 | 0.4 | 1 | 0.025 | 27.45 | 750.48 | 1.72 | 4.66 | 0.80 | 86.89 | 0.0098 | 0.33 |
| 11 | 0.4 | 0.5 | 0.075 | 49.91 | 874.16 | 5.80 | 24.47 | 0.46 | 88.12 | 0.0075 | 0.40 |
| 12 | 0.3 | 0.5 | 0.025 | 26.33 | 763.30 | 1.25 | 5.15 | 0.85 | 65.50 | 0.0090 | 0.41 |
| 13 | 0.3 | 1 | 0.025 | 27.19 | 1152.59 | 2.52 | 2.85 | 0.48 | 66.82 | 0.0070 | 0.32 |
| 14 | 0.434 | 0.75 | 0.05 | 30.31 | 1230.09 | 3.64 | 10.67 | 0.28 | 74.02 | 0.0089 | 0.33 |
| 15 | 0.35 | 0.75 | 0.092 | 23.58 | 1065.11 | 2.45 | 21.34 | 0.43 | 37.01 | 0.0105 | 0.30 |
| 16 | 0.265 | 0.75 | 0.05 | 31.42 | 438.68 | 2.39 | 6.82 | 0.63 | 13.88 | 0.0076 | 0.34 |
| 17 | 0.3 | 1 | 0.075 | 23.49 | 410.56 | 2.50 | 14.71 | 0.69 | 35.74 | 0.0072 | 0.33 |
| 18 | 0.4 | 1 | 0.075 | 25.61 | 711.55 | 4.81 | 20.61 | 0.51 | 68.54 | 0.0054 | 0.26 |
Gly = Glycerol; ACMA = 10% acetylated purple sweet potato starch; CMC = carboxymethylcellulose; SA = stearic acid, L = Luminosity; TS = tensile strength; E = elongation; WVP = water vapor permeability; AW = water activity; MPa = megaPascal*The data are obtained from the average of three repetitions.
The second-order polynomial models in table 2 show the regression coefficients and the influence of the variables on the physical and mechanical characteristics of the produced films. All the films were smooth, clear, and transparent (figure 1).
Table 2. Second-order polynomial models.
| Estimated coefficients of regression | ||||||||
|---|---|---|---|---|---|---|---|---|
| Constant | Solubility | Swelling | Opacity | L | TS | %Elongation | WVP | WA |
| 51.3545 | −3862.58 | 17.5159 | −40.7346 | −1.6924 | −213.513 | −0.00133 | 1.2863 | |
| A: Glycerol | −281.414 | 23105.7 | −85.0022 | 208.028 | 9.6814 | 1851.34 | −0.0615 | −3.5495 |
| B: CMC | 99.6938 | 3430.96 | 5.95089 | 20.7875 | 0.3299 | −116.271 | 0.0230 | −0.4146 |
| C:SA | −663.522 | −28234.9 | −233.403 | −31.2617 | 26.683 | −1320.54 | 0.2614 | −6.6141 |
| AA | 488.526 | −30954.7 | 167.113 | −146.894 | 0.1813 | −2217.46 | 0.2877 | 5.5966 |
| BB | 0.310904 | −1187.36 | 8.15341 | −8.28922 | −0.3541 | 94.9598 | 0.0049 | 0.4595 |
| CC | 811.996 | 160545 | 253.407 | 3322.26 | 48.5007 | 8701.36 | 0.4620 | 28.138 |
| AB | −222.413 | −2876.47 | −59.4897 | −60.2333 | −2.9198 | −63.0476 | −0.0904 | −1.0666 |
| AC | 2861.48 | 55883.1 | 577.344 | −383.0 | −152.842 | 1207.62 | −0.8492 | 7.9333 |
| BC | −561.636 | −16323.2 | 28.5676 | 57.9333 | 22.8384 | −709.714 | −0.0096 | 0.36 |
CMC = carboxymethylcellulose; SA = stearic acid, L = luminosity; TS = tensile strength; WVP = water vapor permeability; AW = water activity.

Figure 1. Image of film detachment from its mold, shown to be smooth, clear, and transparent.
Download figure:
Standard image High-resolution image3.2. Elongation
The linear terms of the concentrations of G (A), CMC (B), and stearic acid (SA) (C) had significant effects (p ≤ 0.05) and the Fisher F values were 26.49, 6.69, and 21.31, respectively, implying that the model was significant. The coefficient of determination (R2) was 0.89 and the adjusted R2 was 0.77 for G response, indicating a good alignment between the observed and predicted values in the quadratic equation. The Durbin-Watson statistic (DW) is another value that shows the presence of autocorrelation between errors [31]. A DW value below 2 indicates a positive correlation and above 2 indicates a negative correlation [32]. If the DW value is close to 2, it implies a good fit of the model. The DW for elongation was 1.56686. The three-dimensional response surface graph (figure 2(a)) indicates an increase in the percentage of elongation of the films by increasing the glycerol content and decreasing the concentration of CMC. It was also observed that by increasing the concentration of SA, the elongation decreased.
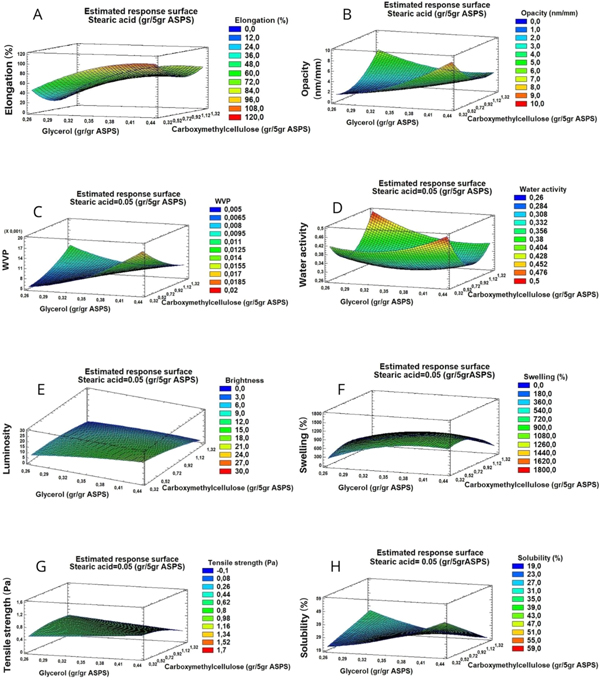
Figure 2. Response surface diagrams for glycerol (g g−1 acetylated sweet potato starch) and carboxymethylcellulose (g/5 g acetylated sweet potato starch) for a concentration of 0.05 g/5 g starch. (a) Elongation, (b) Opacity, (c) water vapor permeability, (d) water activity, (e) luminosity, (f) swelling, (g) stress force and (h) solubility.
Download figure:
Standard image High-resolution imageThe methodology developed to optimize the response surface led to the location of the stationary point, which represents the maximum point. The values of factors in which the highest percentage of elongation was presented were glycerol 0.43 g g−1 starch, CMC 0.45 g/5 g starch, and SA 0.007 g/5 g starch, which led to an elongation of 118% (table 3).
Table 3. Targets and levels of optimal factors.
| Levels of optimal factors | ||||||||
|---|---|---|---|---|---|---|---|---|
| Factors | Solubility | Swelling | Opacity | L | TS | %Elongation | WVP | WA |
| Glycerol | 0.28629 | 0.26591 | 0.26697 | 0.41149 | 0.4340 | 0.43409 | 0.26591 | 0.3524 |
| CMC | 1.17045 | 1.17045 | 0.49313 | 0.32955 | 0.4430 | 0.45785 | 0.33401 | 0.8356 |
| SA | 0.09204 | 0.08135 | 0.09204 | 0.09196 | 0.0079 | 0.00795 | 0.00795 | 0.0624 |
| Target | Minimize | Minimize | Minimize | Maximize | Maximize | Maximize | Minimize | Minimize |
| Optimal value | 14.1165 | 6.73352 | −0.03369 | 30.2618 | 1.8275 | 118.06 | 0.0031 | 0.2809 |
CMC = carboxymethylcellulose; SA = stearic acid, L = luminosity; TS = tensile strength; WVP = water vapor permeability; AW = water activity.
3.3. Opacity
The ANOVA indicated that the linear term glycerol concentration (A), the terms of the G-CMC (AB) interactions, G-SA (AC), and the quadratic term CMC (BB) had a significant effect (p  0.05). Fisher's F values of 15.58, 7.67, 7.22, and 5.69 respectively, implied that the model was significant. R2 was 0.84 and the adjusted R2 of 0.67, the statistical term DW (1.73) was close to 2, which indicated the model to be a good fit. The three-dimensional surface response diagram in figure 2(b) shows that high concentrations of G and SA, and low CMC, generate films with higher opacity values. The stationary point corresponding to the minimum opacity value of 0 (table 3) was reached with the amounts of G 0.26 g g−1 starch, CMC 0.49 g/5 g, and SA 0.09 g/5 g starch.
3.4. Permeability
The glycerol concentration (linear term A) was found to be significant (p ≤ 0.05) with reference to the permeability factor and showed a value of 13.32 in Fisher's F. The regression model had a moderate correlation value (R2) of 0.76 and adjusted R2 of 0.50. High G and low CMC concentrations generated films with higher water vapor permeability values, as can be seen in the three-dimensional response surface diagram in figure 2(c). The optimal conditions that minimized water vapor permeability were G 0.26 g g−1 starch, CMC 0.33 g/5 g, and SA 0.007 g/5 g starch. These process conditions were necessary to reach the stationary or minimum permeability point, which corresponded to a value of 0.0031 g msMPa−1 (table 3).
3.5. Water activity, luminosity, swelling, tensile strength, and solubility
In the production of films, the activity of water, luminosity, swelling, stress force, and solubility indicated that none of the concentrations of these variables had a significant effect ( ), except for the quadratic term of the concentration of CMC (BB) in the water activity and the linear term of the concentration of SA (C) in the luminosity, with values of Fisher F 8.36 and 11.38, respectively. R2 values were 71.75, 69.20, 67.50, 44.91, and 58.78%, respectively, and adjusted R2 values were 39.98, 34.55, 30.94, 26.77, and 12.47%, respectively, in which the probability of a good alignment between observed and predicted values in the quadratic equation was lower. The optimal values and targets to achieve the optimization are shown in table 3. However, only trends were observed in the factors analyzed (figures 2(d)–(h)). As the G concentration increased the luminosity, the swelling and solubility of the films also increased, and the tensile strength decreased. At high concentrations of CMC, the tensile strength increased and reduced the luminosity, swelling, and solubility. The presence of SA decreased the water activity and swelling, while increasing luminosity. Tables 4 and 5 summarize the experimental results (X) and those predicted by the equation for each of the answers using the complete equation (Y). Table 6 shows the correlation coefficients (R) between the response variables analyzed. A moderate correlation was found between the elongation (%) and the swelling of the films and between the elongation (%) and the strength of stress, indicating that the ease with which a film tends to stretch depends to some extent on its water content. An inverse behavior between elongation and stress force was also observed, which coincided with the results of another study [33] which evaluated these factors in films based on cassava starch.
Table 4. Results of theoretical and experimental calculations using regression equations.
| Solubility (%) | Swelling (%) | Opacity | Luminosity | |||||
|---|---|---|---|---|---|---|---|---|
| Run | X | Y | X | Y | X | Y | X | Y |
| 1 | 26.58 | 27.13 | 915.88 | 938.17 | 1.81 | 1.81 | 6.80 | 11.41 |
| 2 | 28.15 | 24.76 | 784.89 | 655.47 | 2.01 | 2.74 | 5.58 | 5.81 |
| 3 | 25.26 | 27.91 | 928.69 | 1019.55 | 3.65 | 3.82 | 15.98 | 13.44 |
| 4 | 27.21 | 27.13 | 925.07 | 938.17 | 1.72 | 1.81 | 14.63 | 11.41 |
| 5 | 28.48 | 27.13 | 957.33 | 938.17 | 1.88 | 1.81 | 4.05 | 11.41 |
| 6 | 26.79 | 29.61 | 901.85 | 801.05 | 4.54 | 3.76 | 11.06 | 14.08 |
| 7 | 26.17 | 27.13 | 914.96 | 938.17 | 1.81 | 1.81 | 20.72 | 11.41 |
| 8 | 34.11 | 28.65 | 1609.04 | 1425.65 | 2.11 | 1.61 | 9.98 | 8.43 |
| 9 | 24.22 | 25.58 | 853.02 | 701.07 | 0.74 | 1.13 | 21.57 | 17.64 |
| 10 | 27.45 | 26.48 | 750.48 | 1065.18 | 1.72 | 1.37 | 4.66 | 6.29 |
| 11 | 49.91 | 41.98 | 874.16 | 1120.11 | 5.80 | 5.68 | 24.47 | 22.27 |
| 12 | 26.33 | 25.82 | 763.30 | 879.93 | 1.25 | 2.16 | 5.15 | 6.88 |
| 13 | 27.19 | 35.52 | 1152.59 | 1069.38 | 2.52 | 2.68 | 2.85 | 2.75 |
| 14 | 30.31 | 33.68 | 1230.09 | 893.68 | 3.64 | 4.35 | 10.67 | 13.81 |
| 15 | 23.58 | 28.48 | 1065.11 | 1017.10 | 2.45 | 2.90 | 21.34 | 26.10 |
| 16 | 31.42 | 27.49 | 438.68 | 544.79 | 2.39 | 1.62 | 6.82 | 6.93 |
| 17 | 23.49 | 21.24 | 410.56 | 482.44 | 2.50 | 2.36 | 14.71 | 14.95 |
| 18 | 25.61 | 26.52 | 711.55 | 757.66 | 4.81 | 3.94 | 20.61 | 16.58 |
X = Experimental response values; Y = Response values predicted by the second-degree polynomial model.
Table 5. Results of theoretical and experimental calculations using regression equations.
| Run | TS (MPa) | Elongation (%) | WVP (g msMPa−1) | WA | ||||
|---|---|---|---|---|---|---|---|---|
| X | Y | X | Y | X | Y | X | Y | |
| 1 | 0.637 | 0.716 | 61.84 | 62.72 | 0.0095 | 0.0076 | 0.278 | 0.289 |
| 2 | 0.540 | 0.717 | 59.40 | 66.32 | 0.0091 | 0.0077 | 0.362 | 0.336 |
| 3 | 1.156 | 0.214 | 95.42 | 100.85 | 0.0142 | 0.0129 | 0.355 | 0.392 |
| 4 | 0.637 | 0.716 | 67.90 | 62.72 | 0.0076 | 0.0076 | 0.295 | 0.289 |
| 5 | 0.637 | 0.716 | 56.58 | 62.72 | 0.0063 | 0.0076 | 0.290 | 0.289 |
| 6 | 0.608 | 0.186 | 93.44 | 92.70 | 0.0090 | 0.0092 | 0.402 | 0.404 |
| 7 | 0.637 | 0.716 | 65.63 | 62.72 | 0.0073 | 0.0076 | 0.290 | 0.289 |
| 8 | 0.926 | 0.452 | 113.02 | 101.59 | 0.0076 | 0.0083 | 0.395 | 0.370 |
| 9 | 0.558 | 0.738 | 58.86 | 48.93 | 0.0076 | 0.0080 | 0.299 | 0.326 |
| 10 | 0.756 | 0.696 | 86.89 | 92.46 | 0.0098 | 0.0099 | 0.332 | 0.320 |
| 11 | 0.246 | 0.263 | 88.12 | 84.74 | 0.0106 | 0.0111 | 0.403 | 0.369 |
| 12 | 0.703 | 0.635 | 65.50 | 71.07 | 0.0054 | 0.0056 | 0.411 | 0.388 |
| 13 | 0.450 | 0.826 | 66.82 | 65.83 | 0.0071 | 0.0071 | 0.321 | 0.370 |
| 14 | 0.636 | 0.674 | 74.02 | 73.29 | 0.0119 | 0.0121 | 0.336 | 0.325 |
| 15 | 0.519 | 0.543 | 37.01 | 54.55 | 0.0103 | 0.0086 | 0.307 | 0.307 |
| 16 | 0.640 | 1.183 | 13.88 | 20.78 | 0.0085 | 0.0072 | 0.345 | 0.331 |
| 17 | 0.876 | 0.887 | 35.74 | 25.94 | 0.0075 | 0.0092 | 0.339 | 0.317 |
| 18 | 0.418 | 0.702 | 68.54 | 58.60 | 0.0075 | 0.0078 | 0.269 | 0.307 |
X = Experimental response values; Y = Response values predicted by the second-degree polynomial model. L = luminosity; TS = tensile strength; WVP = water vapor permeability; AW = water activity.
Table 6. Correlation coefficients.
| Solubility | Swelling | Opacity | L | TS | Elongation | WVcP | WA | |
|---|---|---|---|---|---|---|---|---|
| Solubility | 1 | |||||||
| Swelling | 0.182 | 1 | ||||||
| Opacity | 0.528 a | 0.003 | 1 | |||||
| L | 0.173 | −0.043 | 0.390 | 1 | ||||
| TS | −0.223 | −0.157 | −0.277 | −0.043 | 1 | |||
| Elongation | 0.317 | 0.620 b | 0.320 | 0.038 | 0.121 | 1 | ||
| WVP | 0.181 | 0.132 | 0.457 | 0.24 | 0.291 | 0.270 | 1 | |
| WA | 0.480 a | 0.109 | 0.289 | −0.156 | −0.00 | 0.403 | 0.132 | 1 |
a Significant and. b highly significant at p ≤ 0.05 and 0.01 respectively.L = luminosity; TS = tensile strength; WVP = water vapor permeability; AW = water activity.
3.6. Simultaneous optimization of elongation and permeability to water vapor
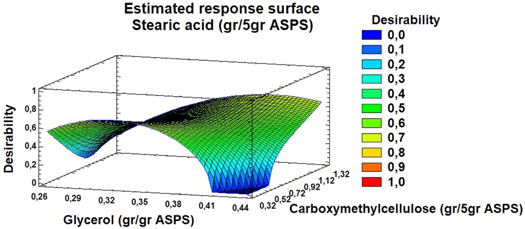
After analyzing the surface response model, a good correlation was observed for the prediction relating to the factors of opacity, elongation, and permeability to water vapor. However, as the minimum and maximum opacity values obtained did not greatly affect the appearance of the films, the desirability function in MSR was tested to demonstrate simultaneously that the best responses (elongation and permeability) were affected by the combination of experimental parameters, which led to the acquisition of optimal conditions based on the established criteria of minimum and maximum levels of the selected response variables. The general approach of the desirability function ranges from 0 (completely undesirable response) to 1 (fully desired response) [34]. In figure 3, the three-dimensional response surface implies that concentrations of G and CMC near the upper limit generate a general desirability value of 0.92 for simultaneous optimization.
Figure 3. Response surface diagram for simultaneous optimization. The effect of the concentration of glycerol (gr/gr acetylated sweet potato starch) and carboxymethylcellulose (gr/5gr acetylated sweet potato starch) for a concentration of 0.05 gr/5gr acetylated starch.
Download figure:
Standard image High-resolution image
From the response surface graphs and the data, a simultaneous optimization was achieved using a concentration of glycerol 0.30 g g−1 starch, CMC 0.32 g/5 g starch, and SA 0.007 g/5 g starch. This desirability model predicted 99.62% elongation and 0.005 g msMPa−1 (table 7) permeability to water vapor. Additionally, the predicted optimal values for response variables were compared with the predicted values for simultaneous optimization. For the validation of the results predicted by the simultaneous optimization, verification of the experiments was performed in triplicate, which resulted in 91.846% elongation and 0.005 g msMPa−1. The good correlation between these results confirmed the suitability of the model to reflect the expected simultaneous optimization since the difference between the predicted and experimental values was less than 7.80% for elongation and 1.81% for WVP. The results were related to the data from the optimization analysis using desirability functions, which indicated that the composite core design star points with the desirability function for the two selected responses can effectively optimize the characterization parameters.
Table 7. Simultaneous optimization.
| Response variable | Predicted optimal value | Predicted value of simultaneous optimization | Value of experimental optimization a | Percentage difference |
|---|---|---|---|---|
| Elongation (%) | 118.06 | 99.6201 | 91.85 ± 2.91 | 7.80 |
| WVP (g msMPa−1) | 0.0031 | 0.542 | 0.50 ± 0.0008 | 1.81 |
Table 8 shows the complete characterization of the optimized film, and that the modification by acetylation and incorporation of CMC, SA, and G produce films with a higher percentage of elongation than films obtained with only other sources of starch such as potato with 57.4% [35], and higher than those presented with sweet potato starch and G with 11.24% [36]. This increase in elongation is because the modification of starch allows the masking of some of the OH groups of glucose with acetyl groups, thus increasing the flexibility between polysaccharide chains. There was also an increase in the tensile force, attributable to the formation of intermolecular interactions between the OH groups still present in the starch and the carboxyl group of the CMC, during the processing and drying of the films. The original hydrogen bonds could be replaced by new ones formed between the OH groups in the starch molecules and the hydroxyl and carboxyl groups in the CMC. This intermolecular interaction between starch and CMC results in a more compact molecular structure, thus increasing tensile strength [33].
Table 8. Optimized characterization of the film.
| Factor | Value a |
|---|---|
| Solubility (%) | 23.84 ± 1.49 |
| Swelling (%) | 607.69 ± 5.43 |
| Opacity | 1.52 ± 0.06 |
| Luminosity | 7.25 ± 0.75 |
| TS (MPa) | 20.80 ± 0.14 |
| Elongation (%) | 91.85 ± 2.90 |
| WVP (g msMPa−1) | 0.55 ± 0.00 |
| WA | 0.35 ± 0.02 |
Optimization has been reported through the response surface of films focused on food coatings from various starch sources. However, there is little literature found to date evaluating the properties obtained with acetylated starch of purple sweet potato. Indrianti et al [37] produced edible films prepared from native sweet potato starch (SPS) or modified sweet potato starch by heat-moisture treatment (HMT). The results obtained were higher in the elongation percentages, similar in tensile strength and water vapor permeability, and lower in solubility. Mohd and Muhamad [38] used the central design composed of 2 factors with a factorial of 10, as well as 2 central points, studying purple sweet potato starch to which were added glycerol as plasticizer and carrageenan kappa as gelling agent. Thakur et al [39] reported the optimization of a film made from pea starch and chitosan. Paramanantham and Thottiam [40] used tapioca starch with glycerol and acetic acid in the development of a biodegradable polymer film and applied the Box-Behnken design with four factors on three levels to study the individual and interactive effects of the film composition and the Barrier property of the developed film. Monteiro et al [41] applied the statistical design of the experiments, combined with regression techniques, to optimize the conditions for improving the mechanical properties of starch films. These studies concluded that the incorporation of materials in polymer matrices and starch source improves the physical, mechanical, and optical properties of films. These basic data on the influence of variables on the properties of starch-based films are important for assessing the applicability of films in the food and pharmaceutical industries. Therefore, the formulation used in our study can obtain a low permeability to water vapor (0.55 g msMPa−1), high elongation percentage, and low solubility, which allows the film to be considered for food packaging, in addition to being converted into a functional edible film incorporating compounds such as antioxidants, reinforcements, and sensors with favorable results, reflecting a positive perspective on the marketing of starch food packaging in the food industry.
3.7. Effect of process variables
3.7.1. Concentration of glycerol
The increase of G in the film-forming solution caused a tendency to increase solubility, swelling, opacity, luminosity, and permeability to water vapor; however, lower values of tensile strength were found. The increase in solubility and swelling of the films is because G could interact with water and interrupt the network by hydrogen bonds, reducing the cohesion of the starch matrix and increasing the solubility in water. Higher water solubility values were possibly due as a result of weaker interaction between network components [42], facilitating the movement of water. The stress force (TS) increases with the decrease of the plasticizer concentration. This phenomenon can be explained by the role of G in decreasing the strong intramolecular hydrogen bond between the polymer matrices. The efficacy of G for tensile strength reduction is due to the hydrophilic nature of the compound that retains more water molecules and produces a more intense plasticizing effect, which in turn increases the spatial difference between the polymer chains and decreases the tensile strength [39]. The increase in WVP was because of G in the films causing the reduction of intermolecular bonds between polymer chains [42].
3.7.2. Concentration of CMC
The increase in the amount of CMC in the film caused a tendency to decrease solubility, swelling, opacity, luminosity, elongation, water vapor permeability and water activity, but an increase in the tensile strength. The increase in tensile strength is perhaps attributable to the formation of intermolecular interactions between the starch hydroxyl group and the CMC carboxyl group [43]. During the processing and drying of composite films, original hydrogen bonds formed between starch molecules could be replaced by new ones formed between the hydroxyl groups in starch molecules and the hydroxyl and carboxyl groups in the CMC [44]. The intermolecular interaction between starch and CMC results in a more compact molecular structure of the starch and CMC mixture, thus increasing tensile strength. The decreased solubility in the films may have indicated an intermolecular interaction between starch and CMC in the films. The hydroxyl group and the carboxyl group of the CMC can form strong hydrogen bonds [44, 45] and ester bonds [46] respectively, with the starch hydroxyl groups, thus improving the interactions between molecules and the cohesion of the biopolymer matrix. The reduction of the WVP with the increase of the CMC content resulted in an improvement of the functional properties of these films, considering the hydrophilic characteristics of the matrix. The decrease in WVP by incorporation of secondary biopolymers could be attributed to the highly crystalline and hydrophobic character of the cellulose fiber, compared to the starch polymer. The addition of CMC could interfere to pass the water molecule and block the transmission of water vapor [45].
3.7.3. Concentration of stearic acid
Fatty acids are incorporated into the film matrix to improve its moisture barrier properties [46]. The increase of SA in the film decreases the swelling, elongation, permeability to water vapor, and water activity of the film, but increases opacity, luminosity, and stress force. The decrease in the above factors may be due to the fatty acid covering the granular surface of the sweet potato starch and increasing its hydrophobicity, and this influences the transfer of water to the film matrix. SA can create effective barriers to water vapor and provide structural support, thus restricting the transfer of water vapor through starch-based films [46].
4. Conclusions
Native sweet potato acetylated starch films with improved properties were achieved using a composite core design with star points and simultaneous optimization. A formulation was obtained using 0.30 g/g starch, CMC 0.32 g/5 g starch, and stearic acid 0.007 g/5 g starch, which exhibited the ability to obtain low permeability to water vapor, a high percentage of elongation, and low solubility. Additionally, basic data were obtained on the influence of CMC, SA, and G on the properties of films that are important to evaluate the applicability of films in food packaging and/or coatings. Therefore, the films generated can be considered as a basis in the development of smart packaging that determines the state of freshness, alterations in the cold chain, microbial contamination, and even communicates the authenticity of the product.
Acknowledgments
Rafael Contreras Chávez gratefully acknowledges the support of CONACYT—Mexico for the PhD scholarship received, and the Coordinación de la Investigación Científica - Universidad Michoacana de San Nicolás de Hidalgo for financing the project in 2021.
Data availability statement
All data that support the findings of this study are included within the article (and any supplementary files).
Declarations of conflict of interest
The authors declare that there are no conflicts of interest.